

Abstract
Integrated mapping in large-genome monocots has been carried out on a limited number of species. Furthermore, integrated maps are difficult to construct for these species due to, among other reasons, the specific plant populations needed. To fill these gaps, Alliums were chosen as target species and a new strategy for constructing suitable populations was developed. This strategy involves the use of trihybrid genotypes in which only one homeolog of a chromosome pair is recombinant due to interspecific recombination. We used genotypes from a trihybrid Allium cepa × (A. roylei × A. fistulosum) population. Recombinant chromosomes 5 and 8 from the interspecific parent were analyzed using genomic in situ hybridization visualization of recombination points and the physical positions of recombination were integrated into AFLP linkage maps of both chromosomes. The integrated maps showed that in Alliums recombination predominantly occurs in the proximal half of chromosome arms and that 57.9% of PstI/MseI markers are located in close proximity to the centromeric region, suggesting the presence of genes in this region. These findings are different from data obtained on cereals, where recombination rate and gene density tends to be higher in distal regions.
INTEGRATED mapping in large-genome monocots has focused primarily on cereals (Gill et al. 1996a,b; Künzel et al. 2000; Cone et al. 2002). However, it is obvious that these species represent only a small fraction of the large-genome monocots. Therefore to obtain a more comprehensive insight into the chromosome organization of these species, more of them need to be studied.
Multiple approaches have been used to develop integrated maps. The first approach is based on the construction of a physical map via contig assembly of large insert DNA clones, such as yeast artificial chromosomes (YAC) or bacterial artificial chromosomes (BAC), and on the comparison of this map with a genetic linkage map. This approach was used for the completely sequenced Arabidopsis genome (Schmidt et al. 1995), the almost sequenced rice genome (Wu et al. 2003), and the partly sequenced maize genome (Civardi et al. 1994; Cone et al. 2002; Fang et al. 2003). However, complete genome sequencing of large-genome species, such as Alliums, is expensive, time consuming, and may not be possible yet. The second approach combines in situ hybridization of BACs or YACs on plant chromosomes (Cheng et al. 2001; Kulikova et al. 2001) with recombination maps. This approach can be routinely used in plant species with small genomes, but it is less applicable for large-genome species that contain a huge amount of dispersed, repetitive DNA sequences. The third approach consists of the application of deletion or translocation lines to create physical landmarks on the genomes analyzed and to relate these to recombination maps. This approach, which was predominantly carried out in wheat, has yielded considerable success. An integrated map of all 21 chromosomes based on 436 deletion lines was constructed (Gill et al. 1996a,b; Sandhu et al. 2001; Sandhu and Gill 2002). However, this approach cannot be used for diploid species, because diploid organisms do not tolerate large deletions. To overcome this problem, Künzel et al. (2000) constructed an integrated map of barley based on translocation breakpoints as physical landmarks for mapping of RFLP markers that were transformed into PCR markers using microdissection of translocated chromosomes. However, this method requires the construction of translocation lines and a very accurate determination of breakpoint positions, which is rather complicated. The fourth, less explored possibility for the construction of integrated genetic and physical maps is the visualization of recombination points in interspecific hybrids via genomic in situ hybridization (GISH). This technique was successfully applied toward the development of an integrated map of the grasses Lolium perenne/Festuca pratensis using 16 recombinant lines that carried a F. pratensis segment increasing in size on the nucleolar organizer region (NOR)-bearing chromosome in a background of L. perenne (King et al. 2002).
The aim of our study was to construct integrated physical and recombination maps of a large-genome monocot not previously analyzed and to contribute to the study of the chromosome organization of these species. The construction of integrated maps in Alliums will enable a thorough analysis of recombination frequencies along its chromosomes, will allow for a comparison of genetic and physical distances, and will make it possible to study the physical distribution of two types of AFLP markers produced by restriction enzyme combinations sensitive (PstI/MseI) and nonsensitive (EcoRI/MseI) to methylation.
Until recently only a few studies had analyzed the physical distribution of AFLP markers along plant chromosomes compared to studies focusing on RFLP marker distribution. The chromosomal organization of five cloned AFLP fragments in asparagus using FISH mapping was reported by Reamon-Büttner et al. (1999). Nulli-tetrasomic lines of wheat were used to assign AFLP markers to specific chromosome arms (Huang et al. 2000). The AFLP marker distribution on all five chromosomes of the completely sequenced Arabidopsis genome has been presented (Peters et al. 2001) and recently King et al. (2002) reported the physical distribution of 104 AFLP markers along the NOR-bearing chromosome of F. pratensis.
We employed GISH and AFLP technology to construct integrated maps, but we applied a novel strategy for development of the mapping population. The plant material used was an Allium trihybrid population, which originated from a cross between Allium cepa and (Allium roylei × Allium fistulosum). This population represents an ideal source for integrated mapping, because in each chromosome pair one homeologous chromosome originates from the interspecific hybrid between A. roylei and A. fistulosum, and recombination sites on such a chromosome can be visualized via GISH (Khrustaleva and Kik 1998). Furthermore, A. roylei and A. fistulosum recombine readily in meiosis (0.5–2.0 recombination points/chromosome) and recombination takes place randomly (Khrustaleva and Kik 2000). For direct physical mapping, we compared the AFLP profiles of individual genotypes with the corresponding recombinant chromosomes. Simultaneously for A. roylei and A. fistulosum, integrated physical and recombination maps of chromosome 5 and 8 were constructed.
MATERIALS AND METHODS
Plant material:
Fourteen progeny plants from a trihybrid population, A. cepa × (A. roylei × A. fistulosum); PRI nr 96284), were used to assign AFLP markers to their respective chromosomal subregion. As abbreviations for A. cepa, A. fistulosum, and A. roylei, CC, FF, and RR, respectively, were used. All these species are closely related (van Raamsdonk et al. 2003) and are diploids (2n = 2x = 16). RF is used to indicate the interspecific hybrid between A. roylei and A. fistulosum. The CC × RF population was produced using A. cepa (CC; cytoplasmatic male sterile) as a female parent and an interspecific hybrid between A. roylei and A. fistulosum (RF) as a male parent. Blow flies were used for pollination and plants were grown in pots in a frost-free greenhouse.
GISH:
Genomic DNA of A. roylei and A. fistulosum was used as probes for GISH and labeled with digoxigenin-11-dUTP and biotin-16-dUTP, respectively, by a standard nick-translation protocol (Roche Diagnostics GmbH, Mannheim, Germany). The GISH procedure and mitotic chromosome spreads were performed as described by Khrustaleva and Kik (1998). Briefly, the hybridization mix contained 50% (v/v) deionized formamide, 10% (w/v) sodium dextran sulfate, 2× SSC, 0.25% (w/v) SDS, 1 ng/μl SDS, 1 ng/μl biotin-labeled DNA of A. fistulosum, 1 ng/μl digoxigenin-labeled DNA of A. roylei, and 0.05–0.06 μg/μl block DNA of A. cepa. The washing stringency was 78% (0.1× SSC for 30 min at 48°). Biotin-labeled DNA was detected with CY3-conjugated streptavidin (Jackson ImmunoResearch Laboratories, West Grove, PA) and amplified with biotinyled goat-antistreptavidin (Vector Laboratories, Burlingame, CA). Digoxigenin-labeled DNA was detected with antidigoxigenin-fluorescein raised in sheep (Boehringer, Mannheim, Germany) and amplified with fluorescein anti-sheep immunoglobulin G raised in rabbit (Vector Laboratories).
Chromosome expansion factor:
To link the location of a recombination point observed via a GISH-analyzed chromosome to a chromosomal map of both A. roylei and A. fistulosum, the relative length of integrated segments needs to be known. However, direct use of the relative length of integrated segments is not possible, because of genome size differences between A. roylei and A. fistulosum (30.9 pg/2C and 24.8 pg/2C, respectively; Bennett and Leitch 1995). To account for the genome size effect, the chromosome expansion factor concept was developed (King et al. 2002). The calculation of the expansion factor was done by comparing the arm lengths in both A. roylei and A. fistulosum. For that, GISH analysis of chromosomes 5 and 8 took place in 50 well-spread metaphases of the interspecific hybrid between A. roylei and A. fistulosum (accession no. 91021, which is the male parent of the bridge cross). Comparison of A. roylei and A. fistulosum chromosomes in the same metaphase of the interspecific hybrid circumvented chromosome condensation effects. The measurements were performed on DAPI chromosomes by using a freeware computer application, namely MicroMeasure software for Windows, version 3.3 (http:/www.colostate.edu/Depts/Biology/MicroMeasure). The expansion factors for each arm were estimated as e = (Lr/Lf) − 1, where Lr is the arm length of A. roylei and Lf is the arm length of A. fistulosum. Furthermore, if the centromeric region in a recombinant chromosome belonged to A. roylei, the size of the introgressed A. fistulosum segment was increased by the expansion factor, and if the centromeric region belonged to A. fistulosum, the size of the introgressed A. roylei segment was decreased (Lc = Ls(1 ± e); Ls is the length of the introgressed segment, and Lc is the corrected length of the introgressed segment).
Karyotype analysis and identification of recombinant chromosomes:
Chromosome identification of Allium species is based on relative chromosome length and centromeric index. Only the NOR-bearing chromosome 6 can be easily identified on the basis of its specific morphology. In addition, molecular cytogenetic markers are available for chromosome 6 (45S rDNA) and for chromosome 7 (5S rDNA). The remaining six other chromosomes of the Allium genome have no molecular cytogenetic markers. Therefore, karyotype analysis becomes more complicated in interspecific hybrids that possess recombinant chromosomes. For karyotype analysis of recombinant chromosomes we developed software that uses the chromosomal expansion factor for the correction of the arm length of recombinant chromosomes. Karyotype analysis was made according to the standard onion nomenclature system proposed by Kalkman (1984) and confirmed by the Fourth Eucarpia Allium Symposium (De Vries 1990).
Construction of a CC × RF AFLP map:
An AFLP linkage map for the male parent of the trihybrid A. cepa × (A. roylei × A. fistulosum) population was constructed (De Melo 2003). The map consisted of 450 markers distributed among eight linkage groups that were assigned to their specific chromosomes (van Heusden et al. 2000). The map covered 661 cM of an expected length of 700–800 cM. Two restriction enzyme combinations, namely EcoRI/MseI and PstI/MseI, and a total of 23 primer combinations were used. AFLP fragments were named as described by van Heusden et al. (2000). For example, e35m52a-302f means restriction enzyme combination EcoI/MseI, primers e35 and m52, “a” identifies the additional seventh selective base, 302 is the length of the fragment, and “r” or “f” specifies whether a marker is specific for A. roylei or for A. fistulosum.
Localizing AFLP markers in a chromosomal subregion:
For the localization of markers in chromosomal subregions, AFLP profiles of individual genotypes were compared with their corresponding recombinant chromosomes. The genetic position of each physical recombination site was assumed to be in the middle between the last AFLP marker in the previous subregion and the first AFLP marker in the following subregion. Assuming that meiotic recombination between A. roylei and A. fistulosum chromatids is only reciprocal, the consensus physical map based on visualization via GISH physical recombination sites was split into A. roylei and A. fistulosum physical maps. Using MapChart (Voorrips 2002) a graphic file was produced in which the markers of A. roylei and A. fistulosum were assigned to their corresponding subregions on the A. roylei and A. fistulosum chromosomes. For simplicity, the physical length of each chromosome was given in physical units (pu) as proposed by King et al. (2002). The telomeric end of the short arm of each chromosome was considered 0 pu and the telomeric end of the long arm 100 pu.
RESULTS
Construction of integrated maps:
The integration of recombination and physical maps was done on a population originating from a cross between a diploid cytoplasmic male sterile A. cepa (CC) and a diploid interspecific hybrid between A. roylei (RR) and A. fistulosum (FF). Two criteria were used to select individuals from this population: (1) only one linkage group per chromosome and (2) physical recombination occurring at different positions along the entire chromosome, and if possible, the presence of recombination sites on either side of the centromere. Fourteen CC × RF genotypes (7 genotypes for chromosome 5 and 12 genotypes for chromosome 8; 5 genotypes in common) fulfilled these criteria and were used for the assignment of AFLP markers to physical subregions on the chromosome arms. The AFLP profiles of individual CC × RF plants assisted to a large extent in the selection of genotypes for GISH analysis (data not shown).
The measurement of the arm length of both A. roylei and A. fistulosum chromosomes 5 and 8 in the same metaphase plate of the interspecific hybrid between A. roylei and A. fistulosum, using GISH, allowed us to calculate very accurately the chromosome expansion factor. The expansion of the short and long arms of A. roylei chromosomes compared to the homeologous A. fistulosum chromosomes is given in Table 1.
TABLE 1.
Chromosome expansion factor ofA. roylei vs. A. fistulosum chromosome arms
| Chromosome no. | Expansion factor, e (mean ± S.E.) |
|---|---|
| Chromosome 5 | |
| Short arm | 0.19 ± 0.03 |
| Long arm | 0.23 ± 0.03 |
| Chromosome 8 | |
| Short arm | 0.13 ± 0.05 |
| Long arm | 0.27 ± 0.03 |
GISH analysis showed that the centromeric region of recombinant chromosome 5 in two genotypes belonged to A. roylei and in five genotypes originated from A. fistulosum (Figure 1). On the short arm four recombination sites and on the long arm six recombination sites (with the exception of the proximal recombination site in genotype 49) were used for physical mapping. In total, 10 physical recombination sites were integrated into the AFLP linkage group of chromosome 5. The integrated physical and recombination maps of chromosome 5 for both A. roylei and A. fistulosum are given in Figure 2.
Figure 1.—
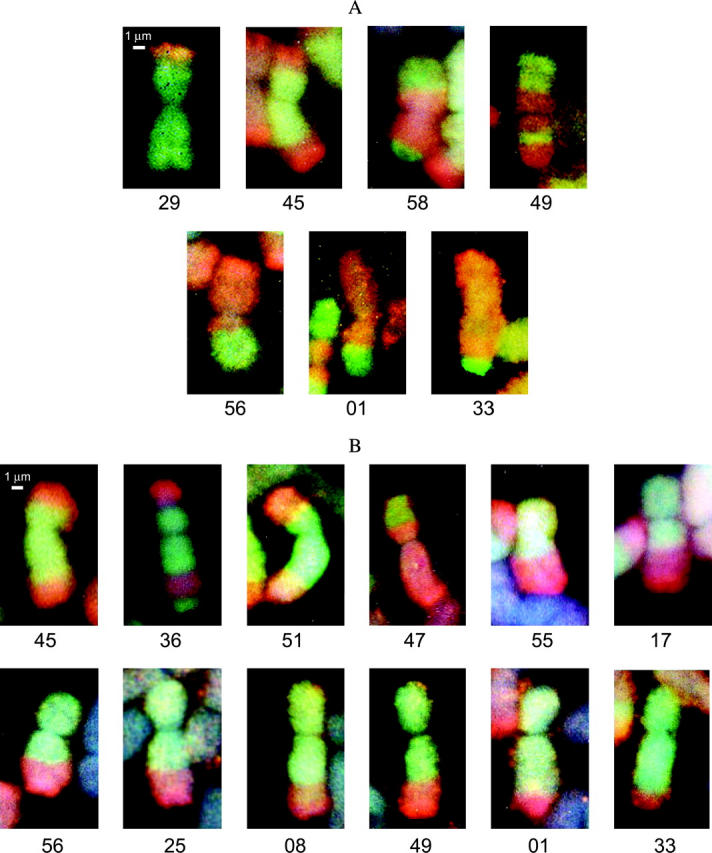
GISH images of recombinant A. roylei × A. fistulosum (RF) homeologous chromosomes for Allium chromosomes 5 (A) and 8 (B), respectively. Numbers below the GISH pictures indicate a specific CC × RF genotype. The A. roylei segment on a recombinant chromosome appears in green and the A. fistulosum segment in red.
Figure 2.—
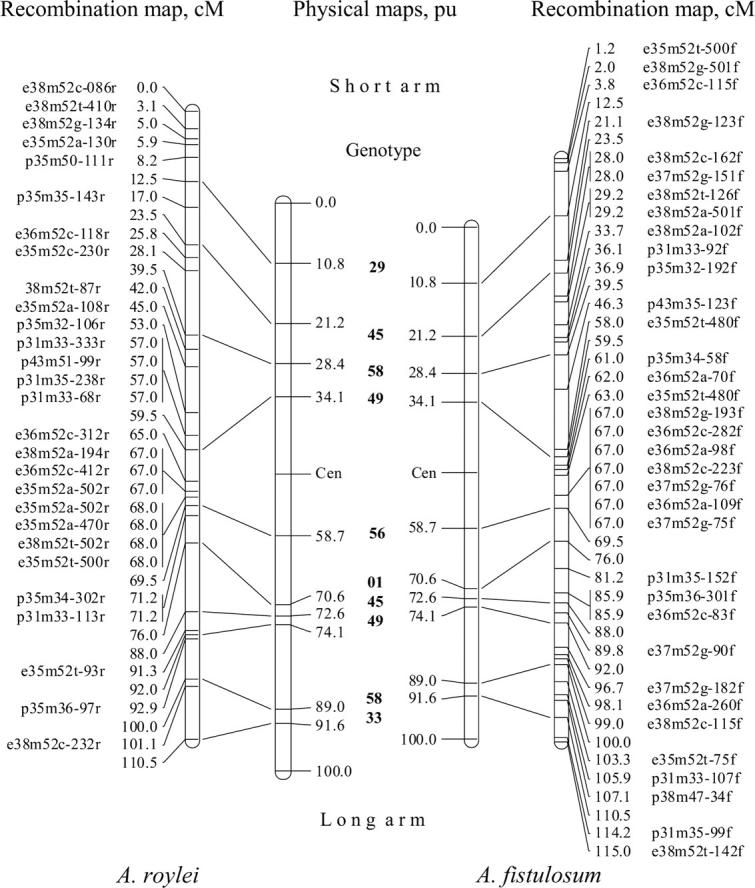
The integrated recombination and physical maps for recombinant A. roylei × A. fistulosum (RF), chromosome 5. The recombination and physical maps of the recombinant RF chromosome are split into the recombination and physical maps of A. roylei (left) and the recombination and physical maps of A. fistulosum (right). Horizontal lines on the physical maps indicate sites of recombination between A. roylei and A. fistulosum dividing the chromosome into subregions. The genotype numbers, from which the correspondent recombination sites were obtained, are shown in boldface type. On the recombination maps, markers are indicated as follows: e35m52a-302f means restriction enzyme combination EcoI/MseI, primers e35 and m52; “a” identifies the additional seventh selective base, 302 is the length of the fragment, and “f” or “r” specifies whether a marker is specific for A. roylei or for A. fistulosum. Recombination maps and physical maps are linked to each other by lines connecting observed physical recombination sites and their corresponding genetic sites.
For chromosome 8, the centromeric region of a recombinant chromosome originated from A. roylei in 11 genotypes and in 1 genotype from A. fistulosum (Figure 1). Four recombination sites were located in the proximal half of the short arm. In the long arm 10 recombination sites were used for physical mapping, 8 of them located in the interstitial part and two in the distal part. In total, 14 physical recombination sites were integrated into the linkage map of chromosome 8. The integrated physical and linkage maps of chromosome 8 for both A. roylei and A. fistulosum are given in Figure 3.
Figure 3.—
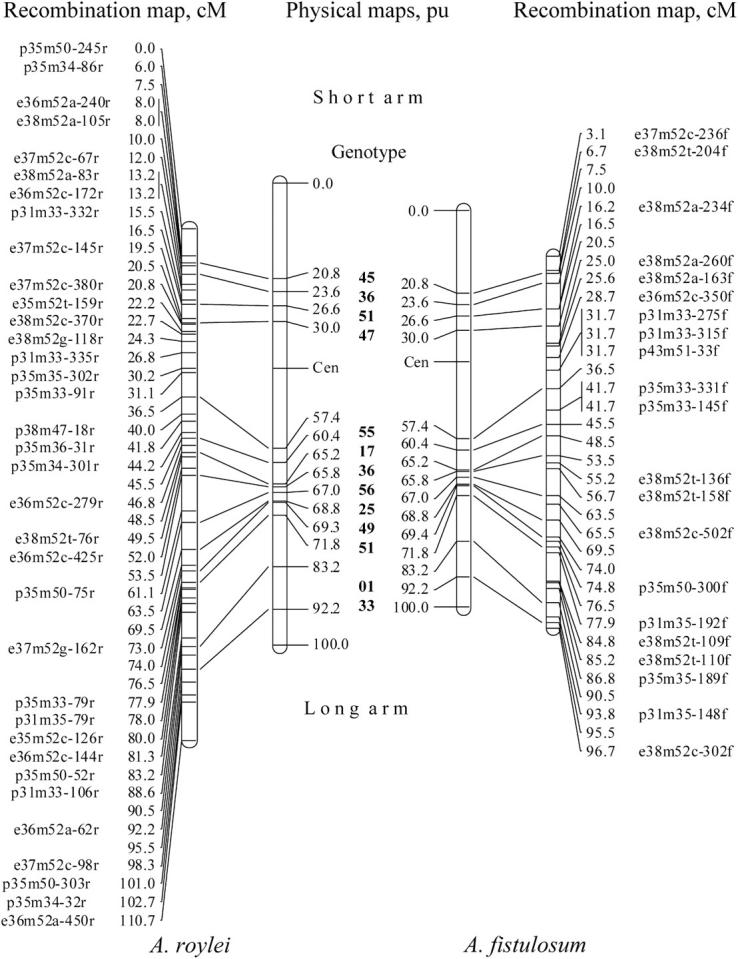
The integrated recombination and physical maps for the recombinant A. roylei × A. fistulosum (RF), chromosome 8. See legend to Figure 2.
Relationship between genetic and physical distance:
Through the integration of physical recombination sites into the AFLP linkage map we were able to visualize how genetic distance varied with physical distance along the entire chromosome. The density of recombination events per physical unit (centimorgans per physical unit) was calculated by dividing the length of a genetic subregion in centimorgans by the length of the corresponding physical subregion in physical units. The physical distribution of recombination along chromosome 5 is displayed in Figure 4. Recombination frequency was not uniform and varied among subregions. Three subregions with high recombination were observed, namely, one close to the centromeric subregion on the short arm between 28.4 and 34.1 pu (3.5% recombination/pu) and two on the long arm: one on the 70.6–72.6 pu subregion (6.0% recombination/pu) and a second one between 89.0 and 91.6 pu (4.0% recombination/pu). No statistically significant difference was found between the proximal and distal half of chromosome arms (excluding the centromeric region) with respect to recombination frequency (Mann-Whitney U-test; n1 = n2 = 5, U = 6, P = 0.11). In the large centromeric subregion (34.1–58.7 pu; the centromere is positioned at 47.4 pu), recombination events occurred very rarely (0.5%/pu). If we assume that DNA condensation is equal along entire chromosomes, then 1 cM corresponds to 32.0 Mb in the centromeric subregion while in the subregion with the highest recombination frequency, between 70.6 and 72.6 pu, 1 cM corresponds to 1.8 Mb.
Figure 4.—

Physical distribution of recombination frequencies along recombinant A. roylei × A. fistulosum (RF), chromosome 5. The frequency of recombination events per physical unit (centimorgans per physical unit) was calculated by dividing the length of a genetic subregion in centimorgans (percentage of recombination) by the length of the corresponding physical subregion in physical units and was plotted at the midpoint of each physical subregion. The arrow indicates the physical position of the centromere. Vertical lines on the chromosome ideogram indicate sites of recombination between A. roylei and A. fistulosum dividing the chromosome into subregions.
The recombination rate along chromosome 8 was clearly different between two arms (Figure 5). On the short arm, pronounced reduction of recombination events was found. On the long arm, high-recombination frequencies occurred in the proximal half of the arm, namely, between 65.2 and 65.8 pu (8.3% recombination/pu) and 65.8–67.0 pu (9.2% recombination/pu). A statistically significant difference in recombination frequency was found between the proximal and distal half of the chromosome arms (Mann-Whitney U-test; n1 = 4, n2 = 10, U = 7, P = 0.05). In the subregion with the highest recombination rate (65.8–67.0 pu), 1 cM corresponds to 1.4 Mb. Suppression of recombination (0.7% recombination/pu) was found in the large centromeric subregion (30–57.4 pu; the centromere is positioned at 38.6 pu), and in this subregion 1 cM corresponds to 31.3 Mb. The difference between genetic and physical positions was most pronounced in the short arm, where in the first subregion (0–20.8 pu) 1 cM corresponds to 74.3 Mb, and in the next subregion (20.8–23.6 pu) 1 cM corresponds to 4.1 Mb. Furthermore, the length of the recombination map of the short arm of chromosome 8, excluding the relatively large centromeric region, proved to be significantly shorter (18.5 cM/30.0 pu) compared to the long arm (75.5 cM/42.6 pu). No such difference was found for chromosome 5 (Table 2).
Figure 5.—

Physical distribution of recombination frequencies along recombinant A. roylei × A. fistulosum (RF), chromosome 8. See legend to Figure 4.
TABLE 2.
Recombination rate and arm length per chromosome
| Chromosome no. | Arm ratio | No. of physical recombination sites |
Length of physical map (pu)a | Length of recombination map (cM)a |
|---|---|---|---|---|
| Chromosome 5 | 1.08 | |||
| Short arm | 4 | 34.1 | 57.0 | |
| Long arm | 6 | 42.6 | 47.0 | |
| Chromosome 8 | 1.64 | |||
| Short arm | 4 | 30.0 | 18.5 | |
| Long arm | 10 | 42.6 | 77.5 |
Length of subregion possessing the centromere is excluded from the length of both physical and recombination maps.
Physical distribution of AFLP markers:
For the analysis of marker distribution over physical subregions we used marker density (i.e., number of markers per physical unit), because the length of the subregions were not the same as they ranged from 1.0 to 29.4 pu. The 64 AFLP markers from the linkage group assigned to chromosome 5 were not evenly distributed along the chromosome (Figure 6). On the short arm, a high density of AFLP markers (1.9 markers/pu) was found in the proximal subregion 28.4–34.1 pu that carries mostly PstI/MseI markers. On the long arm, two subregions with high marker density (1.5 markers/pu), namely, 70.6–72.6 pu and 89–91.6 pu, which carry both types of markers, and one subregion 72.6–74.1 (1.3 markers/pu) harboring only EcoRI/MseI markers were observed. In the subregions with high marker density, the highest recombination rates were found. In the centromeric subregion (34.1–58.7 pu) comprising 24.6% of chromosome length, the marker density was low (0.5 marker/pu).
Figure 6.—

Physical distribution of AFLP markers along recombinant A. roylei × A. fistulosum (RF), chromosome 5. The density of AFLP markers present in each chromosomal subregion is plotted at the midpoint of each subregion. The arrow indicates the physical position of the centromere. Vertical lines on the chromosome ideogram indicate sites of recombination between A. roylei and A. fistulosum dividing the chromosome into subregions.
The number of PstI/MseI and EcoRI/MseI markers per chromosomal subregion is given in Table 3. On the short arm, in the distal subregion (0–10.8 pu) the number of EcoRI/MseI markers considerably exceeded the number of PstI/MseI markers. However, in the more proximal subregion (28.4–34.1 pu), the situation was reversed: the number of PstI/MseI markers exceeded the number of EcoRI/MseI markers. In the centromeric subregion, 16 EcoRI/MseI and no PstI/MseI markers were found. On the long arm, the difference between both marker types was less pronounced compared to the short arm. To determine whether both marker types differed in their distribution along the chromosome, the Fisher exact probability test was applied to the total number (A. fistulosum and A. roylei) of PstI/MseI and EcoRI/MseI markers for the 11 chromosomal subregions along the chromosome and a highly significant difference between both marker types (Fisher exact probability test; P = 2.4 × 10⁻⁵) was found. In total, 63.4% of the PstI/MseI were found in close proximity to the centromeric subregion.
TABLE 3.
Distribution ofPstI/MseI andEcoRI/MseI markers along recombinantA. roylei/A. fistulosum chromosome 5
| Type of marker
|
||||||
|---|---|---|---|---|---|---|
|
PstI/MseI
|
EcoRI/MseI
|
|||||
| Chromosomal subregion (pu) | A. fistulosum | A. roylei | Total | A. fistulosum | A. roylei | Total |
| Short arm | ||||||
| 00–10.8 | 0 | 1 | 1 | 3 | 5 | 8 |
| 10.8–21.2 | 0 | 1 | 1 | 1 | 0 | 1 |
| 21.2–28.4 | 2 | 0 | 2 | 2 | 5 | 7 |
| 28.4–34.1 | 3 | 6 | 9 | 0 | 2 | 2 |
| Total per arm | 5 | 8 | 13 | 9 | 9 | 18 |
| Centromeric subregion | 0 | 0 | 0 | 9 | 7 | 16 |
| Long arm | ||||||
| 58.7–70.6 | 0 | 2 | 2 | 0 | 0 | 0 |
| 70.6–72.6 | 2 | 0 | 2 | 1 | 0 | 1 |
| 72.6–74.1 | 0 | 0 | 0 | 1 | 1 | 1 |
| 74.1–89.0 | 0 | 1 | 1 | 3 | 0 | 3 |
| 89.0–91.6 | 2 | 0 | 2 | 1 | 1 | 2 |
| 91.6–100 | 1 | 0 | 1 | 1 | 0 | 1 |
| Total per arm | 5 | 3 | 8 | 6 | 2 | 8 |
Fifty-six AFLP markers were assigned to 15 physical subregions on chromosome 8. The number of markers on the long arm considerably exceeded the number of markers on the short arm: 78.6% of markers were located on the long arm. The marker density varied among various chromosomal subregions (Figure 7). Four subregions with a high density of AFLP markers were found in the proximal half of the long arm: the first one, 57.4–60.4 pu close to the centromeric subregion, carries only PstI/MseI markers (1.7 markers/pu); the second one, 65.2–65.8 pu, carries only EcoRI/MseI markers (3.3 markers/pu); the third one, 65.8–67.0 pu, carries both marker types (2.5 markers/pu); and the fourth one, 69.4–71.8 pu, carries only EcoRI/MseI markers (1.7 markers/pu). Also the highest-recombination frequency was observed in these regions. The marker density on the short arm was low in all subregions and ranged from 0.2 to 1.1 markers/pu. In the centromeric subregion (30–57.4 pu) spanning 27.4% of the total chromosome length, the number of markers per physical unit was 0.5. Remarkably, six PstI/MseI markers were located in the centromeric subregion. The distribution of the PstI/MseI and EcoRI/MseI markers over the chromosomal subregions is given in Table 4. In contrast to chromosome 5, no statistically significant differences were found between the two types of markers in their distribution along the chromosome (Fisher exact probability test; P = 0.1062). In total, 52.3% of the PstI/MseI markers were found in the proximal half of the chromosome arms.
Figure 7.—

Physical distribution of AFLP markers along recombinant A. roylei × A. fistulosum (RF), chromosome 8. See legend to Figure 6.
TABLE 4.
Distribution ofPstI/MseI andEcoRI/MseI markers along recombinantA. roylei/A. fistulosum chromosome 8
| Type of marker
|
||||||
|---|---|---|---|---|---|---|
|
PstI/MseI
|
EcoRI/MseI
|
|||||
| Chromosomal subregion (pu) | A. fistulosum | A. roylei | Total | A. fistulosum | A. roylei | Total |
| Short arm | ||||||
| 00–20.8 | 0 | 3 | 3 | 1 | 0 | 1 |
| 20.8–23.6 | 0 | 0 | 0 | 1 | 2 | 3 |
| 23.6–26.6 | 0 | 0 | 0 | 0 | 3 | 3 |
| 26.6–30.0 | 0 | 1 | 1 | 1 | 0 | 1 |
| Total per arm | 0 | 4 | 4 | 3 | 5 | 8 |
| Centromeric subregion | 3 | 3 | 6 | 3 | 5 | 8 |
| Long arm | ||||||
| 57.4–60.4 | 2 | 3 | 5 | 0 | 0 | 0 |
| 60.4–65.2 | 0 | 0 | 0 | 0 | 1 | 1 |
| 65.2–65.8 | 0 | 0 | 0 | 0 | 2 | 2 |
| 65.8–67.0 | 0 | 1 | 1 | 2 | 0 | 2 |
| 67.0–68.8 | 0 | 0 | 0 | 1 | 0 | 1 |
| 68.8–69.4 | 0 | 0 | 0 | 0 | 1 | 1 |
| 69.4–71.8 | 1 | 0 | 1 | 0 | 0 | 0 |
| 71.8–83.2 | 2 | 4 | 6 | 2 | 2 | 4 |
| 83.2–92.2 | 1 | 0 | 1 | 0 | 1 | 1 |
| 92.2–100 | 0 | 2 | 2 | 1 | 1 | 2 |
| Total per arm | 6 | 10 | 16 | 6 | 8 | 14 |
DISCUSSION
Most studies on the integration of physical and genetic maps have been carried out using species in which the construction of integrated maps was based on intraspecific recombination. Here we present the construction of integrated maps that are based on interspecific recombination. This proved to be an effective strategy because of (i) the relatively simple and fast way to develop the mapping population; (ii) the possibility of visualizing physical recombination sites via GISH; and (iii) the low cost, as it does not require sequence information and construction of BAC or YAC libraries.
The results reported here are mostly in agreement with other published work on large-genome monocots: (i) the recombination hotspots are restricted to a few chromosomal regions, (ii) the physical density of markers corresponds closely to the distribution of recombination, and (iii) a high degree of suppression of recombination occurs in centromeric regions. However, some differences were observed between Alliums and other large-genome monocots: (i) in Alliums, recombination predominantly occurs in the proximal half of a chromosome arm and (ii) 57.9% of PstI/MseI markers in Alliums are located in the proximity of the centromeric region.
Specificity of recombination distribution:
High levels of recombination for chromosomes 5 and 8 were found in the proximal half of the chromosome arms. This result is in contrast to data obtained on cereals, where highly recombinogenic regions were found in the distal 20–30% of the chromosome arms in wheat (Gill et al. 1996a,b; Sandhu and Gill 2002; Akhunov et al. 2003), barley (Pedersen et al. 1995; Künzel et al. 2000; Stephens et al. 2004), Aegilops tauschii (Boyko et al. 2002), and maize (Tenaillon et al. 2002; Koumbaris and Bass 2003; Anderson et al. 2004). In this context it can be hypothesized that this difference in recombination rate along chromosomes is due to the difference in chromosomal location of low copy and repetitive sequences. With respect to this hypothesis, it was observed in cereals that gene density tends to be higher in more distal parts of chromosome arms (Gill et al. 1996a,b; Schmidt and Heslop-Harrison 1998; Künzel et al. 2000). Also it was found that recombination events often occur in gene-rich areas (Dooner 1986; Gill et al. 1996a,b; Dooner and Martinez-Ferez 1997; Fu et al. 2001, 2002). Furthermore, for species with proximal chiasma localization it has been suggested that recombination gradients are oriented in the direction opposite those of wheat (Akhunov et al. 2003). It is known that in A. fistulosum chiasmata are strictly localized adjacent to the centromere (Levan 1933). Therefore the high level of recombination observed in the proximal half of the Allium chromosomes studied suggests a high density of genes in this area. Also our results on the physical distribution of PstI/MseI markers, which are derived predominantly from hypomethylated genic areas (Burr et al. 1988; Michalek et al. 1999), point in this direction.
Another explanation of recombination rate variation along Allium chromosomes may be the presence of sequence heterologies in the distal parts of A. roylei and A. fistulosum chromosomes. Sequence heterologies can significantly reduce recombination rate as was shown in yeast (Chen and Jinks-Robertson 1999), fungi (Colot et al. 1996), maize (Dooner and Martinez-Ferez 1997), and mice (Shao et al. 2001). While Alliums share a similar 375-bp subtelomeric satellite sequence (Pich et al. 1996; Stevenson et al. 1999), there is evidence that A. fistulosum possesses a large species-specific repetitive sequence next to the 375-bp sequence in the subtelomeric regions (Hizume 1994; Khrustaleva and Kik 1998). The low degree of sequence identity between the two parental homeologs (A. fistulosum and A. roylei) may determine the significant reduction of recombination in the distal chromosomal regions. In this respect, the isolation of A. fistulosum-specific subtelomeric repeats and comparative analysis of genomic sequences in both Allium species will provide us with a clearer understanding of this phenomenon.
Physical distribution of AFLP markers:
The position of AFLP markers along a chromosome reflects the position of restriction sites (and/or selected bases of primer) of the enzymes used in their production. In our research two types of markers, namely EcoRI/MseI and PstI/MseI, were used. PstI (restriction site 5′-CTGCA^G-3′) is a methylation-sensitive enzyme, and on the basis of the observation that expressed genes are typically hypomethylated, one assumption is that PstI/MseI markers are predominantly located in gene-rich areas, as has been experimentally confirmed by Burr et al. (1988) on maize and by Michalek et al. (1999) on barley. EcoRI (restriction site 5′-GAATT^C-3′) is a methylation-nonsensitive enzyme. Therefore, EcoRI/MseI markers may originate equally from both hypomethylated genic areas and hypermethylated repetitive DNA areas. An important result of our research is that, on average, 57.9% (chromosome 5, 63.4%; chromosome 8, 52.3%) of the PstI/MseI markers are proximally located on Allium chromosomes. This leads to the prediction that nonmethylated genic areas can be found in Alliums in more proximal regions of the chromosome. This contrasts with the results obtained from physical RFLP mapping in wheat (Gill et al. 1996a,b) and barley (Künzel et al. 2000; Stephens et al. 2004) because in these studies most RLFP markers mapped on the distal 20–30% of the chromosome arms. Significant differences in the distribution of PstI/MseI and EcoRI/MseI AFLP markers were observed for the short arm of chromosome 5. The number of EcoRI/MseI markers considerably exceeded the number of PstI/MseI markers in the distal subregion, where recombination events were reduced and highly methylated DNA sequences are known to be present (Castiglione et al. 1995). In the same study the proximal region of A. cepa chromosome 5 was not detectably methylated, which could explain the presence of a high number of PstI/MseI markers in this area. Also the highest recombination frequency on the short arm of chromosome 5 was observed in this subregion. Such a correlation between DNA methylation level and distribution of recombination was also reported by Sandhu et al. (2001), Yao et al. (2002), and Fu et al. (2002).
Unexpected was our observation that PstI/MseI markers are present in the centromeric subregion of chromosome 8; PstI/MseI markers from both A. roylei and A. fistulosum were observed in the centromeric subregion. In contrast, PstI/MseI markers were not found in the centromeric subregion of chromosome 5, which is in line with data reported for wheat (Gill et al. 1996a,b) and barley (Künzel et al. 2000). This suggests that hypomethylated sequences, potentially genes, are present in close proximity to the centromere of chromosome 8. In Arabidopsis a number of genes have been identified within genetically defined centromeres that are expressed at measurable levels (Copenhaver et al. 1999). In maize, the integration of a physical map based on BAC contigs and a genetic map showed the presence of genes in centromeric regions (Cone et al. 2002). In the grass species F. pratensis, King et al. (2002) also reported that cDNA RFLP probes were located in very close proximity to the centromere. In our case, the exact position of PstI/MseI markers relative to the centromere is unclear, because the centromeric subregion is large, comprising 27.4 pu of the chromosome. Therefore, an alternative explanation is that an Allium trihybrid genotype, which has a recombination site in the 24.3–26.8 cM area of A. roylei and the 28.7–31.7 cM area of A. fistulosum, was not obtained by chance. If such a recombination site had been present, then the six PstI/MseI markers mapped on the centromeric region would map on a new smaller subregion next to the PstI/MseI marker-rich subregion (57.4–60.4 pu) on the long arm, resulting in a similar result to that for chromosome 5 where no PstI/MseI markers were present in the centromeric subregion.
Suppression of recombination in centromeric regions:
Suppression of recombination in centromeric regions has been reported for many higher plants, for example, in wheat (Gill et al. 1996a,b; Akhunov et al. 2003), barley (Künzel et al. 2000), tomato and potato (Tanksley et al. 1992), rye (Lukaszewski 1992; Alonso-Blanco et al. 1993), rice (Cheng et al. 2001; Chen et al. 2002; Wu et al. 2003), and maize (Tenaillon et al. 2002; Anderson et al. 2004). We found that centromeric regions in Alliums behave similarly. Recombination frequencies in the centromeric regions of the Allium chromosomes analyzed were reduced 6.4 times (chromosome 5) and 4.3 times (chromosome 8) compared to the average recombination frequency of each chromosome. However, the degree of suppression in Alliums (24.6–27.4%) differed from smaller genome plants like Arabidopsis (6.5% of NOR-bearing chromosome 4; Schmidt et al. 1995; Fransz et al. 2000) or rice (4%; Cheng et al. 2001) and was more similar to that observed in other large-genome species such as wheat (20%; Gill et al. 1996a,b) and barley (50%; Künzel et al. 2000).
Relationship between genetic and physical distance:
A number of studies showed variation in the base-pair-to-centimorgan ratio in regions with high- and low-recombination frequency; for instance, in wheat the variation is 118 kb/cM and 22 Mb/cM (Gill et al. 1996a,b); in barley, it is 0.1 Mb/cM and >4 Mb/cM (Künzel et al. 2000); in maize it is 14 kb/cM and >2 Mb/cM (Dooner 1986; Brown and Sundaresan 1991), respectively. For Alliums, the base-pair/centimorgan estimates were 1.4 Mb/cM in the hotspot recombination region and 74.3 Mb/cM in the region of low recombination. Most probably the extreme ratio of base pairs to centimorgans in low-recombination regions correlates with the high condensation of Allium chromosomes (Khrustaleva and Kik 2001).
Integrated mapping on large-genome species showed that hotspots of recombination are restricted to relatively small regions; for instance, in wheat the regions with a high level of recombination span only 5–10% of the chromosome lengths and comprise 85% of the markers (Gill et al. 1996a,b). In barley these regions correspond to only 4.9% of the total genome and comprise 47.3% of markers (Künzel et al. 2000). Our results are in agreement with previously published work. In Alliums the recombination hotspot regions correspond to 5.4% of the chromosome length and contain 22.0% of the markers on chromosome 5 and 2.6% and 14.3% on chromosome 8, respectively.
An interesting result of our study is the pronounced difference between genetic and physical maps of the short and long arm of chromosome 8. In this context, Cheng et al. (2001) found on chromosome 10 of rice a difference in recombination rate between the short arm (15.4 cM/20.7 pu) and the long arm (67.8 cM/59.5 pu). They suggest that the difference in the amount of heterochromatin between the short and long arm explains this phenomenon. In F. pratensis, King et al. (2002) also found a difference in genetic length between physically similar arms of the NOR chromosome: non-NOR arm (60 cM) and NOR arm (20.9 cM). A genome-wide analysis of recombination in meiotic tetrads from Arabidopsis showed that recombination levels on individual chromosomes may be mediated by both chromosome size and content (Copenhaver et al. 1998). The organization of DNA sequences in chromatin structure may influence recombination rate and consequently genetic length, as was shown in a number of experiments in Saccharomyces (Zhu et al. 1999; Peciña et al. 2002). Our hypothesis is that the high methylation level on the short arm of Allium chromosome 8 (Castiglione et al. 1995) contributes to the reduced length of the recombination map.
In conclusion, our research on Allium has shown that recombination distribution along chromosomes differs in a number of ways from other large-genome monocots. The different chromosome organization in Allium, as has also been observed by Kuhl et al. (2004), points in the direction of the complexity of plant evolution.
Acknowledgments
Special thanks go to our colleagues Roeland Voorrips for making available an EXCEL program for calculating the expansion factor, Hans Jansen for pointing us to the use of the Fisher exact probability test, and Karin Burger-Meijer for technical assistance in maintaining the plant material. Paulo de Melo thanks Brazilian Agricultural Research Cooperation-National Center for Vegetable Crops Research, Brazilia, Brazil, for financial support.
References
- Akhunov, E. D., A. W. Goodyear, S. Geng, L.-L. Qi, B. Echalier et al., 2003. The organization and rate of evolution of wheat genomes are correlated with recombination rates along chromosome arms. Genome Res. 13: 753–763. [DOI] [PMC free article] [PubMed] [Google Scholar]
- Alonso-Blanco, C., P. G. Goicoechea, A. Roca and R. Giraldez, 1993. A cytogenetic map on the entire length of rye chromosome 1R, including one translocation breakpoint, three isozyme loci and four C-bands. Theor. Appl. Genet. 85: 735–744. [DOI] [PubMed] [Google Scholar]
- Anderson, L. K., N. Salameh, H. W. Bass, L. C. Harper, W. Z. Cande et al., 2004. Integrating genetic linkage maps with pachytene chromosome structure in maize. Genetics 166: 1923–1933. [DOI] [PMC free article] [PubMed] [Google Scholar]
- Bennett, M. D., and I. J. Leitch, 1995. Nuclear DNA amounts in angiosperms. Ann. Bot. 76: 113–176. [Google Scholar]
- Boyko, E., R. Kalendar, V. Korzun, J. Fellers, A. Korol et al., 2002. A high-density cytogenetic map of the Aegilops tauschii genome incorporating retrotransposons and defense-related genes: insights into cereal chromosome structure and function. Plant Mol. Biol. 48: 767–790. [DOI] [PubMed] [Google Scholar]
- Brown, J., and V. Sundaresan, 1991. A recombination hotspot in the maize A1 intragenic region. Theor. Appl. Genet. 81: 185–188. [DOI] [PubMed] [Google Scholar]
- Burr, B., F. A. Burr, K. H. Thompson, M. C. Albertson and C. W. Stuber, 1988. Gene mapping with recombinant inbreds in maize. Genetics 118: 519–526. [DOI] [PMC free article] [PubMed] [Google Scholar]
- Castiglione, M. R., E. Giraldi and M. Frediani, 1995. The DNA methylation pattern of Allium cepa metaphase chromosomes. Biol. Zent. Bl. 114: 57–65. [Google Scholar]
- Chen, M., G. Presting, W. B. Barbazuk, J. L. Goicoechea, B. Blackmon et al., 2002. An integrated physical and genetics map of the rice genome. Plant Cell 14: 537–545. [DOI] [PMC free article] [PubMed] [Google Scholar]
- Chen, W., and S. Jinks-Robertson, 1999. The role of the mismatch repair machinery in regulating mitotic and meiotic recombination between divergent sequences in yeast. Genetics 151: 1299–1313. [DOI] [PMC free article] [PubMed] [Google Scholar]
- Cheng, Z., G. G. Presting, C. R. Buell, R. A. Wing and J. Jiang, 2001. High-resolution pachytene chromosome mapping of bacterial artificial chromosomes anchored by genetic markers reveals the centromere location and the distribution of genetic recombination along chromosome 10 of rice. Genetics 157: 1749–1757. [DOI] [PMC free article] [PubMed] [Google Scholar]
- Civardi, L., Y. Xia, K. J. Edwards, P. S. Schnable and B. J. Nikolau, 1994. The relationship between genetic and physical distances in the cloned a1-sh2 interval of the Zea mays L. genome. Proc. Natl. Acad. Sci. USA 91: 8268–8272. [DOI] [PMC free article] [PubMed] [Google Scholar]
- Colot, V., L. Maloisel and J.-L. Rossignol, 1996. Interchromosomal transfer of epigenetic states in ascobolus: transfer of DNA methylation is mechanistically related to homologous recombination. Cell 86: 855–864. [DOI] [PubMed] [Google Scholar]
- Cone, K. C., M. D. McMullen, I. V. Bi, G. L. Davis, Y.-S. Yim et al., 2002. Genetic, physical, and informatics resources for maize. On the road to an integrated map. Plant Physiol. 130: 1598–1605. [DOI] [PMC free article] [PubMed] [Google Scholar]
- Copenhaver, G. P., W. E. Browne and D. Preuss, 1998. Assaying genome-wide recombination and centromere functions with Arabidopsis tetrads. Proc. Natl. Acad. Sci. USA 95: 247–252. [DOI] [PMC free article] [PubMed] [Google Scholar]
- Copenhaver, G. P., K. Nickel, T. Kuromori, M.-I. Benito, S. Kaul et al., 1999. Genetic definition and sequence analysis of Arabidopsis centromeres. Science 286: 2468–2474. [DOI] [PubMed] [Google Scholar]
- De Melo, P. E., 2003 The root systems of onion and Allium fistulosum in the context of organic farming: a breeding approach. Ph.D. Thesis, Wageningen University and Research Center, Wageningen, The Netherlands.
- De Vries, J. N., 1990. Onion chromosome nomenclature and homoeology relationships—workshop report. Euphytica 49: 1–3. [Google Scholar]
- Dooner, H. K., 1986. Genetic fine structure of the bronze locus in maize. Genetics 113: 1021–1036. [DOI] [PMC free article] [PubMed] [Google Scholar]
- Dooner, H. K., and I. M. Martinez-Ferez, 1997. Recombination occurs uniformly within the bronze gene, a meiotic recombination hotspot in the maize genome. Plant Cell 9: 1633–1646. [DOI] [PMC free article] [PubMed] [Google Scholar]
- Fang, Z., K. Cone, H. Sanchez-Villeda, M. Polacco, M. McMullen et al., 2003. iMap: a database-driven utility to integrate and access the genetic and physical maps of maize. Bioinformatics 19: 2105–2111. [DOI] [PubMed] [Google Scholar]
- Fransz, P. F., S. Armstrong, J. H. De Jong, L. D. Parnell, C. Van Drunen et al., 2000. Integrated cytogenetic map of chromosome arm 4S of A. thaliana: structural organization of heterochromatic knob and centromere region. Cell 100: 367–376. [DOI] [PubMed] [Google Scholar]
- Fu, H., W. Park, X. Yan, Z. Zheng, B. Shen et al., 2001. The highly recombinogenic bz locus lies in an unusually gene-rich region of the maize genome. Proc. Natl. Acad. Sci. USA 98: 8903–8908. [DOI] [PMC free article] [PubMed] [Google Scholar]
- Fu, H., Z. Zheng and H. K. Dooner, 2002. Recombination rates between adjacent genic and retrotransposon regions in maize vary by 2 orders of magnitude. Proc. Natl. Acad. Sci. USA 99: 1082–1087. [DOI] [PMC free article] [PubMed] [Google Scholar]
- Gill, K. S., B. S. Gill, T. R. Endo and E. V. Boyko, 1996. a Identification and high-density mapping of gene-rich regions in chromosome group 5 of wheat. Genetics 143: 1001–1012. [DOI] [PMC free article] [PubMed] [Google Scholar]
- Gill, K. S., B. S. Gill, T. R. Endo and T. Taylor, 1996. b Identification and high-density mapping of gene-rich regions in chromosome group 1 of wheat. Genetics 144: 1883–1891. [DOI] [PMC free article] [PubMed] [Google Scholar]
- Hizume, M., 1994. Allodiploid nature of Allium wakegi Araki revealed by genomic in situ hybridization and localization of 5S and 45S rDNAs. Jpn. J. Genet. 69: 407–415. [DOI] [PubMed] [Google Scholar]
- Huang, X., F. J. Zeller, S. L. K. Hsam, G. Wenzel and V. Mohler, 2000. Chromosomal location of AFLP markers in common wheat utilizing nulli-tetrasomics. Genome 43: 298–305. [PubMed] [Google Scholar]
- Kalkman, E. R., 1984. Analysis of the C-banded karyotype of Allium cepa L. Standard system of nomenclature and polymorphism. Genetica 65: 141–148. [Google Scholar]
- Khrustaleva, L. I., and C. Kik, 1998. Cytogenetical studies in the bridge cross Allium cepa × (A. fistulosum × A. roylei). Theor. Appl. Genet. 96: 8–14. [Google Scholar]
- Khrustaleva, L. I., and C. Kik, 2000. Introgression of Allium fistulosum into A. cepa mediated by A. roylei. Theor. Appl. Genet. 100: 17–26. [Google Scholar]
- Khrustaleva, L. I., and C. Kik, 2001. Localization of single-copy T-DNA insertion in transgenic shallots (Allium cepa) by using ultra-sensitive FISH with tyramide signal amplification. Plant J. 25: 699–707. [DOI] [PubMed] [Google Scholar]
- King, J., I. P. Armstead, I. S. Donnison, H. M. Thomas, R. N. Jones et al., 2002. Physical and genetic mapping in the grasses Lolium perenne and Festuca pratensis. Genetics 161: 315–324. [DOI] [PMC free article] [PubMed] [Google Scholar]
- Koumbaris, G., and H. W. Bass, 2003. A new single-locus cytogenetic mapping system for maize (Zea mays L): overcoming FISH detection limits with marker-selected sorghum (S. propinquum L.) BAC clones. Plant J. 35: 647–659. [DOI] [PubMed] [Google Scholar]
- Kuhl, J. C., F. Cheung, Q. Yuan, W. Martin, Y. Zewdie et al., 2004. A unique set of 11,008 onion expressed sequence Tags reveals expressed sequence and genomic differences between the monocot orders Asparagales and Poales. Plant Cell 16: 114–125. [DOI] [PMC free article] [PubMed] [Google Scholar]
- Kulikova, O., G. Gualtieri, R. Geurts, D.-J. Kim, D. Cook et al., 2001. Integration of the FISH pachytene and genetic maps of Medicago truncatula. Plant J. 27: 49–58. [DOI] [PubMed] [Google Scholar]
- Künzel, G., L. Korzun and A. Meister, 2000. Cytologically integrated physical restriction fragment length polymorphism maps for the barley genome based on translocation breakpoints. Genetics 154: 397–412. [DOI] [PMC free article] [PubMed] [Google Scholar]
- Levan, A., 1933. Cytological studies in Allium IV. Allium fistulosum. Sven. Bot. Tidskr. 27: 211–232. [Google Scholar]
- Lukaszewski, A. J., 1992. A comparison of physical distribution of recombination in chromosome 1R in diploid rye and in hexaploid triticale. Theor. Appl. Genet. 83: 1048–1053. [DOI] [PubMed] [Google Scholar]
- Michalek, W., G. Künzel and A. Graner, 1999. Sequence analysis and gene identification in a set of mapped RFLP markers in barley (Hordeum vulgare). Genome 42: 849–853. [DOI] [PubMed] [Google Scholar]
- Peciña, A., K. N. Smith, C. Mezard, H. Murakami, K. Ohta et al., 2002. Targeted stimulation of meiotic recombination. Cell 111: 173–184. [DOI] [PubMed] [Google Scholar]
- Pedersen, C., H. Giese and I. Linde-Laursen, 1995. Towards an integration of the physical and the genetic chromosome maps of barley by in situ hybridization. Hereditas 123: 77–88. [Google Scholar]
- Peters, J. L., H. Constandt, P. Neyt, G. Cnops, J. Zethof et al., 2001. A physical amplified fragment-length polymorphism map of Arabidopsis. Plant Physiol. 127: 1579–1589. [PMC free article] [PubMed] [Google Scholar]
- Pich, U., R. Fritsch and I. Schubert, 1996. Closely related Allium species (Alliaceae) share a very similar satellite sequence. Plant Syst. Evol. 202: 255–264. [Google Scholar]
- Reamon-Büttner, S. M., T. Schmidt and C. Jung, 1999. AFLPs represent highly repetitive sequences in Asparagus officinalis L. Chromosome Res. 7: 297–304. [DOI] [PubMed] [Google Scholar]
- Sandhu, D., and K. S. Gill, 2002. Structural and functional organization of the ‘1S0.8 gene-rich region’ in the Triticeae. Plant Mol. Biol. 48: 791–804. [DOI] [PubMed] [Google Scholar]
- Sandhu, D., J. A. Champoux, S. N. Bondareva and K. S. Gill, 2001. Identification and physical location of useful genes and markers to a major gene-rich region on wheat group 1S chromosomes. Genetics 157: 1735–1747. [DOI] [PMC free article] [PubMed] [Google Scholar]
- Shao, C., P. J. Stambrook and J. A. Tischfield, 2001. Mitotic recombination is suppressed by chromosomal divergence in hybrids of distantly related mouse strains. Nat. Genet. 28: 169–172. [DOI] [PubMed] [Google Scholar]
- Schmidt, R., J. West, K. Love, Z. Lenehan, C. Lister et al., 1995. Physical map and organization of Arabidopsis thaliana chromosome 4. Science 270: 480–483. [DOI] [PubMed] [Google Scholar]
- Schmidt, T., and J. S. Heslop-Harrison, 1998. Genome, genes and junk: the large-scale organization of plant chromosomes. Trends Plant Sci. 3: 195–199. [Google Scholar]
- Stephens, J. L., S. E. Brown, N. L. V. Lapitan and D. L. Knudson, 2004. Physical mapping of barley genes using an ultrasensitive fluorescence in situ hybridization technique. Genome 47: 179–189. [DOI] [PubMed] [Google Scholar]
- Stevenson, M., S. J. Armstrong, G. H. Jones and B. V. Ford-Lloyd, 1999. Distribution of a 375 bp repeat sequence in Allium (Alliaceae) as revealed by FISH. Plant Syst. Evol. 217: 31–42. [Google Scholar]
- Tanksley, S. D., M. W. Ganal, J. P. Prince, M. C. De Vicente, M. W. Bonierbale et al., 1992. High density molecular linkage maps of the tomato and potato genomes. Genetics 132: 1141–1160. [DOI] [PMC free article] [PubMed] [Google Scholar]
- Tenaillon, M. I., M. C. Sawkins, L. K. Anderson, S. M. Stack, J. Doebley et al., 2002. Patterns of diversity and recombination along chromosome 1 of maize (Zea mays ssp. mays L.). Genetics 162: 1401–1413. [DOI] [PMC free article] [PubMed] [Google Scholar]
- van Heusden, A. W., M. Shigyo, Y. Tashiro, R. Vrielink-Van Ginkel and C. Kik, 2000. AFLP linkage group assignment to the chromosomes of Allium cepa L. via monosomic addition lines. Theor. Appl. Genet. 100: 480–486. [Google Scholar]
- van Raamsdonk, L. W. D., W. Ensink, A. W. van Heusden, M. Vrielink-van Ginkel and C. Kik, 2003. Biodiversity assessment based on cpDNA and crossability analysis in selected species of Allium subgenus Rhizirideum. Theor. Appl. Genet. 107: 1048–1058. [DOI] [PubMed] [Google Scholar]
- Voorrips, R. E., 2002. MapChart: software for the graphical presentation of linkage maps and QTLs. J. Hered. 93: 77–78. [DOI] [PubMed] [Google Scholar]
- Wu, J., H. Mizuno, M. Hayashi-Tsugane, Y. Ito, Y. Chiden et al., 2003. Physical maps and recombination frequency of six rice chromosomes. Plant J. 36: 720–730. [DOI] [PubMed] [Google Scholar]
- Yao, H., Q. Zhou, J. Li, H. Smith, M. Yandeau et al., 2002. Molecular characterization of meiotic recombination across the 140-kb multigenic a1-sh2 interval of maize. Proc. Natl. Acad. Sci. USA 99: 6157–6162. [DOI] [PMC free article] [PubMed] [Google Scholar]
- Zhu, Y., S. Zou, D. A. Wright and D. F. Voytas, 1999. Tagging chromatin with retrotransposons: target specificity of the Saccharomyces Ty5 retratronsposon changes with the chromosomal localization of Sir3p and Sir4p. Genes Dev. 13: 2738–2749. [DOI] [PMC free article] [PubMed] [Google Scholar]