Abstract
Mutation is the ultimate source of genetic variation, and mutation rate is thus an important parameter governing the extent of genetic variation. Microsatellites are highly informative genetic markers that have been widely used in genetic studies. While previous studies showed that the mutation rate differs in di-, tri-, and tetranucleotide repeats, how mutation rate distributes within each class of repeat is poorly understood. This study first revealed the pattern of the mutation rate variation within the dinucleotide repeats. Two data sets were used. The first is the allele frequency data from 115 microsatellites with dinucleotide repeats distributed along the human genome in 10 worldwide populations. The second data set is much larger, consisting of the allele frequency of 5252 dinucleotide repeats from the Genome Database. Mutation rate for each locus is estimated through a new homozygosity-based estimator, which has been shown to be unbiased and highly efficient and is reasonably robust against deviations from the single-step model. The mutation rates among loci can be approximated well by a gamma distribution and its shape parameter can be accurately estimated with this approach. This result provides the basic guidelines for analyzing the large-scale genomic data from microsatellite loci.
WITH the progress of genomic research, large genetic variation data at microsatellite loci have been generated. Because of their high polymorphism, there is a growing interest in utilizing microsatellites to make inferences in human genetic studies, ranging from population genetic study, to forensic analysis, to genetic markers for gene hunting. One common feature of the genetic studies using microsatellites is that multiple loci are generally employed because a single locus does not provide sufficient resolution. Mutation rate (μ) per locus per generation is an important parameter for such studies, and its value varies considerably from locus to locus (Di Rienzo et al. 1998; Zhivotovsky 2001). It is without doubt that ignoring rate variation among loci is inappropriate and can lead to misleading inferences. Therefore the knowledge on the pattern of rate variation of microsatellite loci in the human genome is not only of interest in understanding our genome but also highly relevant to better inferences utilizing microsatellite loci. To date, rate variation among microsatellites is poorly understood.
The prerequisite of characterizing the variation of mutation rate among loci is the proper estimation of the rate at each locus. The mutation rate of a microsatellite locus can be estimated from direct observation of mutational events. The observation can come either from the genotype data of a large number of pedigrees or from typing a large number of sperms (Weber and Wong 1993; Holtkemper et al. 2001). This approach is quite costly in practice because mutation rates at most microsatellite loci are not sufficiently large to be accurately measured with reasonable sample size and it is practically impossible to carry out such estimations for every locus, even though their mutation rates are several orders of magnitude higher than those at the DNA nucleotide sites. Furthermore, the estimates of mutation rates with direct methods can often be obscured by incorrect assumptions regarding the biological relationships of the observed pedigree. Nonetheless, the average of the observed number of mutations over several loci, scored with a large enough number of meiosis events, can provide reasonable estimates of the average mutation rate of a group of microsatellite loci (e.g., Weber and Wong 1993). Recently large quantities of microsatellite genotype data on human pedigrees have been collected during the studies of human disease. Several studies have utilized the data to estimate the mutation rate at microsatellite loci (Xu et al. 2000; Huang et al. 2002). For the purpose of understanding rate variation, there can be potential bias in directly counting mutation events because the loci in such studies are selected first to be highly polymorphic and second to be easy to genotype. Therefore, these loci may not be representative of the overall genomic coverage of all microsatellites. Because of the limitations, it is impractical to study the mutation rate variation at the genome level using the direct approach.
Alternatively, the mutation rate can be estimated using population genetic methods that utilize allelic frequency in population samples since more and more genetic variation data at microsatellite loci are available. In such analyses, it is commonly assumed that the population has reached a mutation-drift equilibrium so that the allele frequency distribution can be expressed in terms of the composite population parameter θ = 4Nμ, where N is the effective population size and μ is the mutation rate per locus per generation. For most human populations, this is a reasonable assumption. Using this approach, Chakraborty et al. (1997) showed that the mutation rates of di-, tri-, and tetranucleotide loci are inversely proportional to their motif sizes. They arrived at this conclusion on the basis of the average mutation rate in each category of microsatellite loci. It is also shown in their analysis that a considerable amount of variation of mutation rate exists within each group of microsatellite loci with the same motif. With the availability of more and more genetic variation data at microsatellite loci distributed across the human genome, it is now increasingly feasible to study mutation rate and its variation at human microsatellite loci.
For the DNA nucleotide sequence data, variation in substitution rates has been observed for a long time. Several substitution models have been proposed to fit the distribution of the substitution rates (e.g., Jukes and Cantor 1969; Felsenstein 1981). Among them, gamma-distributed rates (Nei et al. 1976; Gu et al. 1995; Yang and Kumar 1996; Tourasse and Gouy 1997) and the site-specific rates (Swofford et al. 1996) are the most popular ones. It is of interest to see whether the mutation models will fit the mutation rate distribution for the microsatellite loci in human. Interestingly, Goldstein et al. (1996) found that ln(V), where V is the population variance in repeat numbers, follows approximately a normal distribution, for a single locus, but their result has no bearing for the distribution of mutation rate over loci.
Since our approach is based on the estimate of θ, we need to start with an efficient estimator of θ to get as accurate as possible an inference of the variation pattern of the underlying mutation rate at dinucleotide microsatellite loci. Otherwise, the random error in the estimates could easily dominate the variation of the estimates and blur the true variation pattern. Recently, we developed an estimator of θ based on genetic variation data at microsatellite loci (Xu and Fu 2004). The estimator is unbiased under the single-step stepwise mutation model and is robust against other forms of stepwise mutation models. It also has the advantage of being simple to compute and performs better than several existing estimators, including the maximum-likelihood-based estimator. Therefore it is ideal for the analysis of large genomic data. Taking advantage of this new development, we carried out an analysis of mutation rate variation at dinucleotide microsatellite loci using data from two sources. One is the genetic variation data from the ALFRED database. Another is a much more comprehensive data set of dinucleotide microsatellites from the Genome Database. This article presents the analysis results and discusses their implications.
MATERIALS AND METHODS
Data set I:
Allele frequency data at 115 dinucleotide microsatellites are obtained from the database ALFRED at Yale University maintained by Dr. K. K. Kidd. The markers cover chromosomes 2–11. All data are downloaded from ALFRED at http://alfred.med.yale.edu/alfred/index.asp. Part of the loci are from the ABI linkage panels 8–11 and 13–16. The distribution of the loci on each chromosome is shown in Table 1.
TABLE 1.
The distribution of ALFRED markers on each chromosome
| Chromosome | No. loci |
|---|---|
| 2 | 1 |
| 3 | 12 |
| 5 | 21 |
| 6 | 18 |
| 7 | 9 |
| 8 | 5 |
| 9 | 13 |
| 10 | 18 |
| 11 | 18 |
The markers selected are all dinucleotide (CA) repeats. These markers are intentionally selected to be distant from any known locus under selection. More information about these markers can be found at the web site previously mentioned.
Microsatellite data from 10 different worldwide populations were analyzed. African populations were represented by Biaka Pygmies from the Central African Republic and the Mbuti Pygmies from northwestern Zaire. Non-African populations included a sample of unrelated Danish blood donors, a Muslim community from northern Israel, Han Chinese living in the United States, native Japanese from the Osaka area or visitors to Stanford or Yale, the Yakut from Siberia, the Nasioi from Melanesia, the Mayan from Mexico, and the Rondonian Surui from Brazil. The last four populations are representations of small isolated populations. More information about these populations is available at http://info.med.yale.edu/genetics/kkidd/pops.html.
Data set II:
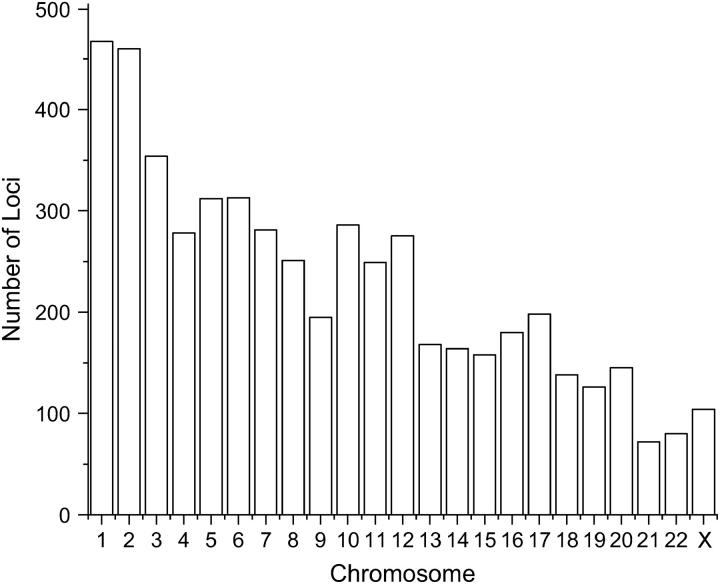
Allele frequency data were collected from the most recent version of the online Genome Database (http://www.gdb.org). The data consist of 5254 dinucleotide repeats that cover 22 autosomal chromosomes and the X chromosome. The distribution of the number of loci on each chromosome is shown in Figure 1. The allele frequencies available for these loci are mainly for the CEPH-Caucasian population. The sample size is at least 40 for the majority of the loci.
Figure 1.—
Distribution of the number of dinucleotide repeat loci from the GDB on each chromosome.
θ estimation:
The parameter θ = 4Nμ, where N is the effective population size and μ is the mutation rate per locus per generation, is critical in analyzing genetic variations because many statistical properties of measures of genetic variation are dependent on the parameter. Since it is the product of population size and mutation rate, it is also known as the population mutation rate. Recently we developed a new estimator of θ for microsatellite loci based on sample homozygosity. It is approximately unbiased assuming the single-step stepwise mutation model and has a much smaller variance than the size-variance-based estimator. The sample homozygosity is computed as
 |
1 |
where n is the sample size, k is the number of alleles in the sample, and pi is the allele frequency for the ith allele in the sample. A biased estimator θ̃F is given by
 |
2 |
Then an unbiased estimate of θ is obtained through solving the corresponding equation for θ depending on the biased θ-estimator θ̃F. For θ̃F ≤ 15.0,
 |
3 |
For θ̃F > 15.0,
 |
4 |
At the point of 15.0, the two equations converge. Therefore, estimates given by the two equations converge when the θ̃F is about 15.0. The composite parameter θ was estimated for each locus in every possible population where allele frequency data are available in both data sets.
Relative mutation rate:
The ratio of θj, the estimate of θ for the jth locus, and θi, the estimate for the ith locus in the same population, was taken. Assuming the effective population size N is the same for different loci from the same population, we have
 |
5 |
where μi and μj are the mutation rates at the ith and jth locus, respectively, and μij is defined as the relative mutation rate of locus j over locus i. Thus the mutation rate can be estimated on a relative term through this approach. Taking a particular locus as a base locus, the relative mutation rates of all other loci were computed through this approach. For data set I, since allele frequency data across several worldwide populations were available, the relative mutation rate μij was estimated in each population and a simple arithmetic average was taken as a final estimate.
The gamma distribution has long been used to model the variation in mutation rate at the protein-enzyme loci and single-nucleotide sites (Nei et al. 1976; Gu et al. 1995; Yang and Kumar 1996; Tourasse and Gouy 1997). A random variable X following a standard gamma distribution has probability density function
 |
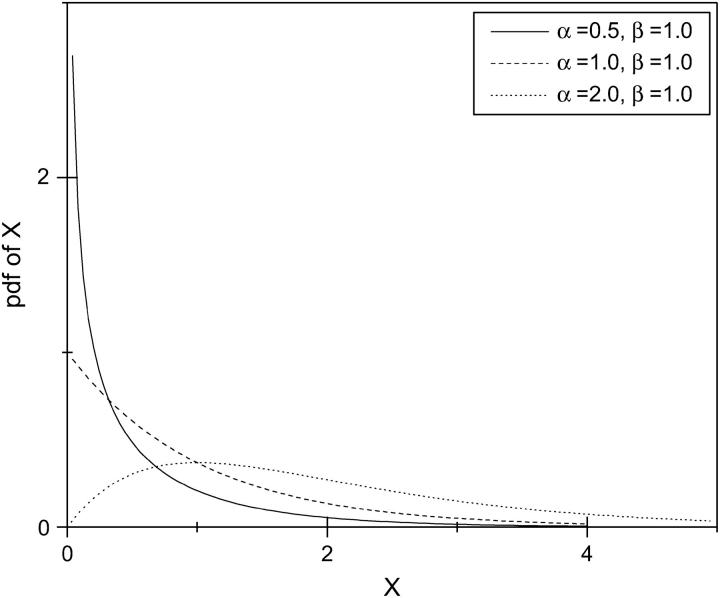
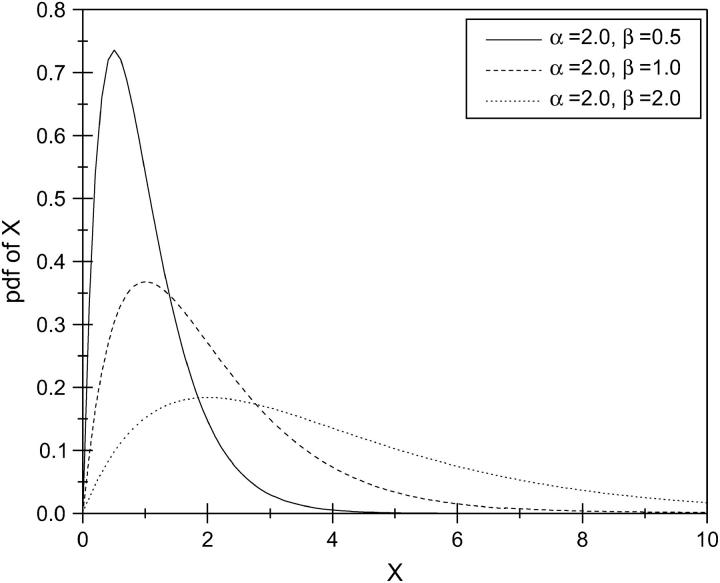
which has two parameters, α and β. The parameter α is known as the shape parameter, since it primarily influences the peakedness of the distribution, while the parameter β is called the scale parameter, since most of its influence is on the spread of the distribution. Figure 2 gives an example showing the effects of the two parameters on the probability density function. An important feature of the gamma distribution is that a scaled gamma variable also follows a gamma distribution. More specifically, let Y = aX, where a is a nonzero constant, then Y also follows a gamma distribution with parameter (α, aβ). That is, the scale transformation changes only the scale parameter β. Through the method presented in this article, the mutation rate at the dinucleotide microsatellite loci can be estimated in a relative term. It is shown that the distribution of the mutation rates can be approximated with a gamma distribution. Consequently, the shape parameter α can be reliably estimated through this method.
Figure 2.—
An example showing the effects of two parameters in a gamma distribution on the probability density function (pdf) of X. Top: the effect of the shape parameter α with a constant scale parameter β = 1.0; Bottom: the effects of the scale parameter β with a constant α = 2.0.
RESULTS
Data set I:
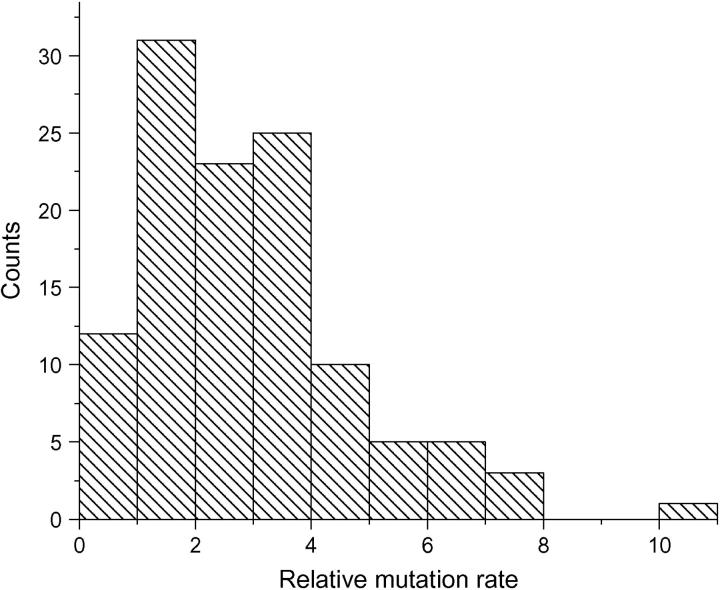
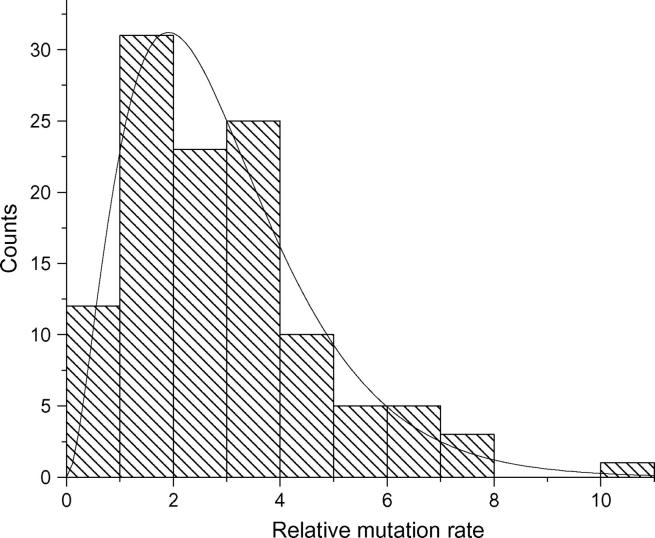
The θ estimates were obtained through our homozygosity-based estimator θ̂F using the ALFRED data. To further characterize the variation of mutation rates among loci, the relative mutation rate was computed using the ALFRED data. As an example, Figure 3 shows the distribution of the relative mutation rate over D11S1358 for the 115 loci.
Figure 3.—
Histogram of the distribution of the relative mutation rate over base locus D11S1358 in the ALFRED data. The total number of loci is 115.
It is clear that the relative mutation rates can vary up to 10-fold within the dinucleotide repeats. To explore how to model the mutation rate distribution at the genome level, several statistical distributions have been used to fit the histogram. From the shape of the histogram, a gamma distribution is an obvious choice. The gamma distribution has long been used to model the variation in mutation rate at the protein-enzyme loci and single-nucleotide sites (Nei et al. 1976; Gu et al. 1995; Yang and Kumar 1996; Tourasse and Gouy 1997). It turns out that a gamma distribution can also approximate the variation of the relative mutation rates at the microsatellite loci. The robust module in the S-Plus package was used to fit the histogram as in Figure 3 with a gamma distribution and to give an estimate of the two parameters, shape parameter α and scale parameter β, which are overlaid on the histogram representing observations based on the computations of μij. As an example, the case where the base locus is D11S1358 is shown in Figure 4 with the fitted gamma density function overlaid with the histogram.
Figure 4.—
Fitting the histogram of the relative mutation rate with a gamma distribution in the ALFRED data set. The density function is overlaid with the histogram. Base locus: D11S1358. —, overlaid density. α = 2.8384, β = 1.0361.
For each of the 115 loci, if the locus has allele frequency data in all 10 worldwide populations, it was used as the base locus to compute the relative mutation rate and further to be fitted with a gamma distribution. The estimated parameters for the gamma density function are shown in Table 3.
TABLE 3.
Estimates of gamma parameters α and β for the ALFRED data
| Base locus | α, β | Base locus | α, β | Base locus | α, β |
|---|---|---|---|---|---|
| D5S393 | 3.02, 0.37 | D6S462 | 2.45, 1.90 | D10S212 | 2.18, 3.79 |
| D5S400 | 3.26, 0.17 | D6S470 | 2.62, 0.63 | D10S217 | 2.73, 0.31 |
| D5S406 | 3.08, 0.58 | D7S484 | 2.62, 0.80 | D10S220 | 2.86, 0.39 |
| D5S407 | 3.26, 0.27 | D7S510 | 2.84, 0.93 | D10S249 | 2.89, 0.99 |
| D5S408 | 2.78, 0.63 | D7S513 | 3.15, 0.23 | D10S537 | 2.78, 0.35 |
| D5S416 | 2.20, 1.27 | D7S516 | 3.21, 0.79 | D10S547 | 1.75, 10.9 |
| D5S418 | 3.36, 0.36 | D7S517 | 3.29, 0.48 | D10S583 | 2.70, 0.39 |
| D5S419 | 3.34, 0.33 | D7S530 | 2.66, 1.11 | D10S587 | 2.90, 0.45 |
| D5S421 | 2.24, 1.56 | D7S640 | 3.46, 0.19 | D10S591 | 2.39, 1.64 |
| D5S422 | 2.88, 0.30 | D7S657 | 2.82, 0.57 | D10S597 | 2.73, 2.00 |
| D5S424 | 2.73, 1.20 | D7S669 | 2.66, 0.38 | D11S898 | 1.11, 12.6 |
| D5S426 | 3.06, 0.46 | D8S258 | 2.86, 0.79 | D11S902 | 3.19, 0.29 |
| D5S429 | 3.28, 0.32 | D8S260 | 2.91, 0.31 | D11S904 | 2.93, 0.93 |
| D5S433 | 2.66, 0.32 | D8S272 | 2.91, 0.45 | D11S905 | 2.73, 0.43 |
| D5S436 | 3.14, 0.37 | D8S504 | 2.67, 1.45 | D11S908 | 1.67, 19.9 |
| D5S471 | 3.12, 1.06 | D8S514 | 2.76, 1.10 | D11S922 | 2.72, 0.20 |
| D5S644 | 3.06, 0.25 | D9S157 | 3.19, 0.43 | D11S934 | 2.19, 1.18 |
| D5S647 | 2.96, 0.42 | D9S161 | 2.86, 1.41 | D11S935 | 3.35, 0.84 |
| D5S673 | 2.66, 0.28 | D9S164 | 2.70, 0.32 | D11S937 | 2.39, 0.27 |
| D6S257 | 3.09, 0.16 | D9S171 | 1.32, 9.26 | D11S968 | 2.41, 0.92 |
| D6S262 | 2.96, 0.41 | D9S175 | 2.33, 0.63 | D11S987 | 2.36, 0.48 |
| D6S264 | 2.36, 2.13 | D9S273 | 2.18, 0.76 | D11S1313 | 2.64, 0.94 |
| D6S271 | 2.23, 1.23 | D9S279 | 2.06, 1.91 | D11S1314 | 3.02, 0.65 |
| D6S276 | 3.06, 0.62 | D9S286 | 1.65, 2.33 | D11S1320 | 2.31, 2.90 |
| D6S281 | 3.05, 0.66 | D9S287 | 2.95, 1.26 | D11S1338 | 2.66, 1.04 |
| D6S289 | 3.17, 0.30 | D9S288 | 2.66, 0.41 | D11S1345 | 2.66, 0.75 |
| D6S292 | 3.22, 0.34 | D9S290 | 1.89, 2.70 | D11S1358 | 2.84, 1.04 |
| D6S305 | 2.86, 0.32 | D10S189 | 2.98, 2.47 | ||
| D6S308 | 2.86, 1.00 | D10S191 | 3.15, 0.32 | ||
| D6S422 | 2.86, 0.82 | D10S192 | 2.91, 0.43 | Mean: 2.73, 1.38 | |
| D6S426 | 1.82, 2.24 | D10S197 | 2.78, 0.61 | Variance: 0.21, 7.67 | |
| D6S441 | 3.09, 0.24 | D10S208 | 2.86, 0.53 | CV:a 0.17, 2.01 | |
Coefficient of variation.
As expected, estimates of the relative mutation rate and the β parameter are different, depending on the base locus used in defining the ratio. The mean, variance, and coefficient of variation of the point estimates of the gamma parameters are also given in Table 3. As shown by the coefficient of variation, the scale parameter β has a very large variance among the estimates relative to the mean value. In comparison, the coefficient of variation for the estimates of the shape parameter α is small, reflecting that α is invariant to scaling transformation. Therefore, the mean of the estimates of α is a reliable estimate.
Data set II:
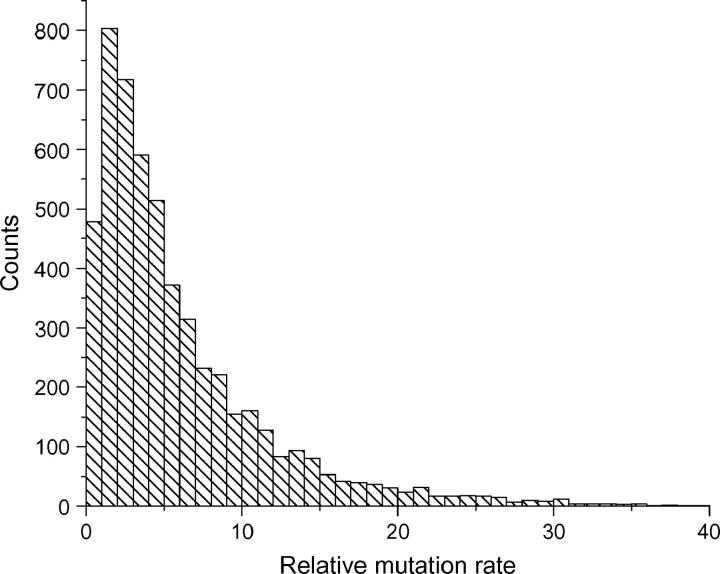
The relative mutation rate over locus D1S2701 was computed using the allele frequency data of all the loci from the Genome Database data set. In total there are 5254 dinucleotide repeats. The distribution of the relative mutation rate is shown in Figure 5. The mutation rate can vary up to 10-fold for the majority of the loci.
Figure 5.—
Histogram of the relative mutation rate over base locus D1S2701 in the GDB data. The total number of loci is 5254.
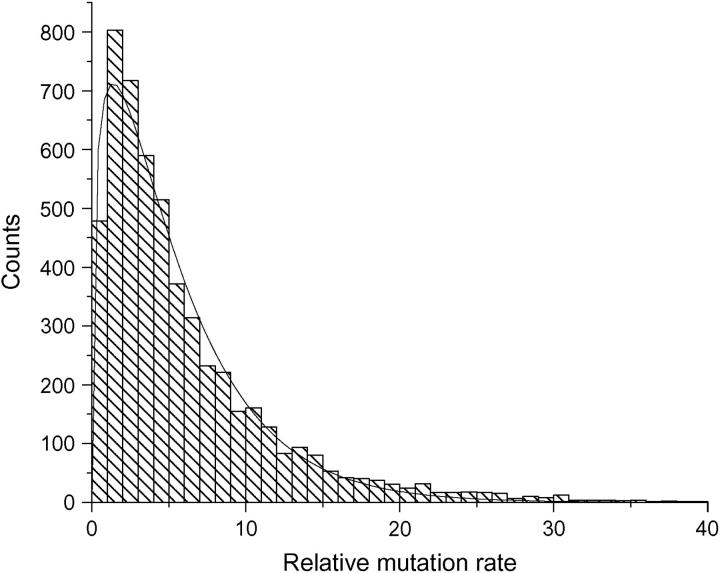
Again a gamma distribution was found to fit the histogram quite well. The estimated shape parameter is 1.3327 and the scale parameter is 4.1037. The density function is overlaid with the histogram in Figure 6.
Figure 6.—
Fitting the histogram of the relative mutation rate with a gamma distribution in the GDB data set. The density function is overlaid with the histogram. Base locus: D1S2701. —, overlaid density. α = 1.3327, β = 4.1037.
When the locus other than D1S2701 was used as the base locus to compute the relative mutation rate and the resulting histogram was fitted with a gamma distribution, the shape parameter α remains the same and the scale parameter β changes with the different base locus. This is what should be expected, since from the properties of the gamma distribution the approach taken here changes only the scale parameter β.
The above analysis is for all the loci that cover 22 autosomal chromosomes and the X chromosome. To explore whether there was any chromosome-specific effect on the distribution of the mutation rate of dinucleotide repeats, the allele frequency data were further put into 23 groups according to the chromosome location. One group corresponded to one chromosome. It was found that the relative mutation rate for dinucleotide repeats on each chromosome also follows a gamma distribution. The estimates of α and β of the gamma distribution and the respective base locus for loci on each chromosome are shown in Table 2. The α estimate from chromosome 14 is the highest while that from chromosome 20 is the lowest. However, the estimates for the shape parameter do not differ significantly from each other, suggesting the chromosome-specific effect on the mutation rate is not pronounced.
TABLE 2.
The estimates of parameters in a gamma distribution that fits the relative mutation rate on each chromosome
| No. loci | Base locus | α | β | |
|---|---|---|---|---|
| All data | 5254 | D1S2701 | 1.3327 | 4.1037 |
| Chr1 | 467 | D1S2701 | 1.3742 | 3.9994 |
| Chr2 | 460 | D2S2287 | 1.2735 | 4.6070 |
| Chr3 | 354 | D3S1615 | 1.4764 | 3.5346 |
| Chr4 | 278 | D4S1619 | 1.1656 | 4.4785 |
| Chr5 | 312 | D5S490 | 1.3125 | 4.0881 |
| Chr6 | 313 | D6S202 | 1.3502 | 4.3370 |
| Chr7 | 281 | D7S2547 | 1.5612 | 4.4785 |
| Chr8 | 251 | D8S1845 | 1.5288 | 3.1752 |
| Chr9 | 195 | D9S1839 | 1.1236 | 5.1474 |
| Chr10 | 286 | D10S588 | 1.4956 | 3.4500 |
| Chr11 | 249 | D11S4193 | 1.3850 | 3.9566 |
| Chr12 | 275 | D12S104 | 1.3107 | 4.3089 |
| Chr13 | 168 | D13S1286 | 1.4436 | 3.8512 |
| Chr14 | 164 | D14S1019 | 1.9221 | 2.8008 |
| Chr15 | 158 | D15S989 | 1.2966 | 3.8688 |
| Chr16 | 180 | D16S3085 | 1.2706 | 4.6897 |
| Chr17 | 198 | D17S935 | 1.0990 | 5.0212 |
| Chr18 | 138 | D18S1105 | 1.2972 | 4.3864 |
| Chr19 | 126 | D19S874 | 1.6937 | 3.9896 |
| Chr20 | 145 | D20S864 | 1.0231 | 5.9413 |
| Chr21 | 72 | D21S261 | 1.1654 | 4.8122 |
| Chr22 | 80 | D22S1149 | 1.4322 | 3.8956 |
| ChrX | 104 | DXS8009 | 1.3482 | 2.5931 |
Chr, chromosome.
DISCUSSION
Through estimating the population mutation rate θ for different loci and taking ratios of the estimates in the same population, the relative mutation rates of dinucleotide repeats were obtained. It was found that the distribution of the relative mutation rate μij at the genomic level can be approximated well by a gamma distribution through the analysis of two data sets. A well-known property of the gamma distribution was utilized; that is, if a random variable X follows a gamma distribution with parameter (α, β), and if another random variable Y = aX, where a is a nonzero constant number, then Y also follows a gamma distribution with parameter (α, aβ). From Equation 5, the relative mutation rate in relation to a particular base locus i is equivalent to the real mutation rate divided by μi, the mutation rate of locus i, which is a constant value across the relative values for all other loci. The real mutation rate is the relative mutation rate times the constant μi. Since the relative mutation rate follows a gamma distribution, it is clear that the real mutation rate also follows a gamma distribution with the same shape parameter α. The only difference between the two distributions is the scale parameter β, which depends on the mutation rate of the base locus. Consequently, when the base locus was changed and the two parameters were reestimated, a rather accurate estimate of α is obtained, while the estimate of β varies greatly, as Table 3 indicates. Data set I has 115 loci distributed in 9 chromosomes. These loci are part of the ABI linkage set and are not close to any known genes. Statistical tests of neutrality did not detect any signature of natural selection using the genetic variation data (Xu 2003). Therefore they are putatively free of selective constraints and can be a good representation of dinucleotide repeat microsatellites free of selection at the genomic level. Data set II is taken from the latest edition of the Genome Database (GDB) and is composed of 5254 dinucleotide repeats that cover 22 autosomal chromosomes and the X chromosome. Consequently, this data set is a good representation of dinucleotide repeat microsatellites at the genomic level. While there are many studies on the mutation rate of DNA nucleotide sequence data at the genomic level, little is known about the distribution of the mutation rate at the microsatellite loci, which represent an important fraction of the genetic variation at the genomic level. Chakraborty et al. (1997) showed that the mutation rates of di-, tri-, and tetranucleotide loci are inversely related to their motif sizes. This study further shows that within the dinucleotide group there is great variation in mutation rate and the distribution can be modeled as a gamma distribution.
The shape parameter α of the gamma distribution is estimated from the two data sets, respectively. The estimate from data set I is 2.4531 and from data set II it is 1.3327. Barring variation of the estimates, the difference is primarily due to the fact that data set I has only 115 loci from 9 chromosomes, while data set II covers all 22 autosomal chromosomes and the X chromosome, which represents the largest data sets of dinucleotide repeat microsatellite allele frequency analyzed to date. Consequently, the estimate from data set II is more appropriate. In other words, the loci in data set I likely represent a biased set of dinucleotide repeats in the human genome. To see if indeed this is the case, two subsamples were taken from data set II. First, the allele frequency data from data set II with corresponding loci from data set I were examined. Out of the 115 loci from data set I, 113 loci were found from data set II. With this data set, the same procedure of fitting with a gamma distribution was applied. The estimate of α turns out to be 2.3556, which is sufficiently close to the estimate of 2.4531 from data set I. Note that the population samples in the two data sets are quite different; the samples in data set II are Caucasian and those in data set I are from various populations. Second, since the loci in data set I are all (CA) repeats, we randomly sampled 115 (CA) repeats from data set II with loci that are not in data set I. This is done because there is direct evidence that the mutation rate at the dinucleotide repeats differs between the repeat motifs (Bachtrog et al. 2000). From this data set, the estimate of α is 1.3991, which is quite different from the estimates based on data set I and the first subsamples from data set II. These results lead to the conclusion that the loci in data set I are a biased set of (AC) repeats and the resulting estimate of α is an overestimation of the true variation. This is not surprising since the loci in data set I are used mainly for genetic mapping and were chosen generally because of their high polymorphic content.
Note that in the above analysis, a single-step stepwise mutation model is assumed. The effects of the mutation model on the estimates of the composite parameter θ and further the shape parameter α are unknown. However, the estimator θ̂F used in this study has been shown to be more robust than the allele-size variance-based estimator against deviation from the mutation model (Xu and Fu 2004). Further, if the actual mutation model deviates from the single-step stepwise mutation model, the resulting estimates for θ will be biased in one direction. Since the relative mutation rate is acquired by taking the ratio of the two estimates of θ at the two loci, the estimates of the shape parameter are expected to be relatively robust to the deviation of the mutation model. Mutation-drift equilibrium of the population is also assumed in our analysis. Similar data from the GDB were analyzed by Renwick et al. (2001). Their results suggested conformation with mutation-drift equilibrium and no statistically significant deviation from a population with constant size. Further, in the population expansion scenario, sample homozygosity approaches its equilibrium value faster than allele size variance. Therefore, it is expected that θ̂F reaches the equilibrium value faster in this scenario.
In summary, through the analysis of an extensive survey of genetic variation data at human dinucleotide repeats, the mutation rate at such loci can be approximated with a gamma distribution and the shape parameter of the distribution was obtained. The results provide guidelines for modeling the genetic variation at dinucleotide repeat loci at the genomic level. For example, estimates of the human genomic mutation rate at microsatellite loci are in the range of 10−4–10−2 (Ellegren 2000). If one takes the mean mutation rate as 10−3 at dinucleotide repeat loci, since the α value is known from our results, the other parameter β in the gamma distribution can be estimated as β = mean/α = 7.5 × 10⁻⁴. Once the two parameters are known, the gamma distribution is specified and the mutation rate at dinucleotide repeat loci can be sampled from the distribution. This is very useful, for example, for further applications such as detecting the signature of natural selection and microsatellite instability in cancer research.
Acknowledgments
This work is supported, in part, by National Institutes of Health grants GM50428 and GM60777 to Y.-X. Fu.
References
- Bachtrog, D., M. Agis, M. Imhof and C. Schlotterer, 2000. Microsatellite variability differs between dinucleotide repeat motifs—evidence from Drosophila melanogaster. Mol. Biol. Evol. 17: 1277–1285. [DOI] [PubMed] [Google Scholar]
- Chakraborty, R., M. Kimmel, D. Stivers, L. Davison and R. Deka, 1997. Relative mutation rates at di-, tri-, and tetra-nucleotide microsatellite loci. Proc. Natl. Acad. Sci. USA 94: 1041–1046. [DOI] [PMC free article] [PubMed] [Google Scholar]
- Di Rienzo, A., P. Donnelly, C. Toomajian, B. Sisk, A. Hill et al., 1998. Heterogeneity of microsatellite mutations within and between loci, and implications for human demographic histories. Genetics 148: 1269–1284. [DOI] [PMC free article] [PubMed] [Google Scholar]
- Ellegren, H., 2000. Heterogeneous mutation processes in human microsatellite DNA sequences. Nat. Genet. 24: 400–402. [DOI] [PubMed] [Google Scholar]
- Felsenstein, J., 1981. Evolutionary trees from DNA sequences: a maximum likelihood approach. J. Mol. Evol. 17: 368–376. [DOI] [PubMed] [Google Scholar]
- Goldstein, D. B., L. A. Zhivotovsky, K. Nayar, A. R. Linares, L. L. Cavalli-Sforza et al., 1996. Statistical properties of the variation at linked microsatellite loci: implications for the history of human Y chromosomes. Mol. Biol. Evol. 13: 1213–1218. [DOI] [PubMed] [Google Scholar]
- Gu, X., Y. X. Fu and W. H. Li, 1995. Maximum likelihood estimation of the heterogeneity of substitution rate among nucleotide sites. Mol. Biol. Evol. 12: 546–557. [DOI] [PubMed] [Google Scholar]
- Holtkemper, U., B. Rolf, C. Hohoff, P. Forster and B. Brinkmann, 2001. Mutation rates at two human Y-chromosomal microsatellite loci using small pool PCR techniques. Hum. Mol. Genet. 10: 629–633. [DOI] [PubMed] [Google Scholar]
- Huang, Q. Y., F. H. Xu, H. Shen, H. Y. Deng, Y. J. Liu et al., 2002. Mutation patterns at dinucleotide microsatellite loci in humans. Am. J. Hum. Genet. 70: 625–634. [DOI] [PMC free article] [PubMed] [Google Scholar]
- Jukes, T. H., and C. R. Cantor, 1969 Evolution of protein molecules, pp. 21–123 in Mammalian Protein Metabolism, edited by H. N. Munro. Academic Press, New York.
- Nei, M., R. Chakraborty and P. A. Fuerst, 1976. Infinite allele model with varying mutation rate. Proc. Natl. Acad. Sci. USA 73: 4164–4168. [DOI] [PMC free article] [PubMed] [Google Scholar]
- Renwick, A., L. Davison, H. Spratt, J. P. King and M. Kimmel, 2001. DNA dinucleotide evolution in humans: fitting theory to facts. Genetics 159: 737–747. [DOI] [PMC free article] [PubMed] [Google Scholar]
- Swofford, D. L., G. J. Olsen, P. J. Waddel and D. M. Hillis, 1996 Phylogenetic inference, pp. 407–514 in Molecular Systematics, Ed. 2, edited by D. M. Hillis, C. Motitz and B. K. Mable. Sinauer, Sunderland, MA.
- Tourasse, N., and M. Gouy, 1997. Evolutionary distances between nucleotide sequences based on the distribution of substitution rates among sites as estimated by parsimony. Mol. Biol. Evol. 14: 287–298. [DOI] [PubMed] [Google Scholar]
- Weber, J. L., and C. Wong, 1993. Mutation of human short tandem repeats. Hum. Mol. Genet. 2: 1123–1128. [DOI] [PubMed] [Google Scholar]
- Xu, H., 2003 Detecting the signature of natural selection with microsatellites. Ph.D. Thesis, University of Texas, Graduate School of Biomedical Sciences, Houston.
- Xu, H., and Y.-X. Fu, 2004. Estimating effective population size or mutation rate with microsatellites. Genetics 166: 555–563. [DOI] [PMC free article] [PubMed] [Google Scholar]
- Xu, X., M. Peng and Z. Fang, 2000. The direction of microsatellite mutations is dependent upon allele length. Nat. Genet. 24: 396–399. [DOI] [PubMed] [Google Scholar]
- Yang, Z., and S. Kumar, 1996. Approximate methods for estimating the pattern of nucleotide substitution and the variation of substitution rates among sites. Mol. Biol. Evol. 13: 650–659. [DOI] [PubMed] [Google Scholar]
- Zhivotovsky, L. A., 2001. Estimating divergence time with the use of microsatellite genetic distances: impacts of population growth and gene flow. Mol. Biol. Evol. 18: 700–709. [DOI] [PubMed] [Google Scholar]


