Abstract
MicroRNAs (miRNAs) are a class of small noncoding RNAs that have important regulatory roles in multicellular organisms. The public miRNA database contains 321 human miRNA sequences, 234 of which have been experimentally verified. To explore the possibility that additional miRNAs are present in the human genome, we have developed an experimental approach called miRNA serial analysis of gene expression (miRAGE) and used it to perform the largest experimental analysis of human miRNAs to date. Sequence analysis of 273,966 small RNA tags from human colorectal cells allowed us to identify 200 known mature miRNAs, 133 novel miRNA candidates, and 112 previously uncharacterized miRNA* forms. To aid in the evaluation of candidate miRNAs, we disrupted the Dicer locus in three human colorectal cancer cell lines and examined known and novel miRNAs in these cells. These studies suggest that the human genome contains many more miRNAs than currently identified and provide an approach for the large-scale experimental cloning of novel human miRNAs in human tissues.
Keywords: colorectal cancer, dicer, microRNA
MicroRNAs (miRNAs) are ≈22-nt noncoding RNAs that are processed from larger (≈80-nt) precursor hairpins by the RNase III enzyme Dicer into miRNA:miRNA* duplexes (1–3). One strand of these duplexes associates with the RNA-induced silencing complex (RISC), whereas the other is generally degraded (1). The miRNA–RISC complex targets messenger RNAs for translational repression or mRNA cleavage. There has been considerable debate about the total number of miRNAs that are encoded in the human genome. Initial estimates, relying mostly on evolutionary conservation, suggested there were up to 255 human miRNAs (4). More recent analyses have demonstrated there are numerous nonconserved human miRNAs and suggest this number may be significantly larger (5).
Both cloning and bioinformatic approaches have been used to identify miRNAs. Direct miRNA cloning strategies identified many of the initial miRNAs and demonstrated that miRNAs are found in many species (6–16). However, the throughput of this approach is low, and cloning approaches have appeared to approach saturation (8). Bioinformatic strategies have recently been used to identify potential miRNAs predicted on the basis of various sequence and structural characteristics (4, 7). However, such gene predictions may not point to all legitimate miRNAs, especially those that are not phylogenetically conserved, and all in silico predictions require independent experimental validation.
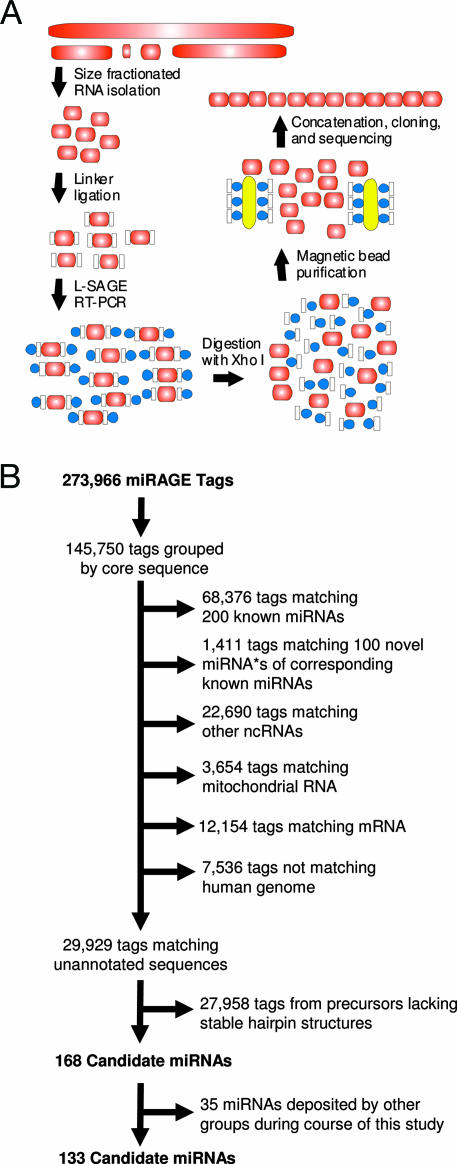
To increase the efficiency of discovery of small RNA species, we have developed an approach called miRNA serial analysis of gene expression (miRAGE). This approach combines aspects of direct miRNA cloning and SAGE (17). Similar to traditional cloning approaches, miRAGE starts with the isolation of 18- to 26-base RNA molecules to which specialized linkers are ligated, and which are reverse-transcribed into cDNA (Fig. 1A). However, subsequent steps, including amplification of the complex mixture of cDNAs using PCR, tag purification, concatenation, cloning, and sequencing, have been performed by using SAGE methodology optimized for small RNA species. This approach has the advantage of generating large concatemers that can be used to identify as many as 35 tags in a single sequencing reaction, whereas existing cloning protocols analyze on average approximately five miRNAs per reaction (8).
Fig. 1.
miRAGE approach for isolation of miRNAs. (A) Schematic of miRAGE method. The approach involves isolation of small RNA species (red ovals), followed by ligation of specialized linkers (white rectangles) that enable robust RT-PCR with biotinylated primers (blue circles). Linkers are enzymatically cleaved and removed by binding to streptavidin-coated magnetic beads (yellow ovals). Released tags are concatenated, cloned, and sequenced. (B) Bioinformatic analyses of miRAGE tags. Tags were grouped together based on a 12-bp internal core sequence. The most highly represented tag in each group was then compared to various RNA databases. Tags not matching known RNA sequences were compared to the human genome and analyzed for precursors with thermodynamically stable hairpin structures (see Materials and Methods for more details).
Results and Discussion
Genome-Wide miRNA Analysis with miRAGE.
Using miRAGE, we analyzed 273,966 cDNA tags obtained from four human colorectal cancers and two matching samples of normal colonic mucosae. Comparing these tags to the existing miRNA database identified 68,376 tags matching known miRNA sequences. These represent the largest collection of human miRNA sequences identified to date, because all previous human miRNA cloning analyses in aggregate have analyzed <2,000 miRNA molecules. The expression level of the miRNAs detected by miRAGE ranged over 4 orders of magnitude (from 23,431 observations for miR-21 to 20 miRNAs that were observed only once), suggesting this approach can detect miRNAs present at varied expression levels. The identified miRNA tags matched 200 of the mature miRNAs present in the public miRBase database (2) (Table 2, which is published as supporting information on the PNAS web site), and 52 of these were expressed at significantly different levels between tumor cells and normal colonic epithelium (P < 0.05, Fisher exact test; Table 3, which is published as supporting information on the PNAS web site). Importantly, of the already catalogued miRNAs, these results provide novel experimental evidence for 62 miRNAs whose presence in this database was based solely on phylogenetic predictions.
In addition to detecting known or predicted miRNAs, 1,411 of the miRAGE tags represented 100 previously unrecognized miRNA* forms of known miRNAs (Table 4, which is published as supporting information on the PNAS web site). miRNA* molecules correspond to the short-lived complementary strand present in initial miRNA duplexes, and their biologic role, if any, has yet to be elucidated. Although miRNA* have been inferred to exist for all miRNAs, only 24 human miRNAs* have previously been reported in the public database. These analyses therefore provide substantially greater evidence for the presence of these molecules in human cells.
Evaluation of Novel miRNAs.
We next focused on evaluating whether the miRAGE tags not matching known miRNAs might represent novel miRNA species. As a first step, miRAGE tags were compared with existing gene databases to exclude sequences matching known RNAs, including noncoding RNAs, mRNAs, and RNAs derived from mitochondrial sequences (Fig. 1B). The remaining tags were then evaluated in silico for the ability of their putative precursor sequences to form hairpin structures that were thermodynamically stable. The miRAGE approach in combination with these steps were expected to fulfill both the “expression” and “biogenesis” criteria recently put forward by Ambros et al. (18) in an effort to maintain a uniform system for miRNA annotation. Using these criteria, a total of 168 tags were identified that corresponded to putative novel miRNAs.
Validation of Novel miRNAs.
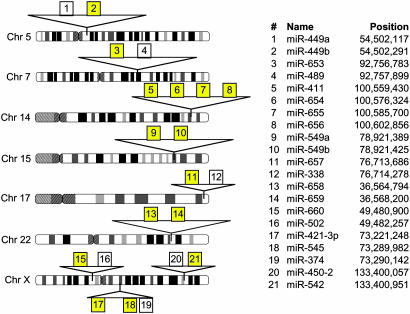
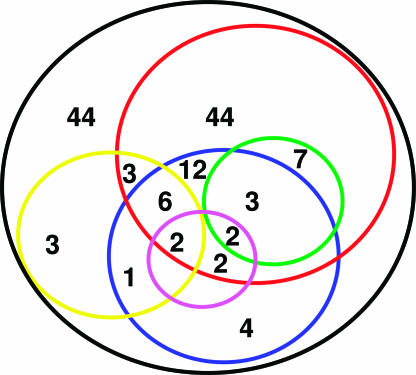
During the course of our study, 35 of these 168 miRAGE tags were independently identified by using a combination of bioinformatic and expression analyses (5). These findings provide a separate measure of validation of the miRAGE approach for miRNA identification. Several lines of evidence suggested that most of remaining 133 miRAGE tags also corresponded to previously uncharacterized miRNAs (Table 5, which is published as supporting information on the PNAS web site). First, phylogenetic conservation was determined for each tag precursor structure with respect to chimpanzee, mouse, rat, dog, chicken, pufferfish, and zebrafish genomes. A total of 32 of the 133 candidate miRNAs had conserved precursor structures. Furthermore, six of the miRNA candidates showed significant homology to the mature miRNA sequence of known miRNAs. Although these observations provide support for evolutionarily conserved novel miRNAs, they should not be used to exclude the remaining tags as legitimate miRNAs, because a significant number of recently reported human miRNAs lack homology to species other than primates (5). Second, 81 of the novel candidate miRNAs were represented by more than one miRAGE tag or were independently detected in additional samples by using either miRNA microarrays (5, 19) (Table 6, which is published as supporting information on the PNAS web site) or quantitative real-time PCR (Table 7 and Fig. 7, which are published as supporting information on the PNAS web site). Third, 15 of the candidate miRNAs were localized to genomic clusters of two or more miRNAs separated by an average distance of 10 kb (Fig. 2). This physical proximity is consistent with recent reports of miRNAs clustering within the human genome (20). Fourth, identification of a corresponding miRNA* sequence (with characteristic 3′ overhangs) to a particular miRNA is a strong indicator that the small RNA species in question was processed by an RNase III enzyme such as Dicer. miRNA* tags were observed for 12 of the candidate miRNA sequences. In total, 89 of the 133 novel candidate miRNAs had at least one independent piece of supporting evidence buttressing their legitimacy (Fig. 3).
Fig. 2.
Clustering of miRNAs in the human genome. Analysis of all 133 miRNAs identified 15 that were near other known or novel miRNAs. Yellow boxes represent candidate miRNAs, whereas white boxes represent known miRNAs. Position coordinates are based on National Center for Biotechnology Information Genome Build 35/University of California, Santa Cruz May 2004 assembly.
Fig. 3.
Validation of 133 candidate human miRNAs. A total of 133 miRNA candidates fulfilled expression and biogenesis criteria (black circle). Additional levels of validation include phlyogenetically conserved precursor structures (blue circle), multiple observations of expression (red circle), genomic clustering (yellow circle), observation of corresponding miRNA* forms (green circle), and strong homology to known miRNAs (pink circle).
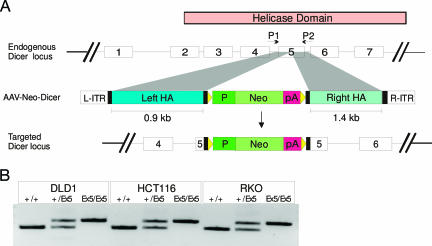
As a separate experimental approach to validate candidate miRNAs, we examined whether the generation of these small RNAs depended on Dicer processing. The rationale for this analysis was based on the fact that Dicer-depleted cells contain reduced amounts of mature miRNAs (18). However, because Dicer −/− vertebrate cells have been shown to be inviable (21), we sought to generate a Dicer mutant line displaying a hypomorphic phenotype. Such a mutant has been reported in mouse studies targeting the N terminus of Dicer (22). Accordingly, we disrupted exon 5 of the human Dicer gene by using an AAV targeting construct, thereby interrupting a well conserved segment of the N-terminal helicase domain while sparing the RNase III domains. The helicase domain was successfully disrupted by this approach in three different colorectal cancer cell lines (Fig. 4).
Fig. 4.
Disruption of human DICER1 helicase domain in colorectal cancer cells. (A) The endogenous locus is shown together with an AAV-Neo targeting construct for insertion into exon 5 of DICER1. HA, homology arm; P, SV40 promoter; Neo, geneticin-resistance gene; R-ITR and L-ITR are right and left inverted terminal repeats; triangles, loxP sites. (B) PCR analysis of parental (+/+), heterozygous (+/Ex5), and homozygous (Ex5/Ex5) clones from DLD1, HCT116, and RKO colorectal cancer cell lines. Primers used for PCR analysis (P1 and P2) are indicated above the endogenous locus in A.
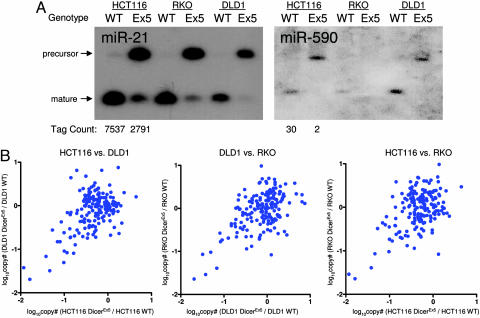
Analysis of selected miRNA genes from all three Dicer exon 5-disrupted lines (hereafter referred to as Dicerex5) revealed reduced amounts of mature miRNAs and accumulation of miRNA precursors when compared to their corresponding parental lines (Figs. 5A and B). miRAGE was then performed on both HCT116 wild type and HCT-Dicerex5 cells to quantify differences of known and novel miRNA levels. Of 97 known miRNAs detected in these two cell lines, 55 were differentially expressed, and for 53 of these 55, there was an average 7-fold reduction of miRNA levels in Dicerex5 cells compared with wild-type cells (Table 8, which is published as supporting information on the PNAS web site). Examination of the 168 candidate miRNAs similarly revealed that among the six candidates that were differentially expressed, there was an average 14-fold reduction of miRNA levels in Dicerex5 cells (Table 1). These observations are consistent with the conclusion that Dicer is required for the biogenesis of a subset of known and novel miRNAs.
Fig. 5.
miRNA expression in colorectal cancer cells with Dicer disruption. (A) Northern blot analyses show decreased mature miRNAs and increased levels of miRNA precursors in Dicerex5 (Ex5) compared with Dicer wild-type (WT) cells using probes for miR-21 and miR-590. (B) Expression levels of known miRNAs as determined by primer-extension quantitative PCR (PE-qPCR), as described (33). For each graph, pairwise comparisons are displayed showing the ratio of expression in Dicerex5 to WT clones of each cell type.
Table 1.
Evaluation of differentially expressed candidate miRNAs by miRAGE
| Name | Dicer WT | Dicerex5 | P value |
|---|---|---|---|
| miR-92b | 38 | 1 | 0 |
| miR-590 | 30 | 2 | 0 |
| miR-193b | 12 | 1 | 0.003415 |
| miR-340* | 11 | 2 | 0.022446 |
| miR-450 | 6 | 0 | 0.031242 |
| miR-618 | 5 | 0 | 0.031244 |
Numbers in Dicer wild-type (WT) and Dicere×5 columns represent the number of normalized tags observed in the miRAGE libraries.
Concluding Remarks.
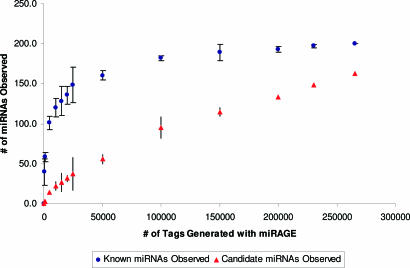
Our studies have provided experimental evidence that the human genome contains a much larger number of miRNAs than previously appreciated (4). To determine the rate at which uncharacterized miRNAs are likely to be discovered by using miRAGE, we simulated the number of miRNAs species that would have been detected by using subsets of the tags analyzed (Fig. 6). Although the number of known miRNAs clearly plateaus after analysis of ≈50,000 tags, the number of novel miRNAs appears to increase linearly even at ≈270,000 tags. These observations suggest many novel miRNAs remain to be identified.
Fig. 6.
Discovery of known and novel miRNAs using miRAGE. Each point represents the average number of known or novel miRNAs (y axis) that were identified by analysis of three simulated subsets comprising the number of miRAGE tags indicated (x axis).
Because our analysis has focused on cells from one tissue type, it is likely that similar analyses of other cell and tissue types will be equally informative. The tools we have developed, miRAGE and the Dicerex5 cells with defective miRNA processing, should provide a facile way to identify and validate novel miRNAs. As new lower-cost sequencing methods continue to be developed (23–25), this approach will become progressively more useful for the discovery of the compendium of miRNAs present in humans and other organisms.
Materials and Methods
Cell Culture and Colorectal Tissue.
Colorectal cancer cell lines HCT116, DLD1, RKO, CACO-2, SW480, and their derivatives were cultured in McCoy’s 5A medium supplemented with 10% FCS and penicillin/streptomycin. Samples of colorectal cancer tissue and matched normal colonic epithelium were obtained from patients undergoing surgery and were frozen immediately (<10 min) after surgical resection. Acquisition of tissue specimens was performed in accordance with Health Insurance Portability and Accountability Act of 1996 (HIPAA) regulations.
RNA, DNA, and RNA/DNA Oligonucleotides.
RNA and RNA/DNA oligonucleotides were obtained from Dharmacon Research (Lafayette, CO). Deoxyribonucleotides are preceded by a “d.” miRAGE 3′ linker: 5′-phosphate-UCUCGAGGUACAUCGUUdAdGdAdAdGdCdTdTdGdAdAdTdTdCdGdAdGdCdAdGdAdAdAN3-3′; miRAGE 5′ linker: 5′-dTdTdTdGdGdAdTdTdTdGdCdTdGdGdTdGdCdAdGdTdAdCdAdAdCdTdAdGdGdCdTdTdACUCGAGC; 18-base RNA standard: 5′-phosphate-ACGUUGCACUCUGAUACC; 26-base RNA standard: 5′-phosphate-CCGGUUCAUCACGUCUAAGAAUCAUG. DNA oligonucleotides were obtained from Integrated DNA Technologies (San Jose, CA). miRAGE reverse transcription primer: 5′-TTTCTGCTCGAATTCAAGCTTCT; LongSage PCR primer (forward): 5′-biotin-TTTTTTTTTGGATTTGCTGGTGCAGTACA-3′; LongSage PCR primer (reverse): 5′-biotin-TTTTTTTTTCTGCTCGAATTCAAGCTTCT-3′.
miRAGE Approach for miRNA Identification.
Step 1: 18- to 26-bp RNA isolation and linker ligation.
Total RNA was isolated from cell lines/tissue samples by using the RNagents kit (Promega) following the manufacturer’s protocol, with the exception that no final 75% ethanol wash was performed. RNA of the 18- to 26-base size range was isolated by electrophoresing 1 mg of total RNA alongside 18- and 26-base RNA standards on two 15% polyacrylamide TBE/Urea Novex gels (Invitrogen) at 180 V for 70 min. The 18- and 26-base RNA standards were carried through all subsequent ligation steps to serve as size standards for gel purification. RNAs ranging from 18 to 26 bases in length were visualized with SYBR Gold Nucleic Acid Gel Stain (Molecular Probes), excised from the gel, pulverized by spinning at high speed through an 18-gauge needle-pierced centrifuge tube, and gel-extracted by incubating the gel slices in 0.3 M NaCl at 4°C on a rotisserie-style rotator for 5 h. The contents were then transferred into a Costar Spin-X Centrifuge Tube Filter (VWR Scientific), spun into a fresh tube, EtOH-precipitated (by adding 3 volumes of 100% EtOH), and resuspended in water. Small RNAs were subsequently dephosphorylated with calf intestinal alkaline phosphatase (NEB, Beverly, MA) at 50°C for 30 min, phenol/chloroform-extracted, re-EtOH precipitated, and ligated to the miRAGE 3′ Linker with T4 RNA ligase (NEB) at 37°C for 1 h. After gel purification of 58- to 66-base RNA products and EtOH precipitation (as described above), the samples were phosphorylated with T4 polynucleotide kinase (NEB) at 37°C for 30 min, phenol/chloroform-extracted, EtOH-precipitated, and ligated (as above) to the miRAGE 5′ Linker.
Step 2: Tag amplification, isolation, concatenation, cloning, and sequencing.
After gel purification of RNA products ranging from 98 to 106 bases, reverse transcription of the ligation products was performed by using miRAGE reverse transcription primer and SuperScript II RT (Invitrogen) for 50 min at 45°C. Subsequently, the procedures for amplifying, isolating, purifying, concatenating, cloning, and sequencing tags are nearly identical to those performed in LongSAGE and Digital Karyotyping, except that miRAGE PCR products range in size from 110 to 118 bp, and miRAGE tags (not ditags) were released from linkers with XhoI endonuclease (NEB). The sequencing of concatemer clones was performed by contract sequencing at Agencourt (Beverly, MA). Resulting sequence files were trimmed by using phred sequence analysis software (CodonCode, Dedham, MA), and 18- to 26-bp tags were extracted by using the sage2000 software package, which identifies the fragmenting enzyme site between tags, extracts intervening tags, and records them in a database.
Bioinformatic Analyses of miRAGE Tags.
Step 1: Grouping and comparing miRAGE tags to known RNAs.
All tags sharing a common set of 11 of 12 core internal sequence elements were assembled into groups containing all related members. The tag with the most counts in each group was further analyzed. Grouping facilitated analysis by (i) eliminating rare sequencing errors and (ii) removing trivial miRNA variants, because miRNAs are known to display both 5′ and 3′ variation. The tags were subsequently compared to databases of known RNA sequences (miRNAs, mRNAs, rRNAs, etc.), using blast, and those tags matching known sequences were removed from further analysis. The tags obtained by miRAGE were compared with public databases on September 1, 2005. Subsequent additions and changes to these databases are not reflected in the data analysis.
Step 2: Secondary structure analysis and hairpin stability scoring of candidate miRNAs.
To determine potential miRNA precursor structures, each tag was compared to the human genome sequence. For tags with perfect matches, a total of 75 bp (60 + 15 bp) of flanking genomic sequence around each tag was extracted. Because there are two possible precursors for each tag (i.e., the tag can be located on the 5′ or 3′ arm of a putative hairpin), pairs of theoretical precursors were extracted from the human genome at the position of each tag and were carried through the following analysis. Secondary structure and free energy of folding were determined for each pair of precursor structures by using mfold 3.2 (26, 27) and compared to values obtained for known miRNAs. The values used for thermodynamic evaluation were the free energy of folding of each precursor sequence (ΔGfolding) and the difference of ΔGfolding between the two possible precursors (ΔΔGfolding). Analysis of an arbitrary set of 126 known miRNAs using these thermodynamic analyses revealed that the highest ΔGfolding was −22.6, and there were no miRNAs with a ΔGfolding > −29.0, which had a ΔΔGfolding < 5. Therefore, for a candidate miRNA precursor structure to be considered legitimate, it would have to have either (i) ΔGfolding ≤ −29 or (ii) −29 < ΔGfolding ≤ −22 and ΔΔGfolding > 5. In cases where both precursors fulfilled these criteria, the member of each pair with the lowest ΔGfolding was further considered. Precursors that had not been excluded up to this point were subsequently analyzed to determine whether they conformed to generally acceptable miRNA base-pairing standards (base-pairing involving at least 16 of the first 22 nucleotides of the miRNA and the other arm of the hairpin) (18).
Step 3: Determination of hairpin conservation.
We classified all candidate miRNAs as either “conserved” or “nonconserved” by using the University of California at Santa Cruz phastCons database (28). This database has scores at each nucleotide in the human genome that correspond to the degree of conservation of that particular nucleotide in chimpanzee, mouse, rat, dog, chicken, pufferfish, and zebrafish. The algorithm is based on a phylogenetic hidden Markov model using best-in-genome pairwise alignment for each species (based on blastz), followed by multialignment of the eight genomes. A hairpin was defined as conserved if the average phastCons conservation score over the seven species in any 15-nt sequence in the hairpin stem is at least 0.9 (5, 29).
Determination of Homology of Candidate miRNAs to Existing miRNAs.
One hundred random 22 mers were generated and compared to the miRBase database using the SSEARCH search algorithm, and expect values were obtained for each. E values for randomly generated sequences ranged from 0.07 to 23. All 133 miRNA candidates were subsequently analyzed, and tags with E values <0.05 were deemed to have homology to existing miRNAs.
miRNA Microarray Expression Analysis.
Five micrograms of total RNA from human placenta, prostate, testes, and brain (Ambion, Austin, TX) were size-fractionated (<200 nt) by using the mirVana kit (Ambion) and labeled with Cy3 (placenta and testes) and Cy5 (prostate and brain) fluorescent dyes. Pairs of labeled samples were hybridized to dual-channel microarrays. Microarray assays were performed on a μParaFlo microfluidics chip with each of the detection probes containing a nucleotide sequence of coding segment complementary to a specific microRNA sequence and a long nonnucleotide molecule spacer that extended the detection probe away from the substrate. The melting temperature of the detection probes was balanced by incorporation of varying number of modified nucleotides with increased binding affinities. The maximal signal level of background probes was 180. A miRNA detection signal threshold was defined as twice the maximal background signal.
Quantitative RT-PCR (qRT-PCR) Expression Analysis.
qRT-PCRs were performed by using SuperTaq Polymerase (Ambion) and the mirVana qRT-PCR miRNA Detection Kit (Ambion) following the manufacturer’s instructions. Reactions contained custom-designed oligonucleotide DNA primers (Integrated DNA Technologies) specific for 36 novel putative miRNAs or mirVana qRT-PCR Primer Sets specific for hsa-miR-16, hsa-miR-24, hsa-miR-143, or human 5S rRNA as positive controls. For each set of primers, 100 ng of FirstChoice human colon Tumor/Normal Adjacent Tissue RNA (Ambion); a pool containing 50 ng of HCT116, RKO, and DLD-1 cell lines total RNA; a pool containing 50 ng of FirstChoice Total RNA from human brain, cervix, thymus, and skeletal muscle (Ambion); and a no-template negative control were tested. All RNAs were treated with TURBO DNase. qRT-PCR was performed on an ABI7000 thermocycler (Applied Biosciences), and end-point reaction products were also analyzed on a 3.5% high-resolution agarose gel (Ambion) stained with ethidium bromide to discriminate between the correct amplification products (≈90 bp) and the potential primer dimers.
Targeted Disruption of the Human Dicer locus.
The strategy for creating knockouts with AAV vectors was performed as described (30, 31). The targeting construct pAAV-Neo-Dicer was made by PCR, by using bacterial artificial chromosome clone CITB 2240H23 (Invitrogen) as the template for the homology arms. A targeted insertion was made in exon 5, which is part of the helicase domain. Details of the vector design and sequences of all PCR primers are available from the authors upon request. Stable G418-resistant clones were initially selected in the presence of Geneticin (Invitrogen), then routinely propagated in the absence of selective agents.
Determination of Differential Expression.
Tag numbers from the different libraries were normalized and compared by using a Fisher exact test (significance threshold P = 0.05) with Bonferroni correction (32).
Supplementary Material
Acknowledgments
We thank Levy Kopelovich for helpful discussions and David Wong for sequence analysis and primer design. This work was supported by the Strang Cancer Prevention Center, the Division of Cancer Prevention of the National Cancer Institute, the Ludwig Trust, the Pew Charitable Trusts, and National Institutes of Health Grant CA057345.
Abbreviations
- miRNA
microRNA
- SAGE
serial analysis of gene expression
- miRAGE
microRNA SAGE
- Dicerex5
Dicer exon 5-disrupted lines
- qRT-PCR
quantitative RT-PCR.
Footnotes
Conflict of interest statement: K.W.K. and V.E.V. receive research funding from Genzyme, and K.W.K., V.E.V., and Johns Hopkins University own Genzyme stock, which is subject to certain restrictions under Johns Hopkins University policy. K.W.K. and V.E.V. are also paid consultants to Genzyme. The terms of this arrangement are being managed by Johns Hopkins University in accordance with its conflict of interest policies.
References
- 1.Bartel D. P. Cell. 2004;116:281–297. doi: 10.1016/s0092-8674(04)00045-5. [DOI] [PubMed] [Google Scholar]
- 2.Griffiths-Jones S. Nucleic Acids Res. 2004;32:D109–111. doi: 10.1093/nar/gkh023. [DOI] [PMC free article] [PubMed] [Google Scholar]
- 3.Bernstein E., Caudy A. A., Hammond S. M., Hannon G. J. Nature. 2001;409:363–366. doi: 10.1038/35053110. [DOI] [PubMed] [Google Scholar]
- 4.Lim L. P., Glasner M. E., Yekta S., Burge C. B., Bartel D. P. Science. 2003;299:1540. doi: 10.1126/science.1080372. [DOI] [PubMed] [Google Scholar]
- 5.Bentwich I., Avniel A., Karov Y., Aharonov R., Gilad S., Barad O., Barzilai A., Einat P., Einav U., Meiri E., et al. Nat. Genet. 2005;37:766–770. doi: 10.1038/ng1590. [DOI] [PubMed] [Google Scholar]
- 6.Michael M. Z., SM O. C., van Holst Pellekaan N. G., Young G. P., James R. J. Mol. Cancer Res. 2003;1:882–891. [PubMed] [Google Scholar]
- 7.Lagos-Quintana M., Rauhut R., Meyer J., Borkhardt A., Tuschl T. RNA. 2003;9:175–179. doi: 10.1261/rna.2146903. [DOI] [PMC free article] [PubMed] [Google Scholar]
- 8.Lagos-Quintana M., Rauhut R., Lendeckel W., Tuschl T. Science. 2001;294:853–858. doi: 10.1126/science.1064921. [DOI] [PubMed] [Google Scholar]
- 9.Lau N. C., Lim L. P., Weinstein E. G., Bartel D. P. Science. 2001;294:858–862. doi: 10.1126/science.1065062. [DOI] [PubMed] [Google Scholar]
- 10.Lee R. C., Ambros V. Science. 2001;294:862–864. doi: 10.1126/science.1065329. [DOI] [PubMed] [Google Scholar]
- 11.Mourelatos Z., Dostie J., Paushkin S., Sharma A., Charroux B., Abel L., Rappsilber J., Mann M., Dreyfuss G. Genes Dev. 2002;16:720–728. doi: 10.1101/gad.974702. [DOI] [PMC free article] [PubMed] [Google Scholar]
- 12.Dostie J., Mourelatos Z., Yang M., Sharma A., Dreyfuss G. RNA. 2003;9:180–186. doi: 10.1261/rna.2141503. [DOI] [PMC free article] [PubMed] [Google Scholar]
- 13.Houbaviy H. B., Murray M. F., Sharp P. A. Dev. Cell. 2003;5:351–358. doi: 10.1016/s1534-5807(03)00227-2. [DOI] [PubMed] [Google Scholar]
- 14.Kim J., Krichevsky A., Grad Y., Hayes G. D., Kosik K. S., Church G. M., Ruvkun G. Proc. Natl. Acad. Sci. USA. 2004;101:360–365. doi: 10.1073/pnas.2333854100. [DOI] [PMC free article] [PubMed] [Google Scholar]
- 15.Kasashima K., Nakamura Y., Kozu T. Biochem. Biophys. Res. Commun. 2004;322:403–410. doi: 10.1016/j.bbrc.2004.07.130. [DOI] [PubMed] [Google Scholar]
- 16.Suh M. R., Lee Y., Kim J. Y., Kim S. K., Moon S. H., Lee J. Y., Cha K. Y., Chung H. M., Yoon H. S., Moon S. Y., et al. Dev. Biol. 2004;270:488–498. doi: 10.1016/j.ydbio.2004.02.019. [DOI] [PubMed] [Google Scholar]
- 17.Velculescu V. E., Zhang L., Vogelstein B., Kinzler K. W. Science. 1995;270:484–487. doi: 10.1126/science.270.5235.484. [DOI] [PubMed] [Google Scholar]
- 18.Ambros V., Bartel B., Bartel D. P., Burge C. B., Carrington J. C., Chen X., Dreyfuss G., Eddy S. R., Griffiths-Jones S., Marshall M., et al. RNA. 2003;9:277–279. doi: 10.1261/rna.2183803. [DOI] [PMC free article] [PubMed] [Google Scholar]
- 19.Barad O., Meiri E., Avniel A., Aharonov R., Barzilai A., Bentwich I., Einav U., Gilad S., Hurban P., Karov Y., et al. Genome Res. 2004;14:2486–2494. doi: 10.1101/gr.2845604. [DOI] [PMC free article] [PubMed] [Google Scholar]
- 20.Altuvia Y., Landgraf P., Lithwick G., Elefant N., Pfeffer S., Aravin A., Brownstein M. J., Tuschl T., Margalit H. Nucleic Acids Res. 2005;33:2697–2706. doi: 10.1093/nar/gki567. [DOI] [PMC free article] [PubMed] [Google Scholar]
- 21.Fukagawa T., Nogami M., Yoshikawa M., Ikeno M., Okazaki T., Takami Y., Nakayama T., Oshimura M. Nat. Cell Biol. 2004;6:784–791. doi: 10.1038/ncb1155. [DOI] [PubMed] [Google Scholar]
- 22.Yang W. J., Yang D. D., Na S., Sandusky G. E., Zhang Q., Zhao G. J. Biol. Chem. 2005;280:9330–9335. doi: 10.1074/jbc.M413394200. [DOI] [PubMed] [Google Scholar]
- 23.Margulies M., Egholm M., Altman W. E., Attiya S., Bader J. S., Bemben L. A., Berka J., Braverman M. S., Chen Y. J., Chen Z., et al. Nature. 2005;437:376–380. doi: 10.1038/nature03959. [DOI] [PMC free article] [PubMed] [Google Scholar]
- 24.Leamon J. H., Lee W. L., Tartaro K. R., Lanza J. R., Sarkis G. J., deWinter A. D., Berka J., Weiner M., Rothberg J. M., Lohman K. L. Electrophoresis. 2003;24:3769–3777. doi: 10.1002/elps.200305646. [DOI] [PubMed] [Google Scholar]
- 25.Shendure J., Mitra R. D., Varma C., Church G. M. Nat. Rev. Genet. 2004;5:335–344. doi: 10.1038/nrg1325. [DOI] [PubMed] [Google Scholar]
- 26.Zuker M. Nucleic Acids Res. 2003;31:3406–3415. doi: 10.1093/nar/gkg595. [DOI] [PMC free article] [PubMed] [Google Scholar]
- 27.Mathews D. H., Sabina J., Zuker M., Turner D. H. J. Mol. Biol. 1999;288:911–940. doi: 10.1006/jmbi.1999.2700. [DOI] [PubMed] [Google Scholar]
- 28.Siepel A., Bejerano G., Pedersen J. S., Hinrichs A. S., Hou M., Rosenbloom K., Clawson H., Spieth J., Hillier L. W., Richards S., et al. Genome Res. 2005;15:1034–1050. doi: 10.1101/gr.3715005. [DOI] [PMC free article] [PubMed] [Google Scholar]
- 29.Berezikov E., Guryev V., van de Belt J., Wienholds E., Plasterk R. H., Cuppen E. Cell. 2005;120:21–24. doi: 10.1016/j.cell.2004.12.031. [DOI] [PubMed] [Google Scholar]
- 30.Hirata R., Chamberlain J., Dong R., Russell D. W. Nat. Biotechnol. 2002;20:735–738. doi: 10.1038/nbt0702-735. [DOI] [PubMed] [Google Scholar]
- 31.Kohli M., Rago C., Lengauer C., Kinzler K. W., Vogelstein B. Nucleic Acids Res. 2004;32:e3. doi: 10.1093/nar/gnh009. [DOI] [PMC free article] [PubMed] [Google Scholar]
- 32.Romualdi C., Bortoluzzi S., D’Alessi F., Danieli G. A. Physiol. Genomics. 2003;12:159–162. doi: 10.1152/physiolgenomics.00096.2002. [DOI] [PubMed] [Google Scholar]
- 33.Raymond C. K., Roberts B. S., Garrett-Engele P., Lim L. P., Johnson J. M. RNA. 2005;11:1737–1744. doi: 10.1261/rna.2148705. [DOI] [PMC free article] [PubMed] [Google Scholar]
Associated Data
This section collects any data citations, data availability statements, or supplementary materials included in this article.


