



Abstract
The origins of extant G. pallidipes Austen (Diptera: Glossinidae) populations in the ecologically well studied Lambwe and Nguruman valleys in Kenya are controversial because populations have recovered after seemingly effective attempts to achieve high levels of control. We investigated microgeographic breeding structure of the tsetse fly, Glossina pallidipes (Diptera: Glossinidae) by analyzing spatial and temporal variation at eight microsatellite loci to test hypotheses about endemism and immigration. Samples were obtained at seasonal intervals from trap sites separated by 200 m to 14 km and arranged into blocks. G. pallidipes populations nearest to Lambwe and Nguruman also were sampled. Spatial analysis indicated genetic differentiation by genetic drift was much less among trapping sites within Lambwe and Nguruman (FST ≤ 0.049) than between them (FST = 0.232). FST between Serengeti and Nguruman was 0.16 and FST between Kodera Forest and Lambwe was 0.15. The genetic variance in G. pallidipes explained by dry and wet seasons (0.33%) was about one-fifth the variance among collection dates (1.6%) thereby indicating reasonable temporal stability of genetic variation. Gene frequencies in Kodera and Serengeti differed greatly from Lambwe and Nguruman thereby falsifying the hypothesis that Lambwe and Nguruman were repopulated by immigrants. Harmonic mean effective (= breeding) population sizes were 180 in Lambwe and 551 in Nguruman. The genetic data suggest G. pallidipes in Lambwe and Nguruman have been endemic for long intervals.
Keywords: Glossina pallidipes, microsatellites, genetic differentiation, genetic drift, gene flow, effective population size
Introduction
Tsetse flies, Glossina spp (Diptera: Glossinidae) are medically and economically important insects confined to sub-Saharan Africa and the southern tip of the Arabian peninsula. They are exclusively blood-feeding and are the only vectors of African trypanosomiasis. Mark-release-recapture studies indicate that tsetse flies in the morsitans group have a great capacity for dispersal and colonization of suitable habitats. Rogers (1977) observed that G. morsitans morsitans Westwood dispersed over two dimensions a mean 230 m daily and Vale et al. 1984 considered G. pallidipes Austen to be the most vagile tsetse fly. Furthermore, Williams et al. (1992) estimated G. pallidipes root mean square displacement rates of 360 to 1,100 m day−1. The displacement rate varied with season. In principle, such rapid dispersals would homogenize allele frequencies among populations and thus prevent genetic differentiation by drift.
Despite the abundant evidence that indicates morsitans group tsetse flies have a great capacity for dispersal, genetic data from nuclear and mitochondrial DNA markers seem to indicate otherwise. Krafsur et al. 1997 examined breeding structure of G. pallidipes at allozyme loci, and found surprisingly high levels of genetic differentiation among 11 populations. FST measured by the method of Weir & Cockerham (1984) was 0.24 ± 0.05. This translates into an equivalent exchange rate of only 0.8 reproducing flies per population per generation. Genetic studies using single-strand conformation polymorphism in mitochondrial DNA indicated about the same level of gene flow among eighteen G. pallidipes populations (Krafsur & Wohlford, 1999). More recently, comparative analyses of microsatellite, allozyme, and mitochondrial loci have provided further evidence that gene flow among G. pallidipes populations is restricted (Krafsur 2002a; Ouma et al, in press). The apparent inconsistency between ecological and genetic data calls for further investigation. Theoretically, gene flow declines with geographic distance (Wright, 1943; Rousset, 1997). Therefore, comparison of gene flow estimates with direct measures of dispersal should be made where studies are done over similar spatial scales. Krafsur (2003) suggested that direct comparisons of tsetse fly genetic data with ecological data obtained at discrepant geographic scales may be misleading. Most published ecological data pertain to distances less than ten to tens of kilometers whereas genetic sampling involves distances ranging from tens to thousands of kilometers (Krafsur, 2002b). Hence, it is necessary to examine local patterns of gene frequencies. The Lambwe and Nguruman regions of Kenya lend themselves to microgeographic studies because the ecology of G. pallidipes and trypanosomiasis has been studied extensively there (Turner, 1981, 1986; Turner and Brightwell, 1986; Wellde, 1989; Brightwell et al., 1992, 1997). Additionally, the Kenya Trypanosomiasis Research Institute (KETRI) has on-going tsetse monitoring programs in both regions.
G. pallidipes populations in Nguruman undergo seasonal expansions and contractions of great magnitude (Brightwell et al., 1992, 1997). Trapping data suggested to the foregoing authors that G. pallidipes invaded Nguruman in massive numbers each wet season from an escarpment that borders Tanzania. Lesser numbers were said to invade during dry seasons. Such massive immigration predicts genetic homogeneity between the source and host populations. This suggests the hypothesis that allele frequencies would be homogeneous across the escarpment, the Nguruman valley, and adjacent lowlands.
Ecological research suggests additional genetic hypotheses. Another trapping study in Nguruman showed G. pallidipes to be highly aggregated even at scales of 4 km (Odulaja et al., 2001), thereby suggesting the hypothesis that G. pallidipes populations maintain a high degree of local sub-structuring. Does the spatial aggregation predict detectable genetic differentiation?
There are additional issues that may be addressed by applying genetic methods. G. pallidipes populations in Nguruman and Lambwe Valley were subjected to human interference in two major ways: destruction of vegetation that forms the flies’ habitat; and attempts to eradicate tsetse by using insecticides (Turner, 1986; Brightwell et al., 2001) and traps (Dransfield et al., 1990; Dransfield and Brightwell, 2001). Habitat destruction can lead to environmental heterogeneity which in turn could create subdivided populations adapted to local conditions (Mopper and Strauss, 1998). Also, effective control efforts cause drastic declines in population numbers. But as recently as 2003, Lambwe was heavily infested with G. pallidipes (Ouma and Krafsur, personal observation) raising the question, did undetected, small numbers of G. pallidipes survive in treated areas, or did flies migrate from neighboring areas to re-infest Lambwe? To obtain information on the effects of season and control efforts on G. pallidipes populations, it is helpful to estimate effective population sizes (Ne).
Microsatellite markers were used to analyze genetic variation and estimate rates of gene flow among and within G. pallidipes trapping sites separated by distances ranging from 200 m to 14 km. Microsatellites are simple nucleotide repeats (e.g. CA-CA-CA) scattered throughout the nuclear genome (Queller et al., 1993). They vary in the number of repeats (and may also demonstrate single nucleotide polymorphisms) and hence in molecular weight. The research had three broad objectives: (1) to determine the degree of isolation of Lambwe Valley G. pallidipes from other conspecific populations by examining genetic distances and rates of gene flow among resident populations;(2) to examine effects of season and immigration in shaping the breeding structure of G. pallidipes in the Nguruman, and (3) to determine if earlier control operations had an impact on the effective population sizes of G. pallidipes. Specifically, the following hypotheses were tested: (i) allele frequencies are homogeneous among sites and blocks incorporating Lambwe and Kodera, (ii) allele frequencies are homogeneous across a transect incorporating Serengeti, the Rift Valley escarpment bordering Tanzania, Nguruman, and adjacent lowlands, (iii) allele frequencies are temporally homogeneous.
Materials and methods
Study sites
G. pallidipes was obtained from Lambwe Valley and Nguruman in western and south-western Kenya, respectively (Fig. 1). There were 15 trapping sites in Lambwe (0°41.29′ – 0°35.14′S, 34°13.36′ – 34°18.11′E) and 27 sites in Nguruman (1°57.04′ – 1°48.02′S, 36°07.52 – 36°03.08′E). Detailed descriptions of the geography of Lambwe Valley are available (Turner, 1986; Wellde, 1989). The two regions are about 240 km apart. The Lambwe Valley encompasses 324 km2, and lies between the Kanyamwa escarpment to the east and the Gwasi and Gembe Hills to the west. Lake Victoria lies 10 km to the northwest. The climate is warm and humid, with little fluctuation in mean monthly temperatures and saturation deficits (Turner, 1984). Average annual rainfall is approximately 1200 mm, with wet seasons in March-May and October-December. The southern end of the valley hosts a variety of game animals, and is fenced in a 120-km2 National Park, the Ruma. There are human settlements and livestock on the park’s periphery. We subdivided Ruma National Park into three sampling units: blocks A, B, and C that represent dense scrub thickets separated by grassland. Although G. pallidipes previously inhabited areas adjacent to Ruma such as the Kanyamwa Escarpment and Ruri Hills (Groenendijk et al., 1993), its distribution seems to have shrunk due to control operations by KETRI, the Kenya Wildlife Services, and the International Centre for Insect Physiology and Ecology. Our attempts to catch flies in these Ruma neighborhoods were unsuccessful.
Fig. 1.

Kenya and Tanzania. The study region includes Kodera, Lambwe, Serengeti, and Nguruman.
Nguruman is located in Kajiado district, south-west Kenya. Its altitude is about 700 m, with a mean annual rainfall of 500-700 mm seasonally distributed as in Lambwe. The Nguruman escarpment, with its steep wall rising to 1500 m, forms the western boundary (Mwangi et al., 1998). Tsetse habitat in Nguruman is approximately 600 km2. The vegetation consists of patches of woodland and thicket infested with two tsetse species, G. pallidipes and G. longipennis with the former being the predominant species. The lowland woodland patches are surrounded by open savannah, through which tsetse disperse during wet seasons (Brightwell et al., 1997). There is abundant game in Nguruman (Tarimo-Nesbitt et al., 1999). Nguruman sites were grouped into six blocks, Campsite, Kalema, Lengobei, Lengongu, Mukinyo, and Sampu.
The nearest known population tsetse centres were sampled to test hypotheses about origins of populations in Lambwe and Nguruman. Kodera is a planted coniferous forest ~ 50 km west of Lambwe. Serengeti lies in Tanzania between the Ngorongoro highlands and the Kenya-Tanzania border and is the nearest known G. pallidipes belt from Nguruman, about 170 km distant (Fig. 1).
Tsetse sampling
Tsetse flies were caught by using georeferenced biconical traps (Challier & Laveissiere, 1973) baited with cow urine (Baylis & Nambiro, 1993) and acetone. Traps were deployed along established transects, located in thicket and Acacia woodland, known habitats for G. pallidipes. Catches were emptied daily and the flies sexed and stored in aqueous 85% ethanol. Flies from each trap were stored separately. Geographical distances between sampling sites were determined by using a distance calculator (http://www.nau.edu/~cvm/latlongdist.html).
DNA extraction, PCR and microsatellite genotyping
DNA was extracted by using the cetyltrimethyl ammonium bromide (CTAB) protocol of Boyce et al. (1989) as modified by Shahjahan et al. (1995). Most flies were females. We amplified eight autosomal microsatellite loci via PCR. Primer sequences and PCR conditions were set forth in Ouma et al. (2003, GenBank accession numbers AY220498-AY220504) and Baker & Krafsur (2001, GenBank accession number AY033512). Genotyping flies was performed by using GeneScan® and Genotyper® as described (Krafsur, 2002a; Ouma et al., 2003).
Data analysis
Statistical analyses were performed by using GENEPOP version 3.4 (Raymond & Rousset, 1995a, http://wbiomed.curtin.edu.au/genepop/), SAS (SAS, 2001), ARLEQUIN version 2.0 (Schneider et al., 2000), and FSTAT version 2.9.3 (Goudet, 1995, 2001).
For each locus and sample, we estimated allele frequencies and observed and expected heterozygosities. Homogeneity of allele frequencies among trap sites and blocks was determined by using contingency chi-square tests. We also estimated probabilities of departure from Hardy-Weinberg equilibrium (HWE) within each sample at each locus. A Markov chain approximation (Guo & Thompson, 1992) was used to estimate the exact P-values. Significance of multiple P-values was tested by using Fisher’s method and P-values adjusted by applying the sequential Bonferroni correction (Holm, 1979; Rice, 1989). Genotypic linkage disequilibrium was tested by estimating the probability of independence of genotypes for each pair of loci within each sample by using a Markov Chain approximation.
Genetic differentiation between regions, blocks, and trap sites was assessed by exact tests of homogeneity of allele distribution (Raymond & Rousset, 1995b). Significance of pairwise comparisons was evaluated after applying the Bonferroni correction. Spatial structure was analyzed by means of Wright’s (1951) F-statistics. FST is the standardized variance in allele frequencies among populations. It also measures the average correlation of alleles within populations relative to the total. FIT, the overall inbreeding coefficient, measures the correlation of alleles within individuals among all populations. FIS is the nonrandom component of FIT, and describes the correlation of alleles within individuals in a population. The three statistics are interrelated, thus: (1 − FIT) = (1 − FST)*(1 − FIS). The extent of population differentiation was quantified by computing Weir & Cockerham’s (1984) estimators of F-statistics. Genetic structure was analyzed using an analysis of variance framework (AMOVA, Weir & Cockerham, 1984; Excoffier et al. 1992; Weir, 1996).
To test the hypothesis that FST = 0 at a locus, X2 =2NFST(k − 1), with (r − 1)(k − 1) degrees of freedom and N is the sample size, k is the number of alleles at the locus, and r is the number of subpopulations (Workman and Niswander, 1970). Rates of gene flow (Nm) among populations were estimated by rearranging Wright’s (1969) formula, FST = 1/(1+4Nm). Thus, Nm = (1 − FST)/4FST, assuming equilibrium between migration and drift. Nm represents the effective number of reproducing migrants between populations per generation (Slatkin, 1993). Nm and FST were also estimated by the private allele method that can provide less biased estimates of FST where allelic diversities are large (Slatkin & Barton, 1989).
Hierarchical analysis of diversity was performed according to Nei (1987). Of particular interest is GST, analogous to Wright’s FST. GST is a linear measure of genetic distance while FST is a geometric distance measure. Kruskal-Wallis one-way ANOVA was used to test hypotheses of homogeneity of allele counts and diversity estimates among populations.
Effective population size (Ne) is the size of an ideal population subject to the same effect of random genetic drift as the population under study (Wright, 1931). Effective harmonic mean population sizes (Ne) were estimated based on temporal variation in allele frequencies for samples collected at different times between May 2000 and December 2003. The standardized variance of allele frequencies (Fk) was calculated according to Pollak (1983) and discussed by Waples (1989). A variance statistic for K alleles is Fk = 1/(K −1)∑(xi − yi)2/(xi + yi)/2, where xi and yi are allele i frequencies at the first and second samplings, respectively. Calculations were done by using NeEstimator version 1.3 (Peel et al., 2004). Estimates of Ne assumed random sampling and negligible effects of mutation, selection, and migration (Waples, 1989). The number of generations per year for tsetse flies was taken to be eight.
It is important to note that genetic data based on microsatellite loci underestimate genetic differentiation because FST, GST, etc. cannot take values greater than the level of homozygosity (Hedrick, 1999). Homozygosities varied from 0.32 to 0.36 so the maximum differentiation we may detect is only ~ 0.36. Microsatellites are also subject to homoplasy (Estoup et al., 1995; Balloux et al., 2000), whereby two or more alleles are identical in state by convergence from different ancestors. Such alleles cannot be distinguished on gels because they have the same molecular weights. Clearly, microsatellites underestimate genetic differentiation thereby overestimating magnitudes of gene flow (Nagylaki, 1998)
Results
Distribution and correlation of allele frequencies
A total of 1388 flies were genotyped. One hundred and forty-one alleles were recorded in the two regions, 35 of which were private and 23 were singular. Shared alleles are set forth in Table 1. Of the private alleles, 16 were restricted to Lambwe and 19 were unique to Nguruman. Each locus showed two or three alleles shared between the regions. Generally, the predominant alleles were the same in both regions (Fig. 2). Alleles unique to either Lambwe or Nguruman occurred in low frequencies (≤ 5%).
Table 1.
Number of alleles scored (diagonally in bold italics), shared (above diagonal), and Kendall Tau b correlation coefficients (below diagonal) of allele frequencies among G. pallidipes in Lambwe and Nguruman.
| Lambwe
|
Nguruman
|
|||||||||||
|---|---|---|---|---|---|---|---|---|---|---|---|---|
| Sample | A | B | C | Kodera | CampSite | Kalema | Lengobei | Lengongu | Mukinyo | Oloibortoto | Sampu | Serengeti |
| A | 81 | 72 | 57 | 29 | 39 | 29 | 44 | 39 | 39 | 42 | 49 | 52 |
| B | 0.74 | 91 | 60 | 32 | 41 | 20 | 45 | 37 | 38 | 43 | 49 | 50 |
| C | 0.68 | 0.66 | 64 | 22 | 33 | 29 | 37 | 31 | 32 | 36 | 40 | 47 |
| Kodera | 0.31 | 0.31 | 0.23 | 42 | 24 | 15 | 28 | 21 | 23 | 27 | 24 | 26 |
| CampSite | 0.38 | 0.37 | 0.36 | 0.29 | 56 | 33 | 48 | 41 | 40 | 45 | 49 | 37 |
| Kalema | 0.42 | 0.40 | 0.49 | 0.22 | 0.71 | 34 | 34 | 32 | 31 | 33 | 34 | 31 |
| Lengobei | 0.40 | 0.36 | 0.38 | 0.33 | 0.76 | 0.71 | 63 | 43 | 44 | 52 | 54 | 42 |
| Lengongu | 0.45 | 0.39 | 0.38 | 0.28 | 0.77 | 0.75 | 0.77 | 48 | 42 | 40 | 46 | 35 |
| Mukinyo | 0.43 | 0.37 | 0.39 | 0.32 | 0.73 | 0.71 | 0.76 | 0.83 | 50 | 43 | 44 | 39 |
| Oloibortoto | 0.31 | 0.28 | 0.33 | 0.29 | 0.70 | 0.68 | 0.76 | 0.69 | 0.69 | 66 | 52 | 41 |
| Sampu | 0.37 | 0.32 | 0.36 | 0.21 | 0.73 | 0.68 | 0.76 | 0.77 | 0.70 | 0.67 | 75 | 48 |
| Serengeti | 0.37 | 0.28 | 0.45 | 0.18 | 0.38 | 0.52 | 0.40 | 0.41 | 0.46 | 0.34 | 0.41 | 79 |
All correlations were significant at P < 0.001
Fig. 2.
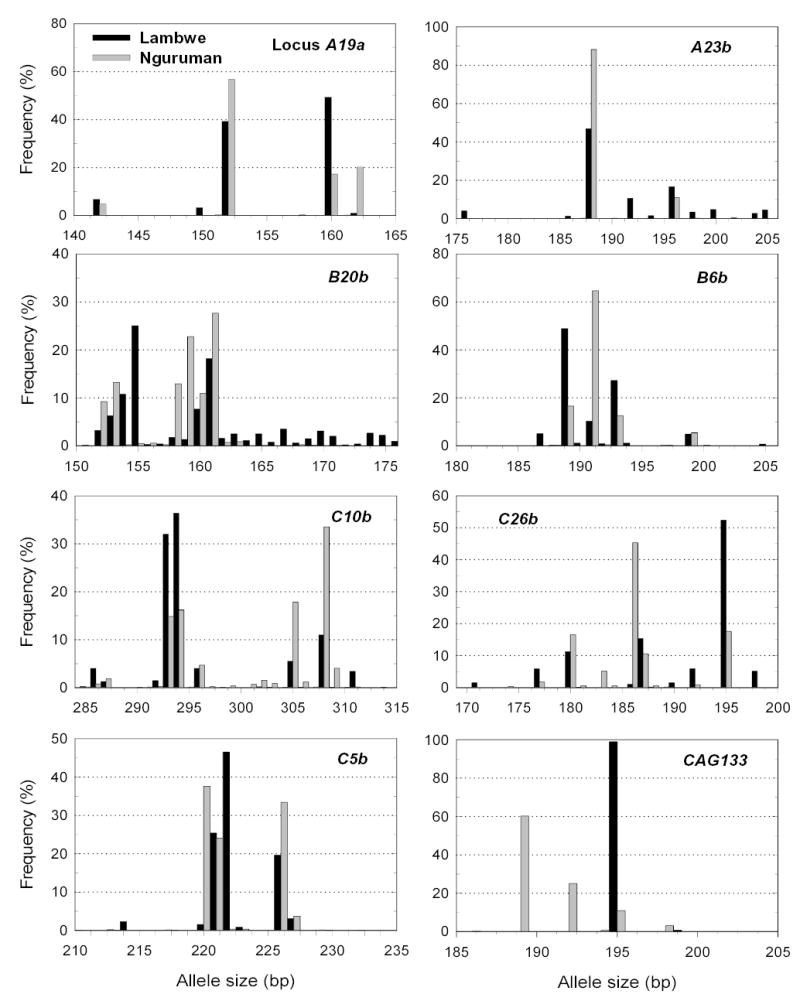
Allele frequency distribution in Lambwe (black bars) and Nguruman (grey).
Considering only Lambwe and Kodera, 116 alleles were detected. Thirty-eight of these (33%) were private. Nine of the 38 private alleles were restricted to Kodera. Fifty private alleles were found in Nguruman and Serengeti, 27 of which were restricted to Serengeti.
Table 1 shows correlations of allele frequencies pooled over sites within blocks. Correlation coefficients between allele frequencies in the same region were strongly positive and highly significant. Very low correlations were observed between allele frequencies in Lambwe and Nguruman indicating historically little gene flow between them. The mean correlation between Lambwe and Kodera was 28%; that between Nguruman and Serengeti was 42%. Allele frequencies were heterogeneous among blocks (Table 2).
Table 2.
G. pallidipes genetic variability and contingency chi-square analysis of homogeneity of allele frequencies among blocks.
| Lambwe (3 blocks) | Nguruman (7 blocks) | |||||||
|---|---|---|---|---|---|---|---|---|
| Locus | hea | No.alleles | df | X2 | hea | No.alleles | df | X2 |
| GpA19a | 0.582 | 7 | 12 | 68.5*** | 0.609 | 9 | 48 | 74.9** |
| GpA23b | 0.743 | 16 | 30 | 49.7 | 0.221 | 8 | 42 | 44.9 |
| GpB6b | 0.655 | 11 | 20 | 66.9*** | 0.509 | 10 | 54 | 127.7*** |
| GpB20b | 0.831 | 27 | 52 | 497.3*** | 0.770 | 18 | 102 | 355.1*** |
| GpC5b | 0.680 | 12 | 22 | 33.5 | 0.686 | 12 | 66 | 110.3*** |
| GpC10b | 0.712 | 16 | 30 | 310.4*** | 0.793 | 25 | 144 | 263.2*** |
| GpC26b | 0.687 | 11 | 20 | 27.2 | 0.717 | 14 | 78 | 135.9*** |
| GpCAG133 | 0.016 | 6 | 10 | 16.9 | 0.554 | 6 | 30 | 40.5 |
| Total | 0.613 | 106 | 196 | 1067.4*** | 0.607 | 102 | 564 | 1160.6*** |
Hardy Weinberg and linkage disequilibrium
When the Bonferroni correction was applied, 1.3% and 1.6% of the tests for heterozygote deficiency (positive FIS, P < 0.05) were significant in Lambwe and Nguruman, respectively. The deficiency of heterozygotes occurred randomly at different sampling locations at GpA19a, GpB20b, and GpC5b, most likely indicating the presence of null alleles.
Among the Lambwe samples, exact tests for genotypic linkage disequilibrium within sites showed 13 significant values of 420 comparisons. Twenty-one significant values are expected at the 5% level by chance alone. In Nguruman, twenty-six of 756 comparisons were significant. When the Bonferroni correction was applied only one significant value was observed in each region. No pair of loci was in linkage disequilibrium in more than one site, indicating the studied loci were independent markers.
Microsatellite diversities
Numbers of alleles and diversities observed among blocks or sites were homogeneous in Lambwe and in Nguruman (data not shown). Diversities and numbers of alleles observed among samples became heterogeneous when Serengeti was included in the analysis of Nguruman and when Kodera was included with Lambwe (X2[7] ≥ 14.7, P ~ 0.04).
Genetic differentiation and gene flow
F estimates departures from random mating. Estimates of FIS averaged over loci indicated that matings within and among sites were random. Mean FIS values did not differ significantly from zero (Table 3). The paucity of heterozygotes in Lambwe or Nguruman at GpA23b, GpB6b, GpC5b or GpC10b can be attributed to null alleles. Average FST values estimated over 15 sites within Lambwe and 27 sites within Nguruman were 0.049 and 0.04, respectively. FST estimated by the private allele method were 0.064 and 0.032 among Lambwe and Nguruman populations, respectively. When sites were pooled by region, FIS = 0.065 and FST = 0.232 between Lambwe and Nguruman (Table 3).
Table 3.
Single locus F-statistics (Weir and Cockerham 1984) for Glossina pallidipes
| Within regions | Between regionsa | |||||
|---|---|---|---|---|---|---|
| Lambwe (15 sites)
|
Nguruman (27 sites)
|
Lambwe vs. Nguruman
|
||||
| Locus | FIS | FST | FIS | FST | FIS | FST |
| GpA19a | −0.007 | 0.036*** | −0.029 | 0.003 | 0.028 | 0.081** |
| GpA23b | 0.014 | 0.011 | 0.163 | 0.004 | 0.028 | 0.105*** |
| GpB6b | 0.179 | 0.028*** | −0.270 | 0.061** | −0.019 | 0.185*** |
| GpB20b | 0.071 | 0.069*** | 0.078 | 0.129*** | 0.148 | 0.139*** |
| GpC5b | 0.365 | 0.003 | 0.312 | 0.020** | 0.321 | 0.125*** |
| GpC10b | 0.105 | 0.158*** | −0.120 | 0.029** | 0.022 | 0.116*** |
| GpC26b | −0.067 | 0.010 | −0.068 | 0.012 | −0.077 | 0.113*** |
| GpCAG133 | −0.147 | 0.125*** | 0.004 | −0.002 | 0.001 | 0.460*** |
| Meansb | 0.080 | 0.049 | −0.016 | 0.040 | 0.065 | 0.232 |
| S.E. | 0.054 | 0.022 | 0.066 | 0.020 | 0.049 | 0.074 |
Trapping sites within a region were pooled
Jackknife means and standard errors for F-statistics.
P<0.001,
P<0.0001
Because gene frequencies at trap site were homogeneous, they were pooled into blocks. Pairwise FST values between pooled sites are presented in Table 4. The highest FSTs were observed between Lambwe and Kodera, Nguruman and Serengeti and between Lambwe and Nguruman. Differentiation between blocks within regions was also significant (FST ≤ 0.051, P < 0.001, Table 5), thereby indicating a moderate level of genetic differentiation.
Table 4.
Pairwise genetic distance FST lower diagonal and gene flow (Nem, upper diagonal) for G. pallidipes populations. Outgroups Kodera and Serengeti are indicated in bold.
| Population | Block A | Block B | Block C | Kodera | Campsite | Oloibortoto | Sampu | Kalema | Lengongu | Lengobei | Mukinyo | Serengeti |
|---|---|---|---|---|---|---|---|---|---|---|---|---|
| Block A | — | 9.75 | 8.37 | 1.64 | 0.77 | 0.77 | 0.89 | 0.73 | 0.75 | 0.88 | 0.80 | 2.02 |
| Block B | 0.025 | — | 83.08 | 1.27 | 0.74 | 0.69 | 0.84 | 0.73 | 0.75 | 0.80 | 0.78 | 2.02 |
| Block C | 0.029 | 0.003 | — | 1.36 | 0.68 | 0.72 | 0.85 | 0.75 | 0.66 | 0.80 | 0.73 | 2.40 |
| Kodera | 0.132 | 0.164 | 0.155 | — | 0.58 | 0.61 | 0.66 | 0.53 | 0.57 | 0.66 | 0.61 | 1.07 |
| Campsite | 0.245 | 0.253 | 0.270 | 0.300 | — | 15.34 | 17.61 | 4.38 | 124.75 | 35.46 | 83.08 | 1.20 |
| Oloibortoto | 0.246 | 0.265 | 0.259 | 0.291 | 0.016 | — | 22.48 | 8.68 | 20.58 | 41.42 | 11.65 | 1.29 |
| Sampu | 0.219 | 0.229 | 0.228 | 0.274 | 0.014 | 0.011 | — | 14.45 | 27.53 | 49.75 | 35.46 | 1.51 |
| Kalema | 0.254 | 0.255 | 0.251 | 0.322 | 0.054 | 0.028 | 0.017 | — | 4.96 | 6.33 | 6.00 | 1.47 |
| Lengongu | 0.251 | 0.264 | 0.274 | 0.306 | 0.002 | 0.012 | 0.009 | 0.048 | — | 62.25 | 41.42 | 1.15 |
| Lengobei | 0.222 | 0.237 | 0.237 | 0.274 | 0.007 | 0.006 | 0.005 | 0.038 | 0.004 | — | 41.42 | 1.46 |
| Mukinyo | 0.239 | 0.242 | 0.256 | 0.292 | 0.003 | 0.021 | 0.007 | 0.040 | 0.006 | 0.006 | — | 1.30 |
| Serengeti | 0.110 | 0.110 | 0.095 | 0.190 | 0.172 | 0.162 | 0.142 | 0.145 | 0.179 | 0.146 | 0.161 | — |
Table 5.
AMOVA with a nested design of allele frequencies in G. pallidipes from Lambwe and Nguruman regions.
| Source | d.f. | Variance | Percentage of variation | F-statistics |
|---|---|---|---|---|
| Lambwe | ||||
| Among blocks | 2 | 0.05606 | 2.25 | FGT = 0.023 |
| Among sites (blocks) | 11 | 0.07189 | 2.89 | FSG = 0.030*** |
| Within sites | 1044 | 2.36100 | 94.86 | FST = 0.051*** |
| Lambwe and Kodera | ||||
| Between groups | 1 | 0.34074 | 12.17 | FGT = 0.122*** |
| Among sites (groups) | 12 | 0.10947 | 3.91 | FSG = 0.044*** |
| Within sites | 1091 | 2.35063 | 83.93 | FST = 0.161*** |
| Total | 1105 | 2.80084 | ||
| Nguruman | ||||
| Among blocks | 6 | −0.00102 | −0.04 | FGT = 0.000 |
| Among sites (blocks) | 20 | 0.09334 | 3.86 | FSG = 0.039*** |
| Within sites | 1547 | 2.32477 | 96.18 | FST = 0.038*** |
| Nguruman and Serengeti | ||||
| Between groups | 1 | 0.40854 | 14.30 | FGT = 0.143*** |
| Among sites (groups) | 26 | 0.09194 | 3.22 | FSG = 0.038* |
| Within sites | 1642 | 2.35583 | 82.48 | FST = 0.175*** |
| Total | 1669 | 2.85631 | ||
| Lambwe and Nguruman | ||||
| Among regions | 1 | 0.72467 | 22.86 | FRT = 0.262*** |
| Among sites (regions) | 40 | 0.10514 | 3.32 | FSR = 0.043*** |
| Within sites | 2638 | 2.33972 | 73.82 | FST = 0.229*** |
| Total | 2679 | 3.16953 | ||
P < 0.04,
P < 0.0001
AMOVAs showed that most variation (≥ 94.9%) was contained within trap sites (Table 5). Approximately 3 - 4% of the variance lay among sites within blocks and ≤ 1 - 2.3% of the variation was attributed to differences among blocks. When alleles were pooled by region, 22.9% of the variance in allele frequencies lay between Lambwe and Nguruman, whereas 73.8% was within blocks. Only 3.3% of the variance was attributed to blocks within regions. The corresponding F-statistics showed significant differentiation between Lambwe and the Nguruman regions (FRT = 0.262, P < 0.0001; Table 5). In this case, FRT estimates the chance that two randomly chosen alleles in a region are identical by descent relative to the pooled total. Differentiation among blocks within regions was significantly different from zero (FSR = 0.043, P < 0.0001).
Nei’s hierarchical partition of microsatellite diversity is presented in Table 6. Unshared diversity between blocks (DBT) in Lambwe and Kodera was 0.39, and diversity of sites within blocks, DSB = 0.59. The corresponding differentiation between blocks, GBT = 0.25, and differentiation among sites within blocks, GSB = 0.37. The greater differentiation among sites within than among blocks may indicate lack of hierarchical genetic structure within Lambwe or a sampling artifact. When Kodera was excluded from the analysis differentiation between blocks became 0.05 and that among sites within blocks became 0.10. Total diversity HT for Nguruman and Serengeti was 0.85 ± 0.05, most of it being within sites (HS = 0.77). Unshared diversity between blocks (DBT = 0.06) was twice as great as that among sites within blocks (HSB = 0.03). Differentiation between blocks (GBT = 0.07) was much greater than among sites within blocks (GSB = 0.02). These values translate into exchange of 3.4 and 11.8 reproducing individuals per generation, between blocks and among sites, respectively. To verify the influence of Serengeti on the overall diversity and differentiation, analysis was performed without Serengeti. Unshared diversity and differentiation between blocks became 0.03 and 0.04, respectively (Table 6).
Table 6.
Hierarchical microsatellite diversities ± SE within and among G. pallidipes populations (Nei 1987)
| Lambwe & Kodera | Lambwe | |
|---|---|---|
| Diversity | ||
| Within sites HS | 0.59 ± 0.03 | 0.59 ± 0.04 |
| Sites (blocks) DSB | 0.59 ± 0.01 | 0.02 ± 0.00 |
| Between blocks DBT | 0.39 ± 0.03 | 0.05 ± 0.00 |
| Total HT | 1.57 ± 0.15 | 0.66 ± 0.43 |
| Genetic differentiation | ||
| Sites (blocks) GSB | 0.37 ± 0.06 | 0.03 ± 0.00 |
| Between blocks GBT | 0.25 ± 0.02 | 0.07 ± 0.00 |
| Gene flow rate | ||
| Sites (blocks) | 0.4 | 8.5 |
| Between blocks | 0.8 | 3.2 |
| Nguruman & Serengeti | Nguruman | |
| Diversity | ||
| Within sites HS | 0.77 ± 0.03 | 0.77 ± 0.03 |
| Sites (blocks) DSB | 0.02 ± 0.00 | 0.02 ± 0.00 |
| Between blocks DBT | 0.06 ± 0.00 | 0.03 ± 0.00 |
| Total HT | 0.85 ± 0.05 | 0.82 ± 0.05 |
| Genetic differentiation | ||
| Sites (blocks) GSB | 0.02 ± 0.00 | 0.02 ± 0.00 |
| Between blocks GBT | 0.07 ± 0.00 | 0.04 ± 0.00 |
| Gene flow rate | ||
| Sites (blocks) | 11.8 | 9.9 |
| Between blocks | 3.4 | 6.5 |
Seasonal variation in allele frequencies
No significant seasonal differences were detected in allelic or genotypic diversities. Dry season populations were more differentiated genetically than wet season populations, but not significantly so. No substantial genetic subdivision was found among collection dates. Only <1% and 1.6% of the total variance was attributed to differences in allele frequencies among seasons and sampling dates, respectively (data not shown).
Estimates of effective population sizes
Estimates for Lambwe varied from 102 to 522 reproducing flies (Table 7). Harmonic mean population sizes from Nguruman varied from 150 to 1026. Ne estimates in Nguruman were about twice as large as those in Lambwe.
Table 7.
Effective population sizes estimated by temporal change in allele frequencies
| No. of generations | Variance (Fk) | Ne | 95% C.I. | |
|---|---|---|---|---|
| Nguruman | ||||
| May 2000 – Nov 2001 | 12 | 0.180 | 333 | 192 – 597 |
| May 2000 – May 2003 | 24 | 0.289 | 415 | 246 – 686 |
| May 2000 – July 2003 | 26 | 0.192 | 679 | 393 – 1190 |
| May 2000 – Dec 2003 | 29 | 0.142 | 1026 | 572 – 1871 |
| Nov 2001 – Jan 2003 | 14 | 0.283 | 247 | 150 - 401 |
| Nov 2001 – Dec 2003 | 17 | 0.341 | 250 | 157 - 382 |
| Lambwe | ||||
| June 2000 – Dec 2002 | 20 | 0.496 | 202 | 122 – 328 |
| Jun 2000 – Dec 2003 | 28 | 0.268 | 522 | 302 – 931 |
| Dec 2002 – Dec 2003 | 8 | 0.391 | 102 | 62 - 168 |
Discussion
Allelic frequency distribution and genetic diversity
Microsatellite allelic frequencies were homogenous among sites within blocks in Lambwe and Nguruman. However, allele frequencies differed significantly among blocks, indicating that gene flow was insufficient to neutralize genetic drift.
Hardy-Weinberg Equilibrium
Thirteen of 64 possible Ruma tests and twenty-eight of 162 possible site-locus combinations in Nguruman showed deviation from HWE. All deviations were due to heterozygote deficits leading to positive FIS values. Heterozygote deficiencies can, in principle, be attributed to non-random matings. Much more likely, however, the heterozygote deficits were caused by null alleles. Null alleles occur due to mutations at primer annealing sites and are a common problem with microsatellites (Lehmann et al., 1996; Krafsur & Endsley, 2002).
Genetic differentiation and gene flow
In Lambwe, we found no evidence of genetic differentiation among sites within blocks. There was, however, significant differentiation among blocks. The same genetic pattern was detected in Nguruman. FSTs among sites in Lambwe and the Nguruman were 0.048 and 0.038, respectively. It seems, therefore, that tsetse tend to remain close to their neighbourhoods even when such neighbourhoods are within a kilometer or two of each other. There may be adaptive significance to ‘staying at home’ viz. conservation of water and energy reserves, that is, if mammalian hosts shelter in the same thickets.
It might be expected that a tendency to remain near a ‘home’ thicket would be stronger during dry seasons than wet seasons, but a statistically significant effect of season was not detected even though dry season FSTs were greater than wet season indices. Analysis of Nguruman trap catches indicated a high degree of spatial aggregation and substructure (Odulaja et al., 2001).
Lambwe and Kodera flies were highly differentiated (FST ≥ 0.150) suggesting a low rate of gene flow between the two populations, equivalent to 1.2 or fewer reproducing flies every generation. This can be attributed to land-use changes. Most likely Lambwe and Kodera were previously part of a contiguous fly-belt, but became separated by habitat fragmentation caused by agriculture. Indeed, a recent land-use study in Lambwe showed a three-fold increase in cultivation over the last 50 years, and a significant decrease in woody vegetation cover and grasslands (Muriuki et al., 2005). The foregoing authors concluded that land-use changes were encouraged by numerous tsetse control programmes that caused a decline in tsetse populations and a great diminution of sleeping sickness from the valley. Tsetse populations in fragmented habitats are expected to become divergent due to founder effects, genetic drift, and reduced gene flow (Templeton et al., 1990).
Serengeti flies were significantly different from Nguruman flies (FST ≥ 0.158), which predicts an exchange rate of ~ 1.3 reproducing flies per generation. Published literature suggests that G. pallidipes are highly invasive and re-invade Nguruman every year from the neighboring Tanzania escarpment (Dransfield et al., 1990; Williams et al., 1992; Brightwell et al., 1997). Indeed, it was estimated that about 100,000 females per month invaded Nguruman during the long rains and 5,000 monthly in the short rains, to which may be added a further 500 females monthly during the dry seasons (Brightwell et al., 1997). If this were so, we should expect allele frequencies to be statistically homogeneous between Serengeti and Nguruman if we can assume that Serengeti is the nearest fly belt to Nguruman. Our data indicate, however, that genetic drift between Serengeti and Nguruman is very much stronger than gene flow.
At the macro level, little gene flow can be inferred between Lambwe and Nguruman: Lambwe and Nguruman are separated by highlands that are too cold for tsetse survival. Tsetse flies do not inhabit highland or grassland areas where woody vegetation is lacking (Glasgow, 1963). A shared gene pool may be explained by common ancestry and a tenuous gene flow presumably via a stepping stone model.
Effective population sizes
Effective population size is the harmonic mean number of reproducing individuals in an ideal population that shows the same allele frequencies as the sampled populations. Lambwe estimates of Ne in G. pallidipes were less than those in Nguruman for which we offer two reasons. Although tsetse control operations were undertaken in both areas, they were more intense in Lambwe, leading to claims of near eradication (Opiyo et al., 1990). Moreover, G. pallidipes in Lambwe occupy a smaller and more isolated geographic habitat than Nguruman. In Lambwe, flies are mostly restricted to the Ruma National Park where bushbuck, bush-pig and buffalo inhabiting the park provide blood meals (Turner, 1986). On the other hand, Nguruman is a larger habitat than the Ruma at least by a factor of two.
To conclude, the genetic data suggest that G. pallidipes in Lambwe and Nguruman are geographically isolated from known nearby population centres leading to strong measures of genetic differentiation. Large effective population sizes and high genetic diversities also support the contention that G. pallidipes have long standing endemicities in Lambwe and Nguruman. The locations support plentiful game (Turner, 1986; Tarimo-Nesbitt et al., 1999) and dense thickets of vegetation that provide refugia during hot, dry intervals in which, we suggest, both tsetse and their hosts can survive virtually undetected by normal sampling procedures.
Acknowledgments
We thank Messrs. Paul Thandi and Jacob Lukango for their excellent assistance with sampling. Thanks to Dr. Japheth Kiragu, for help in identifying sampling locations and with logistics and Dr. J.M. Ndung’u, for allowing us to use KETRI facilities. Serengeti samples were provided by Dr. I. Malele of Tsetse and Trypanosomiasis Research Institute, Tanzania. This work was funded by grant AI 52456 from the USPHS NIH to ESK, and an International Atomic Energy Agency Fellowship to JOO.
References
- Baker MD, Krafsur ES. Identification and properties of microsatellite markers in tsetse flies Glossina morsitans sensu lato (Diptera: Glossinidae) Molecular Ecology Notes. 2001;1:234–236. doi: 10.1046/j.1471-8278.2001.00087.x. [DOI] [PMC free article] [PubMed] [Google Scholar]
- Balloux F, Brunner H, Lugon-Moulin N, Hausser J, Goudet J. Microsatellites can be misleading: an empirical and simulation study. Evolution. 2000;54:1414–1422. doi: 10.1111/j.0014-3820.2000.tb00573.x. [DOI] [PubMed] [Google Scholar]
- Baylis M, Nambiro CO. The effect of cattle infection by Trypanosoma congolense on attraction, and feeding success, of the tsetse fly Glossina pallidipes. Parasitology. 1993;106:357–361. doi: 10.1017/s0031182000067093. [DOI] [PubMed] [Google Scholar]
- Boyce TM, Zwick ME, Aquadro CF. Mitochondrial DNA in bark weevils: size, structure, and heteroplasmy. Genetics. 1989;123:825–836. doi: 10.1093/genetics/123.4.825. [DOI] [PMC free article] [PubMed] [Google Scholar]
- Brightwell R, Dransfield RD, Williams BG. Factors affecting seasonal dispersal of the tsetse flies, Glossina pallidipes and G. longipennis (Diptera: Glossinidae) at Nguruman, south-west Kenya. Bulletin of Entomological Research. 1992;82:167–182. [PubMed] [Google Scholar]
- Brightwell R, Dransfield RD, Stevenson P, Williams BG. Changes over twelve years in populations of Glossina pallidipes and Glossina longipennis (Diptera: Glossinidae) subject to varying trapping pressure at Nguruman, south-west Kenya. Bulletin of Entomological Research. 1997;87:349–370. [Google Scholar]
- Brightwell R, Dransfield RD, Maudlin I, Stevenson P, Shaw A. Reality vs. rhetoric – a survey and evaluation of tsetse control in East Africa. Agricultural Human Values. 2001;18:219–233. [Google Scholar]
- Challier A, Laveissière C. Un nouveau piège pour la capture des glossines (Glossina: Diptera, Muscidae): description et essais sur le terrain. [A new trap for catching glossina (Glossina: Diptera, Muscidae): description and field trials. ] Cahiers d’ORSTOM, entomologie médicale et parasitologie. 1973;11:251–262. [Google Scholar]
- Dransfield RD, Brightwell R, Kyorku C, Williams B. Control of tsetse fly (Diptera: Glossinidae) populations using traps at Nguruman, south-west Kenya. Bulletin of Entomological Research. 1990;80:265–276. [Google Scholar]
- Dransfield RD, Brightwell R. Trap efficiency for Glossina pallidipes (Diptera: Glossinidae) at Nguruman, south-west Kenya. Bulletin of Entomological Research. 2001;91:429–444. [PubMed] [Google Scholar]
- Estoup A, Tailliez C, Cornuet JM, Solignac M. Size homoplasy and mutational processes of interrupted microsatellites in two bee species, Apis mellifera and Bombus terrestris (Apidae) Molecular Biology and Evolution. 1995;12:1074–1084. doi: 10.1093/oxfordjournals.molbev.a040282. [DOI] [PubMed] [Google Scholar]
- Excoffier L, Smouse PE, Quattro JM. Analysis of molecular variance inferred from metric distances among DNA haplotypes: application to human mitochondrial DNA restriction data. Genetics. 1992;131:479–491. doi: 10.1093/genetics/131.2.479. [DOI] [PMC free article] [PubMed] [Google Scholar]
- Glasgow, J.P. (1963) The Distribution and Abundance of Tsetse. Pergamon Press. Oxford.
- Goudet J. Fstat, Version 1.2: a computer program to calculate F statistics. Journal of Heredity. 1995;86:485–486. [Google Scholar]
- Goudet, J. (2001) FSTAT, a Program to Estimate and Test Gene Diversities and Fixation Indices Version 2.9.3. http://www.unil.ch/izea/softwares/fstat.html Updated from Goudet (1995)
- Groenendijk, et al. A survey of the distribution of Glossina pallidipes Austen around the Lambwe Valley, South Nyanza District, Kenya. Insect Science and its Application. 1993;14:225–228. [Google Scholar]
- Guo SW, Thompson EA. Performing the exact test of Hardy-Weinberg proportion for multiple alleles. Biometrics. 1992;48:361–372. [PubMed] [Google Scholar]
- Hedrick PW. Highly variable loci and their interpretation in evolution and conservation. Evolution. 1999;53:313–318. doi: 10.1111/j.1558-5646.1999.tb03767.x. [DOI] [PubMed] [Google Scholar]
- Holm S. A simple sequentially rejective multiple test procedure. Scandinavian Journal of Statistics. 1979;6:65–70. [Google Scholar]
- Krafsur ES, Griffiths N, Brockhouse CL, Brady J. Breeding structure of Glossina pallidipes (Diptera: Glossinidae) populations in East and southern Africa. Bulletin of Entomological Research. 1997;87:67–73. [Google Scholar]
- Krafsur ES, Wohlford DL. Breeding structure of Glossina pallidipes populations evaluated by mitochondrial variation. Journal of Heredity. 1999;90:635–642. doi: 10.1093/jhered/90.6.635. [DOI] [PubMed] [Google Scholar]
- Krafsur ES. Population structure of the tsetse fly Glossina pallidipes estimated by allozyme, microsatellite and mitochondrial diversities. Insect Molecular Biology. 2002a;11:37–45. doi: 10.1046/j.0962-1075.2001.00307.x. [DOI] [PMC free article] [PubMed] [Google Scholar]
- Krafsur ES. Genetic diversity and gene flow in morsitans group tsetse flies. Tsetse Trypanosomiasis Information Quarterly. 2002b;25:141–146. [PMC free article] [PubMed] [Google Scholar]
- Krafsur ES. Tsetse fly population genetics: an indirect approach to dispersal. Trends in Parasitology. 2003;19:162–166. doi: 10.1016/s1471-4922(03)00034-5. [DOI] [PubMed] [Google Scholar]
- Krafsur ES, Endsley MA. Microsatellite diversities and gene flow in the tsetse fly, Glossina morsitans s.l. Medical and Veterinary Entomology. 2002;16:292–300. doi: 10.1046/j.1365-2915.2002.00378.x. [DOI] [PMC free article] [PubMed] [Google Scholar]
- Lehmann T, Hawley WA, Collins FH. An evaluation of constraints on microsatellite loci using null alleles. Genetics. 1996;144:1155–1163. doi: 10.1093/genetics/144.3.1155. [DOI] [PMC free article] [PubMed] [Google Scholar]
- Mopper, S., Strauss, S., 1998. Genetic structure and local adaptation in natural insect populations: effects of ecology, life history, and behavior. Chapman & Hall, New York, NY, USA.
- Muriuki GW, Njoka TJ, Reid RS, Nyariki DM. Tsetse control and land-use change in Lambwe Valley, south-western Kenya. Agriculture, Ecosystems And Environment. 2005;106:99–107. [Google Scholar]
- Mwangi EK, Stevenson P, Gettinby G, Reid SWJ, Murray M. Susceptibility to trypanosomosis of three Bos indicus cattle breeds in areas of differing tsetse fly challenge. Veterinary Parasitology. 1998;79:1–17. doi: 10.1016/s0304-4017(98)00147-2. [DOI] [PubMed] [Google Scholar]
- Nagylaki T. Fixation indices in subdivided populations. Genetics. 1998;148:1325–1332. doi: 10.1093/genetics/148.3.1325. [DOI] [PMC free article] [PubMed] [Google Scholar]
- Nei, M. (1987) Molecular evolutionary genetics. New York: Columbia University Press.
- Odulaja A, Baumgärtner J, Mihok S, Abu-zinid IM. Spatial and temporal distribution of tsetse fly trap catches at Nguruman, southwest Kenya. Bulletin of Entomological Research. 2001;91:213–220. [PubMed] [Google Scholar]
- Opiyo EA, Njogu AR, Omuse JK. Use of insecticide impregnated targets for control of Glossina pallidipes in Kenya. Insect Science and its Application. 1990;11:417–425. [Google Scholar]
- Ouma JO, Cummings MA, Jones KC, Krafsur ES. Characterization of microsatellite markers in the tsetse fly, Glossina pallidipes (Diptera: Glossinidae) Molecular Ecology Notes. 2003;3:450–453. doi: 10.1046/j.1471-8286.2003.00480.x. [DOI] [PMC free article] [PubMed] [Google Scholar]
- Ouma, J.O., Marquez, J.G. & Krafsur, E.S. (2005) Macrogeographic population structure and genetic diversity in Glossina pallidipes. Bulletin of Entomological Research (In press). [DOI] [PMC free article] [PubMed]
- Peel, D., Ovenden, J.R. & Peel, S.L. (2004) NeEstimator: software for estimating effective population size, Version 1.3. Queensland Government, Department of Primary Industries and Fisheries.
- Pollak E. A new method for estimating the effective population size from allele frequency changes. Genetics. 1983;104:531–548. doi: 10.1093/genetics/104.3.531. [DOI] [PMC free article] [PubMed] [Google Scholar]
- Queller DC, Strassmann JE, Hughes CR. Microsatellites and kinship. Trends in Ecology and Evolution. 1993;8:285–288. doi: 10.1016/0169-5347(93)90256-O. [DOI] [PubMed] [Google Scholar]
- Raymond M, Rousset F. GENEPOP version 1.2, a population genetic software for exact tests and ecumenicism. Journal of Heredity. 1995a;86:248–249. [Google Scholar]
- Raymond M, Rousset F. An exact test for population differentiation. Evolution. 1995b;49:1280–1283. doi: 10.1111/j.1558-5646.1995.tb04456.x. [DOI] [PubMed] [Google Scholar]
- Rice WR. Analyzing tables of statistical tests. Evolution. 1989;43:223–225. doi: 10.1111/j.1558-5646.1989.tb04220.x. [DOI] [PubMed] [Google Scholar]
- Rogers DJ. Study of a natural population of tsetse flies and a model for fly movement. Journal of Animal Ecology. 1977;46:309–330. [Google Scholar]
- Rousset F. Genetic differentiation and estimation of gene flow from F-statistics under isolation by distance. Genetics. 1997;145:11219–1228. doi: 10.1093/genetics/145.4.1219. [DOI] [PMC free article] [PubMed] [Google Scholar]
- SAS (2001). SAS Language Reference, Version 8.2. SAS Institute Inc, Cary, North Carolina.
- Schneider, S., Roessli, D. & Excoffier, L. (2000). Arlequin: a software for population genetics data analysis, version 2.000. Geneva, Switzerland: Genetics and Biometry Lab, University of Geneva.
- Shahjahan RM, Hughes KJ, Leopold RA, DeVault JD. Lower incubation temperature increases yield of insect genomic DNA isolated by CTAB method. Biotechniques. 1995;19:333–334. [PubMed] [Google Scholar]
- Slatkin M. Isolation by distance in equilibrium and non-equilibrium populations. Evolution. 1993;47:264–279. doi: 10.1111/j.1558-5646.1993.tb01215.x. [DOI] [PubMed] [Google Scholar]
- Slatkin M, Barton NH. A comparison of three indirect methods for estimating average levels of gene flow. Evolution. 1989;43:1349–1368. doi: 10.1111/j.1558-5646.1989.tb02587.x. [DOI] [PubMed] [Google Scholar]
- Tarimo-Nesbitt RA, Golder TK, Dransfield RD, Chaudhury MF, Brightwell R. Trypanosome infection rate in cattle at Nguruman, Kenya. Veterinary Parasitology. 1999;81:107–117. doi: 10.1016/s0304-4017(98)00194-0. [DOI] [PubMed] [Google Scholar]
- Templeton AR, Shaw K, Routman E, Davis SK. The genetic consequences of habitat fragmentation. Annals of the Missouri Botanical Garden. 1990;77:13–27. [Google Scholar]
- Turner DA. The colonization by the tsetse, Glossina pallidipes Austen, of a unique habitat—exotic coniferous plantation—with special reference to the Lambwe Valley, Kenya. Insect Science and its Application. 1981;1:243–248. [Google Scholar]
- Turner DA. A preliminary assessment of some immediate and long-term effects of aerial spraying of endosulfan on Glossina pallidipes (Austen) in the Lambwe Valley, Kenya. Insect Science and its Application. 1984;5:425–429. [Google Scholar]
- Turner DA. Tsetse and trypanosomiasis in the Lambwe Valley, Kenya. Transactions of the Royal Society of Tropical Medicine and Hygiene. 1986;80:592–95. doi: 10.1016/0035-9203(86)90152-5. [DOI] [PubMed] [Google Scholar]
- Turner DA, Brightwell R. An evaluation of a sequential aerial spraying operation against Glossina pallidipes Austen (Diptera: Glossinidae) in the Lambwe Valley of Kenya: Aspects of the post-spray recovery and evidence of natural population regulation. Bulletin of Entomological Research. 1986;76:331–349. [Google Scholar]
- Vale GA, Harshey BS, Hargrove JW. The use of small plots to study populations of tsetse (Diptera: Glossinidae) Insect Science and its Application. 1984;5:403–410. [Google Scholar]
- Waples RS. A generalized approach for estimating effective population size from temporal changes in allele frequency. Genetics. 1989;121:379–391. doi: 10.1093/genetics/121.2.379. [DOI] [PMC free article] [PubMed] [Google Scholar]
- Weir BS, Cockerham CC. Estimating F-statistics for the analysis of population structure. Evolution. 1984;38:1358–1370. doi: 10.1111/j.1558-5646.1984.tb05657.x. [DOI] [PubMed] [Google Scholar]
- Weir, B.S. (1996) Genetic data analysis II. Methods for Discrete Population Genetic Data Sinauer Associates, Sunderland, Massachussetts.
- Wellde BT. Trypanosomiasis in the Lambwe Valley, Kenya. Annals of Tropical Medicine and Parasitology. 1989;83 (Suppl):1–220. [PubMed] [Google Scholar]
- Williams B, Dransfield R, Brightwell R. The control of tsetse flies in relation to fly movement and trapping efficiency. Journal of Applied Ecology. 1992;29:163–179. [Google Scholar]
- Workman PL, Niswander JD. Population studies on southwestern Indian tribes. 2. Local genetic differentiation in the Papago. American Journal of Human Genetics. 1970;22:24–49. [PMC free article] [PubMed] [Google Scholar]
- Wright S. Evolution in Mendelian populations. Genetics. 1931;16:97–159. doi: 10.1093/genetics/16.2.97. [DOI] [PMC free article] [PubMed] [Google Scholar]
- Wright S. Isolation by distance. Genetics. 1943;28:114–138. doi: 10.1093/genetics/28.2.114. [DOI] [PMC free article] [PubMed] [Google Scholar]
- Wright S. The genetic structure of populations. Annals of Eugenics. 1951;15:323–354. doi: 10.1111/j.1469-1809.1949.tb02451.x. [DOI] [PubMed] [Google Scholar]
- Wright, S. (1969) Evolution and the genetics of populations, Vol. 2. The theory of gene frequencies. Chicago, University of Chicago Press.