

Abstract
We present a novel composite-likelihood-ratio test (CLRT) for detecting genes and genomic regions that are subject to recurrent natural selection (either positive or negative). The method uses the likelihood functions of Hartl et al. (1994) for inference in a Wright-Fisher genic selection model and corrects for nonindependence among sites by application of coalescent simulations with recombination. Here, we (1) characterize the distribution of the CLRT statistic (Λ) as a function of the population recombination rate (R = 4Ner); (2) explore the effects of bias in estimation of R on the size (type I error) of the CLRT; (3) explore the robustness of the model to population growth, bottlenecks, and migration; (4) explore the power of the CLRT under varying levels of mutation, selection, and recombination; (5) explore the discriminatory power of the test in distinguishing negative selection from population growth; and (6) evaluate the performance of maximum composite-likelihood estimation (MCLE) of the selection coefficient. We find that the test has excellent power to detect weak negative selection and moderate power to detect positive selection. Moreover, the test is quite robust to bias in the estimate of local recombination rate, but not to certain demographic scenarios such as population growth or a recent bottleneck. Last, we demonstrate that the MCLE of the selection parameter has little bias for weak negative selection and has downward bias for positively selected mutations.
THE evolutionary fate of a mutation is governed by genetic drift, demographic history, and natural selection acting directly on the mutation or indirectly through the effect of mutations at linked loci. A central goal of population genetics is to quantify the role of each of these factors in the evolution of particular loci in particular populations (Lewontin 1974). The Poisson random field (PRF) approach (Sawyer and Hartl 1992; Hartl et al. 1994; Wakeley 2003; Williamson 2003, Williamson et al. 2005) has proven quite useful in estimating mutation and selection parameters in various population genetics settings when DNA mutations are unlinked. The inference rationale behind the approach is that natural selection will alter the site-frequency spectrum [SFS; i.e., the number of mutations at a frequency 1 out of n, 2 out of n, … (n − 1) out of n, where n is the number of sequences sampled], making it possible to estimate the strength of selection needed to explain observed deviations from the neutral SFS expectations. A likelihood-ratio test (LRT) derived from the PRF has shown to be quite powerful and maximum-likelihood estimation of mutation and selection parameters performs very well when the ancestral states of all mutations in the sample are known (Bustamante et al. 2001). The PRF approach also has the advantage of using all of the information in the SFS regarding natural selection as opposed to traditional summary statistics of the data such as Tajima's (1989) D and the methods of Fay and Wu (2000) and Fu and Li (1993).
Unfortunately, since the PRF model assumes independence among sites, the application of the LRT for most genetic data is quite limited unless the assumption of free recombination among sites can somehow be relaxed. One can imagine two potential solutions to the problem: (a) explicitly modeling natural selection and recombination to evaluate the true likelihood function via the ancestral selection graph (Krone and Neuhauser 1997; Neuhauser and Krone 1997; Slade 2001), and (b) taking a “composite-likelihood” approach by continuing to treat sites as independent and then correcting parameter estimates and critical values for the LRT via simulation. From a statistical point of view, the former approach is more desirable, since the likelihood function contains all the information about natural selection available in the data (e.g., distribution of haplotypes, patterns of linkage disequilibrium). Unfortunately, full-likelihood inference is so computationally costly as to be out of reach for practical sample sizes at single loci and certainly out of reach for genome-wide analyses. Composite likelihood has recently been used in population genetics to reduce the computational complexity of various inference problems, for example, estimating recombination rate (Hudson 2001; Fearnhead and Donnelly 2002; McVean et al. 2002; Wall 2004), variation in recombination rate (Li and Stephens 2003; McVean et al. 2004), and detecting local signature of hitchhiking (Kim and Stephan 2002; Kim and Nielsen 2004; Innan and Kim 2004). Therefore, due to practical motivations, the latter approach is investigated here, since the composite-likelihood solution for a single locus can easily scale to genome-wide levels and can be expanded to include increasingly realistic demographic scenarios.
In this article, we set out to investigate the performance of a composite-likelihood-ratio test for recurrent directional selection under varying levels of selection, mutation, and recombination while relaxing the assumption of independence among sites. The initial motivation for this project was Bustamante et al.'s (2001) result that the LRT proposed by Hartl et al. (1994) is not robust to deviations from the assumption of independence among sites (i.e., the test has a much higher type I error than expected). The basic idea behind our new test is that by modifying the critical value of the LRT statistics a proper test is constructed with desired size (type I error, α). Specifically, one can correct the critical value of the LRT statistic by applying Hartl et al.'s (1994) test to a large number of simulated replicate neutral data sets generated conditional on S, the observed number of segregating sites in the original data, and R̂, an estimate of the population recombination rate, and choosing a cutoff such that α of the simulations are below the critical value (Table 1). We refer to this test as the composite-likelihood-ratio test (CLRT) to distinguish it from the LRT designed for independent data and to signify that we are not dealing with the true likelihood function of the data under recombination and selection, but rather an approximate likelihood function. If the data come from a population with the same demography we have used for our neutral simulations (e.g., a panmictic population of constant size) and our estimate of the recombination rate is accurate, such a test would be guaranteed not to reject neutrality more often then expected (namely, 100 × α% of the time).
TABLE 1 .
Notations used
| Ne | Effective population size |
|---|---|
| r | Per-locus recombination rate per generation; R = 4Ner |
| μ | Per-locus mutation rate per generation; θ = 4Neμ |
| s | Relative fitness of the mutant; γ = 2Nes |
| m | Migration rate (proportion of migrants in the subpopulation per generation); M = 4Nem |
| D | No. of demes |
| β | Population growth rate |
| n | No. of sequences sampled |
| S | Total no. of segregating sites in the sampled sequences |
| Q | No. of replicates in the simulation study |
| Rh | Recombination rate estimator from Hudson (1987) |
| Rhw | Recombination rate estimator from Hey and Wakeley (1997) |
| Λ | Test statistic of the CLRT |
| Λ* | 95% critical value of the CLRT |
| tbs | Time in the unit of 4Ne generations ago that the bottleneck happens |
| tbe | Time in the unit of 4Ne generations ago that the population recovers from the bottleneck |
| f | Ratio of the population size during bottleneck to the original size |
A potential pitfall of all “tests of neutrality” is that there are several putative alternative hypotheses to the single null hypothesis of a neutrally evolving panmictic population of constant size. In other words, certain demographic scenarios affect the site-frequency spectrum in ways that may be indistinguishable from natural selection, leading to spurious rejection of the null hypothesis of neutral evolution. For example, low levels of migration among subpopulations will elevate the proportion of observed high-frequency-derived mutations above their neutral expectation in a panmictic population much in the same way as positive selection (Nielsen 2001; see also Figure 1). Likewise, a sample of DNA sequences drawn from an exponentially growing population can look like a sample drawn from a population of constant size subject to weak negative selection (i.e., both scenarios lead to an excess of low-frequency variants vis-à-vis neutrality). Therefore, it is imperative to investigate the robustness of our proposed CLRT to demographic history and population structure. This can be accomplished via standard coalescent simulations with recombination (Hudson 2002). In this article we consider a wide range of demographic scenarios, including exponential population growth, an island model of migration, and bottlenecks of varying severity. Likewise, it is important to explore the power of the CLRT (the probability of rejecting the null hypothesis when it is false) as well as the bias of the maximum composite-likelihood estimates (MCLE) of mutation rates and strength of selection. We use a forward simulation program with recombination and selection to address these last two issues. We also investigate the discriminatory power of the CLRT to detect weak negative selection when the null model is exponential growth instead of a panmictic population of constant size.
Figure 1.—

Comparison of expected site-frequency spectra for three scenarios. “Neutral” is the expected SFS under the standard neutral model (see Hudson 1990). “Population structure” is the expected site-frequency spectrum for neutral mutations in a two-deme model with low symmetric migration rate (4Nm = 0.2) found via 1000 coalescent simulations using ms (Hudson 2002). “Selection” is the expected SFS under genic selection for the model described by Hartl et al. (1994). We use a value of 2Ns = 1.353, which maximizes the likelihood of the expected population structure data under the selected model. As one can see, the site-frequency spectrum under population structure can look similar to that under recurrent positive selection.
MATERIALS AND METHODS
Theory
To model the effects of natural selection on the site-frequency spectrum, several assumptions are made within the standard PRF models (Sawyer and Hartl 1992; Hartl et al. 1994): (a) panmictic population of constant size, (b) weak selection with no dominance, (c) equal selective effects of all nonlethal mutations, (d) free recombination among segregating sites, (e) infinite-sites mutation model, and (f) no epistatic effect among mutations. Wakeley (2003) has developed models that relax assumption (a) by considering an infinite-demes population structure; Williamson et al. (2004) have developed PRF models with dominance, relaxing assumption (b); and Bustamante et al. (2003) and Sawyer et al. (2003) have modeled the effects of a distribution of selective effects among nonlethal mutations [relaxing assumption (c)]. The purpose of this article is to relax assumption d for the purpose of inference.
Let X = {X1, X2, … , Xn−1} represent the site-frequency spectrum for a genomic region of interest such that Xk is the number of sites along the sequence that have k derived mutations and n − k ancestral mutations, where n is the number of sampled sequences (throughout we assume the directionality of mutation is known). In their original article, Sawyer and Hartl (1992) model the site-frequency spectrum as a collection of independent Poisson-distributed random variables, governed by the mutation parameter θ = 4Neμ and a selection parameter γ = 2Nes, where Ne is the haploid population size; s is the fitness effect of new mutations such that wild-type fitness is 1, heterozygote fitness is 1 + s, and homozygote fitness for the new mutation is 1 + 2s; and μ is the per locus mutation rate for mutations with selective effect s. It is important to note that the site-frequency spectrum of selected sites is sensitive to assumptions regarding dominance. The PRF model proposed by Williamson et al. (2004) for analyzing the site-frequency spectrum under dominance and selection is also amenable to the type of modification we propose here. For simplicity and ease of computation, we consider only the genic selection case here. When γ = 0, the population is evolving neutrally; when γ > 0, it is under positive selection; and when γ < 0, it is subject to negative selection. According to the results of Sawyer and Hartl (1992), Xk is a Poisson-distributed random variable with mean θF(k, γ), where
 |
Since under the model the Xk's are independent, the likelihood function Lθ, γ|X is the product over P(Xk = xk|θ, γ), namely
 |
1 |
Our null hypothesis is that the population evolves neutrally, H0: γ = 0, while the alternative hypothesis is the complement, Ha: γ ≠ 0. The likelihood-ratio test statistic proposed by Hartl et al. (1994) and investigated by Bustamante et al. (2001) for comparing these hypotheses is
 |
2 |
where θ̂w is the MLE of θ under the neutrality, which turns out to be Ewens' (1974) and Watterson's (1975) estimator of θ; θ̂ and γ̂ are the maximum-likelihood estimates of θ and γ, respectively, under the full model with selection, found by maximizing the profile log-likelihood function as described in Bustamante et al. (2001), and  is the observed number of segregating sites. Under the assumption of independence among sites, Λ is asymptotically χ21-distributed (Kendall 1987).
It has been shown by simulation that if sites are not evolving independently, the χ21-approximation is too liberal and the LRT will have an unacceptably high type I error (Bustamante et al. 2001). The reason for this is that the likelihood of the data in the presence of linkage is not simply the product of the likelihood across SNPs. That is, if sites are linked, Equation 1 is not the true-likelihood function of the data, but rather a composite-likelihood function, and the LRT statistic no longer corresponds to a true likelihood-ratio test, but rather to a CLRT. Under such a scenario the distribution of the test statistic is no longer χ21, but rather depends on the rate of recombination among sites. We must, therefore, use coalescent simulations with recombination to find the critical value Λ* for the test statistic whenever we wish to analyze data with linkage among SNPs. While the LRT has been shown to have excellent power and θ̂ and γ̂ have been shown to have little bias under the independence assumption (Bustamante et al. 2001), nothing is known about the statistical properties of the CLRT or the composite maximum-likelihood estimates of θ and γ. The algorithm we employ for calculating the CLRT is as follows:
Algorithm 1: Composite-likelihood-ratio test:
Given an observed site-frequency spectrum, XOBS, estimate θ̂ and γ̂ using the one-dimensional optimization described in Bustamante et al. (2001), and calculate the CLRT statistic ΛOBS via Equation 2.
Generate Q replicate data sets X1, X2, … , XQ from a standard neutral model with recombination rate R corresponding to the region of interest and S to the observed number of segregating sites in XOBS. Apply the optimization in step 1 to each of the replicate data sets and generate the replicate CLRT statistics Λ1, Λ2, … , ΛQ.
The P-value for the CLRT corresponding to data XOBS is estimated as
 , where I( ) is the indicator function that evaluates to 1 if the argument is true and 0 otherwise.
To implement our proposed composite-likelihood method, one needs an estimate of the local recombination rate. Given a data set, two main approaches have been employed for estimating R. One method is based on observing the frequency of sequence exchange between markers (Ashburner 1989; True et al. 1996; Bouffard et al. 1997; Nagaraja et al. 1997), and the other method estimates R from the patterns of sequence variation expected in a random sample of DNA sequences from a population (Hudson and Kaplan 1985; Hudson 1987, 2001; Griffiths and Marjoram 1996; Hey and Wakeley 1997; Wakeley 1997; Kuhner et al. 1999; McVean et al. 2002; Wall 2004). Since here we are interested in the local recombination rate, only the latter approach is applicable since a fine-scale estimate requires hundreds of thousands of meioses. Assuming a constant population size model and no selection, Hudson (1987) proposed a method-of-moments approach that transforms the observed variance in pairwise nucleotide differences into an estimate of the population recombination rate. Hey and Wakeley (1997) derived a method of estimating the recombination rate via coalescent theory based on considering multiple subsets of four sequences. Simulation study (Wall 2000) shows that both Hudson's (Rh) and Hey and Wakeley's estimators (Rhw) perform well with large sample size (e.g., n = 50) and improve as the mutation rate increases. However, comparing these two estimators with eight others, Wall (2000) demonstrated that Rh overestimates R (a large proportion of Rh/R > 5.0); while Rhw underestimates R (with the majority of Rhw/R < 0.2). In this article, we explore these two estimators since they represent the extreme effects of over- and underestimating the local recombination rate and are computationally very fast.
Simulations
To explore the statistical properties of the CLRT as well as the MCLE of the selection and mutation parameters, we simulated five different types of data (Hudson's 2002 “ms” program was used for all coalescent simulations). The first type of data is neutral from a population of constant size. These data were used to explore how quickly the CLRT statistic Λ converges to a χ21-distribution as a function of R and to compare the effect of different estimators of recombination rates on the realized size of the test. The second, third, and fourth types of data were neutral data from (a) a single subpopulation in an island model, (b) a panmictic population that had recently expanded in size, and (c) a panmictic population that had undergone a single bottleneck. These data were used to explore the effect of these demographic factors on the type I error of the test. The fifth type of data was generated by the forward infinite-sites simulation with selection and recombination (FISHER) program written in ANSI C by L. Zhu. FISHER was used to generate polymorphism data with recurrent selection and recombination under an infinite-sites model assuming constant population size. We ran FISHER with 10Ne generations of burn-in and replicate data sets sampled every 2Ne generations. These data were used to explore the power of the test under varying levels of mutation and selection, as well as recombination.
Robustness simulations:
To explore the null distribution of the CLRT statistic, we generated neutral data from a population of constant size for seven levels of recombination, R ∈ {0, 1, 5, 10, 50, 100, 1000}, using Hudson's (2002) ms program. For each of three sample sizes (n = 10, 50, 100), we simulated 1000 replicate data sets with a fixed number of segregation sites (S = 100) and constant recombination rate. For each replicate, we apply the CLRT and retain the test statistic Λ. The distribution of the CLRT statistic and the trend that Λ varies greatly with R are plotted in Figures 2 and 3, respectively.
Figure 2.—

Distribution of the test statistics (Λ) for the test assuming Hartl et al.'s (1994) model as a function of population recombination rate (R). The y-axis is quantiles of Λ's calculated by CLRT from sampled sequences, the x-axis is quantiles of data drawn from a χ21-distribution. Λ converges to a χ21-distribution with large R. One thousand replicates of data sets were sampled from Hudson's “ms” program, each with sample size n = 50, fixed number of segregating sites S = 100, and various levels of recombination rate.
Figure 3.—

95% critical value of the test statistic (Λ*) converges to  (plotted in log scale for both x- and y-axes). Data were drawn from Hudson's “ms” program with sample size n ∈ { 10, 50, 100} and fixed segregating sites S = 100.
In practice, the true recombination rate for sampled sequences is unknown and must be estimated from data. We were interested in investigating the effect of estimation bias in the recombination rate on the type I error of the CLRT. As Wall (2000) showed, there is no single best estimator of R and, in practice, most estimators do poorly if R is close to 0. Here we explored Hudson's (1987) and Hey and Wakeley's (1997) estimators since they tend to overestimate and underestimate R, respectively, for a broad range of values. Since Hudson's estimator has low reliability if data sets are not very large (Hudson 1987), we simulated data with sample size n = 50 and fixed segregating sites at S = 100. The detailed algorithm is as follows and the results of our analysis are summarized in Figure 4.
Figure 4.—

Effect of the bias of the recombination rate estimator on the size of the CLRT. Data were drawn from Hudson's “ms” program with sample size n = 50 and fixed segregating sites S = 100. Recombination rates were estimated by the “SITES” program (Hey and Wakeley 1997).
Algorithm 2: Estimating realized type I error of CLRT when R is estimated from data:
Generate neutral data XOBS with known recombination rate R and apply the CLRT to obtain the test statistic ΛOBS.
For XOBS estimate R by Hudson's and Hey and Wakeley's methods using SITES (Hey and Wakeley 1997) and denote the estimates Rh and Rhw.
Generate Q = 1000 replicate data sets with the same sample size and number of segregating sites as XOBS under the estimated recombination rate, Rh. For each replicate, perform CLRT and keep test statistic Λ. The empirical (1 − α) quantile of the distribution of Λ among the 1000 replicates is the critical value of the test statistic Λ* at α-level (for all simulations we used α = 0.05). Similarly, we can find Λ* with estimated recombination rate Rhw.
If ΛOBS > Λ*, reject the neutral hypothesis; otherwise, fail to reject at the α = 0.05 level.
Repeat steps 1–4 1000 times. The proportion of the false rejection is the realized size of the CLRT under the PRF model when the recombination rate is not known.
In the current model, we assume no population structure to the data. We are interested in investigating how well the CLRT performs when this assumption is violated. We simulated the second type of data with sample size n = 50 and fixed number of segregating sites (S = 100) , R = 0 under the island model for D ∈ {2, 5, 10, 20, 50} (D is the number of demes), and 0 ≤ M ≤ 15 (M = 4Nem, where m is the fraction of each deme made up of new migrants each generation). The reason for fixing the number of segregating sites is that the distribution of the number of segregating sites changes with the migration rate if we fix the overall mutation rate of the entire population (Wakeley 2001). When we explore the effect of the migration rate on the size of the test, we want to control for the effect that is caused by the difference in the number of segregating sites. The detailed procedure is as follows and the results of this analysis are shown in Figure 5.
Figure 5.—

Effect of the population structure on the size of the CLRT. Data were drawn from the island model using Hudson's “ms” program with given number of demes, D ∈ {2, 5, 10, 20, 50} with R = 0.
Algorithm 3: Procedure for estimating realized type I error of CLRT in the presence of population structure/demographic history:
Generate Q = 10,000 data sets with S segregating sites from a panmictic population of constant size. Estimate the critical value of CLRT at the α = 0.05 level as the 9501st largest value and denote this quantity as Λ*.
Sample n sequences with R = 0 from a single deme out of D possible demes in the island model with migration for a given level of M. Apply the CLRT and retain the observed test statistic, ΛOBS.
If ΛOBS > Λ*, reject the neutral hypothesis; otherwise, fail to reject at the α = 0.05 level.
Repeat steps 2 and 3 1000 times for each parameter combination. The proportion of data sets that reject neutrality (i.e., number of data sets out of 1000 with ΛOBS > Λ*) is the realized type I error of the CLRT.
Another assumption of the PRF model that may be problematic is the assumption of constant population size. To explore the effects of exponential growth [i.e., the population size is given by N(t) = Ne exp(−βt), where Ne is the present population size, t is the time before present, measured in units of 4Ne generations, and β is the growth rate], we modify step 2 of the above algorithm and generate data within ms for rates of growth β ∈ {0.1, 0.2, 0.4, 0.8, 1.6, 3.2} (Figure 6). For a bottleneck, we simulate data for n ∈ {10, 100} with various recombination rates R ∈ {0, 10, 100}, assuming the bottleneck happened at tbs = 0.025 or 0.05 (in the unit of 4Ne generations) before the current sampling time and recovered to the current population size at tbe = 0.0125 (in the unit of 4Ne generations). We consider two levels of the population reduction during the bottleneck, i.e., f ∈ {0.1, 0.01} (Figures 7 and 8).
Figure 6.—

Effect of the population size changes on the size of the CLRT. Data were drawn from the population exponentially growing model by Hudson's “ms” program with sample size n = 50, fixed segregating sites S = 100, growth rate β ∈ {0.1, 0.2, 0.4, 0.8, 1.6, 3.2}, and various levels of recombination rate.
Figure 7.—
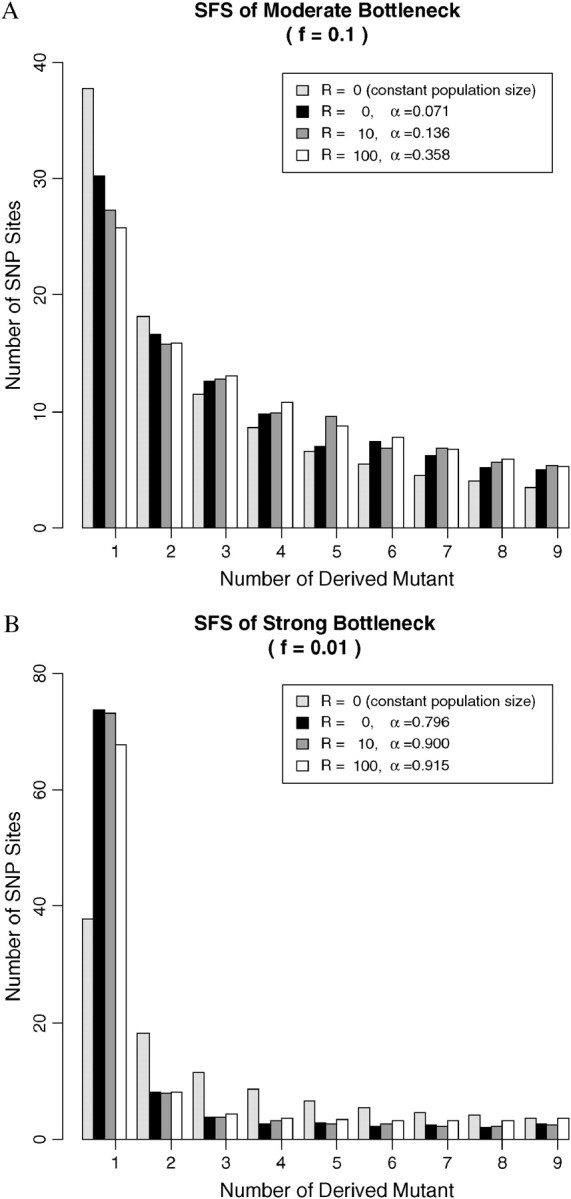
Site frequency spectrum of data from a single population having undergone a recent bottleneck. Bottleneck occurred 0.1Ne generations ago, and it lasted 0.05Ne generations. Sample size n = 10, with fixed segregating sites S = 100. f is the ratio of population size during bottleneck to the original size. α is the type I error of the CLRT. (A) Moderate bottleneck with f = 0.1; (B) strong bottleneck with f = 0.01.
Figure 8.—

Effect of recent population bottleneck on the size of the CLRT. f is the ratio of population size during bottleneck to the original size. The data sampling scheme is the same as that described in Figure 7.
Power simulations:
To evaluate the power of the CLRT (i.e., probability of rejecting a false null hypothesis of neutrality), we wrote a forward simulation program, FISHER, to simulate a genomic region under recurrent selection and recombination using an infinite-sites model of mutation assuming constant population size. Power was estimated as the proportion of replicates generated under selection for which the null hypothesis was rejected by the CLRT. The detailed algorithm is as follows and results of the FISHER simulations can be found in Figures 9–11.
Figure 9.—

Power of the CLRT under varying levels of selection. The x-axis is the value of the selection parameter in the PRF model under which the data were simulated.
Figure 11.—

Power of the CLRT in distinguishing negative selection from the population exponentially growing model. Data were simulated by the “FISHER” program under the assumption of constant population size with sample size n = 50, θ = 30, R = 100 under the forward simulation model with selection coefficient γ = −1, −5, −10, respectively. The x-axis is the growth rate β, the parameter of the data where the empirical distribution of the test statistics was obtained to get the critical value for the test.
Algorithm 4: Procedure for estimating the power of the CLRT:
Generate a data set of n sequences via FISHER given mutation rate, selection coefficient, and recombination rate; apply the CLRT to obtain the test statistic ΛOBS and corresponding P-value from algorithm 1.
If P < 0.05, reject the neutral hypothesis; otherwise, fail to reject at the α = 0.05 level.
Repeat steps 1 and 2 500 times and calculate the power of the test as the proportion of rejections.
The power of the test above is based on estimating the P-value assuming a constant population size. Since population growth may have an effect similar to negative selection, we examine how powerful the CLRT is in distinguishing negative selection from an exponentially growing population model. For these simulations, the data sets were simulated via FISHER given the selection coefficient, mutation rate, and recombination rate. The critical value of the CLRT was determined assuming the population has been growing exponentially, and mutations were neutral. We sampled 50 sequences with mutation parameter θ = 30, recombination rate R = 100, and selection coefficient γ ∈ {−1, −5, −10}. We analyzed the power of the CLRT in distinguishing negative selection from the exponential growth with growth rate β ∈ {0.1, 0.2, 0.4, 0.8, 1.6, 3.2}. To achieve this, we modify step 2 in algorithm 1 and simulate data under an exponential growth model. All other steps remain unchanged. (Results are shown in Figure 11.)
RESULTS AND DISCUSSION
How quickly does the test statistic (Λ) converge to a χ21-distribution?
From Figure 2, we confirm the theoretical prediction that the composite-likelihood-ratio test statistic Λ converges to a χ21-distribution as recombination rate increases; unfortunately, the convergence rate is very slow. From Figure 3, we can see that the 95% critical value of Λ (denoted as Λ*) does not attain the expected cutoff of  under the independence model until R > 1000 for all three levels of sample size considered (n = 10, 50, 100). Were we to test the neutral hypothesis using the CLRT and assume Λ followed a χ21-distribution, the test would not attain the correct type I error until the rate of recombination was inordinately large. This result is consistent with that of Bustamante et al. (2001) that the LRT is not robust to deviations from the assumption of independence among sites and highlights the need for developing a statistical method that can deal effectively with linkage among sites.
How does bias in estimation of the recombination rate affect the realized size of the CLRT?
We see from Figure 4 that the realized type I error of the CLRT decreases with increasing recombination rate for both estimators studied. This is consistent with the fact that both Hey and Wakeley's (1997) and Hudson's (1987) estimators improve as R increases (Wall 2000). In general, using Rh to estimate the recombination rate will result in larger type I error than using Rhw. From our study, for R ≤ 15, Hey and Wakeley's estimator performs better than Hudson's with size closer to the type I error (0.05); for 15 ≤ R ≤ 125, Hudson's method actually performs better than Hey and Wakely's, and for R ≥ 125, both are overly conservative. Recalling that Rh is upwardly biased for low levels of R (Wall 2000), it becomes clear that overestimating the recombination rate leads to a lower Λ* and hence an increased probability of rejecting the null hypothesis (and therefore larger type I error). Consistent with this observation is that Rhw, which is downwardly biased, leads almost uniformly to a very conservative CLRT.
How does undetected migration affect the size of the CLRT?
Even if we had a “perfect” estimator of R, we might not attain a realized type I error of α = 0.05 due to other factors, such as population history. We see from Figure 5 that an island model of population subdivision is such a scenario. For all levels of D examined, the observed pattern is very similar: the type I error of the CLRT is 0.05 at M = 0; it then increases sharply for 0 < M < 1 and then decreases slowly to 0.05 as M increases toward infinity. In a structured population with M = 0, all subpopulations are completely isolated and within each subpopulation, individuals undergo random mating. Since sequences subject to the CLRT are all sampled from one subpopulation assumed to be at equilibrium, it is not surprising to see that the realized size of the CLRT for data with M = 0 is at the proper level for all levels of D.
Slightly increasing the migration rate will impact the site-frequency spectrum by reducing the relative proportion of low-frequency SNPs and increasing the relative proportion of high-frequency SNPs. This is due to the fact that if M is “small but not too small,” a sample of DNA sequences from a single subpopulation will often contain a single migrant from another deme. This migrant will, more often than not, be involved in the last coalescent event of the genealogy, since the rate of migration is small relative to the rate of coalescent for M < 1. This will cause an overrepresentation of gene genealogies that are stretched near the root and compressed near the external nodes. The site frequency spectrum will, thus, look similar to what is expected under positive selection, predicting an increase in the type I error of the CLRT for neutrality.
As M gets larger, the proportion of a given subpopulation that originated in another deme increases linearly. And as M tends toward infinity, the fixation index F will tend to be zero [F̂ = 1/(1 + 4Nem), at equilibrium], indicating no population structure. Hence a sample of DNA sequences randomly drawn from a subpopulation would be wholly representative of the entire population and the CLRT should have type I error at the desired level. Indeed, from our simulation study, when M ≥ 16, for a number of subpopulations <10, all tests we studied have type I error ≤ 0.05. For a large number of subpopulations (>10), M should be >32 to have proper size of the CLRT.
There are two possible ways to improve the CLRT vis-à-vis population structure. One is to modify the critical value of the CLRT by estimating M from neutral data and thus reducing the type I error by producing a more sophisticated null model. The second approach is to jointly estimate selection and migration coefficients under various population structure models. It is important to note that both fixes might also introduce systematic bias in the realized type I error due to bias in estimation of demographic parameters.
How does recent population expansion affect the type I error?
Another important assumption in this model is the assumption of constant population size over generations. This assumption does not hold for the vast majority of species that we would like to analyze for evidence of natural selection at the genetic level. From Figure 6, we can say that CLRT is not robust against the assumption of constant population size although it does not do badly for relative tight linkage with low population growth rate. The type I error increases with the population growth rate. The reason is that population growth causes an increase in the coalescent rate as the process proceeds back in time, leading to star-like genealogies, which results in an excess of mutations in external branches (i.e., singletons or substitutions present in only one sampled sequence) (Tajima 1989; Slatkin and Hudson 1991). It is difficult to differentiate the site-frequency spectrum of population growth data from that under negative selection. The larger the population growth rate, the more singletons and hence the more likely it is to make false rejections. It is expected that recombination substantially affects the size of the CLRT, which is shown to be true in Figure 6. For small population growth rate (β < 0.1), CLRT still performs very well with type I error ≤ 0.05, which means slight changes in the population size do not affect the size of the CLRT. Williamson et al. (2005) have recently developed a method that can jointly estimate selection and population growth assuming independence among sites. For that model, one can also perform the CLRT, conditioning on the maximum-likelihood estimate of the growth parameter from the rest of the genome and an estimate of the local recombination rate to simulate the critical value of the test statistic for a given gene.
How does a recent population bottleneck affect type I error?
Simulation study reveals that the effect of population bottlenecks on the patterns of SFS is very complicated (Figure 7). Moderate bottlenecks (Figure 7A) result in less low-frequency SNPs and more medium- and high-frequency SNPs than under neutrality. Strong bottlenecks (Figure 7B) function in the opposite direction, namely, more rare SNPs than expected under the constant population size model. The reason for this is that rate of coalescence increases during the bottleneck period and depending on parameter values can look like either positive or negative selection (Galtier et al. 2000). For example, a recent weak bottleneck can lead to disproportionately longer internal branches as several lineages make it back into the ancestral population and thus contribute to high-frequency-derived mutations that can look like positive selection. Alternatively, a very severe recent bottleneck will likely lead to the most recent common ancestor event during the bottleneck period and thus to star-like external branches that may be difficult to distinguish from negative selection. As a consequence, the type I error of the CLRT is quite high in populations that have experienced a recent bottleneck event (Figure 8). Increasing sample size and mutation rates leads to even higher type I error (results not shown).
While it is clear that the CLRT is not robust to the effects of a recent bottleneck, it may be possible to distinguish whether the rejection of the test is due to natural selection or the effect of the recent population bottlenecks. One approach is to use a composite-likelihood goodness-of-fit statistic that measures concordance between the data and a selective model (Jensen et al. 2005, accompanying article). Alternatively, the genomic distribution of the CLRT statistic itself can be used, since a bottleneck would uniformly increase the proportion of loci across the genome that rejects neutrality.
How powerful is the CLRT in detecting selection?
To evaluate a statistical test, we want not only to control the type I error, but also to assess the power [1 − Pr(type II error)]. Our simulation results (Figure 9) suggest that the CLRT has relatively good power to detect negative selection and moderate power to detect positive selection, if the population recombination rate is on the order of the mutation rate and there is moderately strong selection.
If natural selection is very weak (|γ| < 1) and sites are tightly linked, selection has little effect on the SFS and the CLRT and, thus, has little power. When selection is strong and negative (γ < −5), the site-frequency spectrum is skewed toward rare alleles and the CLRT performs very well even for small sample size irrespective of the mutation or recombination rates. In detecting weak positive selection (γ > 5), the CLRT has medium power for moderate levels of recombination relative to mutation (R > 5; θ = 30). We find that increasing the sample size from n = 15 to n = 50 will uniformly increase power (Figure 9). However, increasing the mutation rate from θ = 30 to θ = 75, paradoxically, decreases the power for detecting positive selection. The statistical reason for this is that the site-frequency spectrum of data with a high mutation rate and tightly linked sites subject to weak positive selection is similar to the SFS from a neutral population (Figure 10). One biological reason for this phenomenon is that increasing the mutation rate (or reducing the recombination rate) increases interference among selected mutations and thus reduces the overall efficacy of natural selection (Robertson 1961; Hill and Robertson 1966; Felsenstein 1974; Comeron and Kreitman 2002).
Figure 10.—

Site-frequency spectrum under recurrent negative selection, neutral, and positive selection with varying levels of mutation and recombination rates. The y-axis is the proportion of SNP sites that were found at frequencies 1/15, 2/15, … , 14/15.
Can the CLRT distinguish negative selection from the effect of population growth?
As we see from Figure 11, the CLRT does not have much power in distinguishing very weak negative selection (γ = −1) from exponential growth. However, for moderately strong negative selection (γ = −5), the CLRT has very high power to differentiate selection from exponential growth with growth rate in the range of 0.1 ∼ 3.2. This suggests the CLRT maybe particularly useful for finding genes that may be subject to moderate negative selection.
Is the MCLE a good estimator of selection coefficients?
If the assumption of independence among sites is met, maximum-likelihood estimation of the selection and mutation rate parameters performs very well (Bustamante et al. 2001). We are interested to know whether the estimator is still reliable when we relax the assumption of independence among sites. In Figure 12, we summarize the ratio of the MCLE of the selection parameter to the true selection coefficient as a function of γ. We can see that for weak negative selection (γ ≈ −1), composite-maximum-likelihood estimation performs very well for all parameter combinations considered. Both mutation and recombination affect the accuracy of estimation. The parameter is underestimated with higher mutation rate or less recombination events. In general, the maximum-composite-likelihood estimator does not deviate far away from the true parameter value under which the data were simulated for negative selection with moderate mutation rate and have total recombination events >100 per generation.
Figure 12.—

γ̂/γ for data drawn from forward simulation with the recombination model (by the “FISHER” program). γ̂ is the maximum-likelihood estimator of the selection coefficient, and γ is the true parameter value under which the data were simulated.
The MCLE performs rather poorly in estimating the strength of positive selection in the presence of linkage with a large bias toward underestimation. The main reason is likely to be reduction in the effectiveness of selection because of interference among selected mutations (see Comeron and Kreitman 2002). That is, even if each mutation that enters the population has a selective advantage of, say, Ns = 5, because there are few chromosomes that lack positively selected mutations, there will be only small fitness difference among chromosomes. As a result, mutations have a smaller realized effect on the site-frequency spectrum than predicted under the independence assumption.
Conclusions:
The composite-likelihood method presented here for inferring natural selection from DNA sequence data has reasonably good performance, in terms of power and robustness. One advantage over previous PRF tests is proper control of type I error if DNA sites are linked. As expected, the method used to estimate the local recombination rate can have profound effects on the realized size of the test. We predict this will be a general property of composite-likelihood methods that aim to infer selection from standing patterns of genetic variation, and very little is known about the accuracy of methods for estimating recombination in the presence of recurrent selection.
We also find that undetected population structure, population growth, and/or bottlenecks can all inflate the realized type I error of the test above its nominal level. One possible solution is to explicitly model selection and demography in future incarnations of the CLRT. In particular, by analyzing several unlinked loci simultaneously one may be able to estimate common shared parameters (such as expansion rate or time since bottleneck), while allowing for locus-specific selection parameters. Likewise, it is known that variation in selection among sites as well as dominance can have strong effects on the SFS (Bustamante et al. 2003; Williamson et al. 2004). We hope to incorporate these factors into future versions of the test.
Our simulation study shows that the composite-likelihood-ratio test has excellent power to detect negative selection and moderate power to detect positive selection. However, for weak selection |γ| < 1 and tight linkage R < 5, the method does not perform well, presumably due to interference selection. We have also shown that mutation rate and recombination rate profoundly influence the power of the CLRT.
It should be pointed out that a significant result of the CRLT (as with all tests of neutrality) should be interpreted cautiously since there are several putative alternative hypotheses to a single null hypothesis. Indeed, aside from the factors explored in this article, processes such as population shrinking, inbreeding, and a single selective sweep could also produce genealogies that are consistent with some form of recurrent natural selection. Functional information will ultimately be needed to sort the false from the true positives.
Acknowledgments
We thank members of the Bustamante lab for discussion. We also thank Feng Feng for his kind assistance with the source code. The comments of two anonymous reviewers greatly improved the article. This research was supported by National Science Foundation award 0319553 to M. Purugganan, S. McCouch, R. Nielsen, and C.D.B. as well as by a U.S. Department of Agriculture-Hatch grant (NY 151411) to C.D.B.
References
- Ashburner, M., 1989 Drosophila: A Laboratory Manual. Cold Spring Harbor Laboratory Press, Cold Spring Harbor, NY.
- Bouffard, G. G., J. R. Idol, V. V. Braden, L. M. Iyer, A. F. Cunningham et al., 1997. A physical map of human chromosome 7: an integrated YAC contig map with average STS spacing of 79kb. Genome Res. 7 673–692. [DOI] [PubMed] [Google Scholar]
- Bustamante, C. D., J. Wakeley, S. Sawyer and D. L. Hartl, 2001. Directional selection and the site-frequency spectrum. Genetics 159 1779–1788. [DOI] [PMC free article] [PubMed] [Google Scholar]
- Bustamante, C. D., R. Nielsen and D. L. Hartl, 2003. Maximum likelihood and Bayesian methods for estimating the distribution of selective effects among classes of mutations using DNA polymorphism data. Theor. Popul. Biol. 63(2): 91–103. [DOI] [PubMed] [Google Scholar]
- Comeron, J. M., and M. Kreitman, 2002. Population, evolutionary and genomic consequences of interference selection. Genetics 161 389–410. [DOI] [PMC free article] [PubMed] [Google Scholar]
- Ewens, W. J., 1974. A note on the sampling theory for infinite alleles and infinite sites models. Theor. Popul. Biol. 6 143–148. [DOI] [PubMed] [Google Scholar]
- Fay, J. C., and C.-I Wu, 2000. Hitchhiking under positive Darwinian selection. Genetics 155 1405–1413. [DOI] [PMC free article] [PubMed] [Google Scholar]
- Fearnhead, P., and P. Donnelly, 2002. Approximate likelihood methods for estimating local recombination rates. J. R. Stat. Soc. Ser. 64 657–680. [Google Scholar]
- Felsenstein, J., 1974. The evolutionary advantage of recombination. Genetics 78 737–756. [DOI] [PMC free article] [PubMed] [Google Scholar]
- Fu, Y.-X., and W.-H. Li, 1993. Statistical tests of neutrality of mutations. Genetics 133 693–709. [DOI] [PMC free article] [PubMed] [Google Scholar]
- Galtier, N., F. Depaulis and H. N. Barton, 2000. Detecting bottlenecks and selective sweeps from DNA sequence polymorphism. Genetics 155 981–987. [DOI] [PMC free article] [PubMed] [Google Scholar]
- Griffiths, R., and P. Marjoram, 1996. Ancestral inference from samples of DNA sequences with recombination. J. Comp. Biol. 3 479–502. [DOI] [PubMed] [Google Scholar]
- Hartl, D. L., E. N. Moriyama and S. A. Sawyer, 1994. Selection intensity for codon bias. Genetics 138 227–234. [DOI] [PMC free article] [PubMed] [Google Scholar]
- Hey, J., and J. Wakeley, 1997. A coalescent estimator of the population recombination rate. Genetics 145 833–846. [DOI] [PMC free article] [PubMed] [Google Scholar]
- Hill, W. G., and A. Robertson, 1966. The effect of linkage on the limits to artificial selection. Genet. Res. 8 269–294. [PubMed] [Google Scholar]
- Hudson, R. R., 1987. Estimating the recombination parameter of a finite population model without selection. Genet. Res. 50 245–250. [DOI] [PubMed] [Google Scholar]
- Hudson, R. R., 1990 Gene Genealogies and the Coalescent Process. Oxford University Press, Oxford.
- Hudson, R. R., 2001. Two-locus sampling distributions and their application. Genetics 159 1805–1817. [DOI] [PMC free article] [PubMed] [Google Scholar]
- Hudson, R. R., 2002. Generating samples under a Wright-Fisher neutral model. Bioinformatics 18 337–338. [DOI] [PubMed] [Google Scholar]
- Hudson, R. R., and N. L. Kaplan, 1985. Statistical properties of the number of recombination events in the history of a sample of DNA sequences. Genetics 111 147–164. [DOI] [PMC free article] [PubMed] [Google Scholar]
- Innan, H., and Y. Kim, 2004. Pattern of polymorphism after strong artificial selection in a domestication event. Proc. Natl. Acad. Sci. USA 101(29): 10667–10672. [DOI] [PMC free article] [PubMed] [Google Scholar]
- Jensen, J. D., Y. Kim, V. Bauer-DuMonth, C. F. Aquadro and C. D. Bustamante, 2005. Distinguishing between selective sweeps and demography using DNA polymorphism data. Genetics 170 1401–1410. [DOI] [PMC free article] [PubMed] [Google Scholar]
- Kendall, M., 1987 Kendall's Advanced Theory of Statistics. Oxford University Press, Oxford.
- Kim, Y., and R. Nielsen, 2004. Linkage disequilibrium as a signature of selective sweeps. Genetics 167 1513–1524. [DOI] [PMC free article] [PubMed] [Google Scholar]
- Kim, Y., and W. Stephan, 2002. Detecting a local signature of genetic hitchhiking along a recombining chromosome. Genetics 160 765–777. [DOI] [PMC free article] [PubMed] [Google Scholar]
- Krone, S. M., and C. Neuhauser, 1997. Ancestral processes with selection. Theor. Popul. Biol. 51 210–237. [DOI] [PubMed] [Google Scholar]
- Kuhner, M. K., J. Yamato and J. Felsenstein, 1999 RECOMBINE, Version 1.0 (http://evolution.genetics.washington.edu/lamarc.html).
- Lewontin, R. C., 1974 The Genetic Basis of Evolutionary Change. Columbia University Press, New York.
- Li, N., and M. Stephens, 2003. Modeling linkage disequilibrium and identifying recombination hotspots using single-nucleotide polymorphism data. Genetics 165 2213–2233. [DOI] [PMC free article] [PubMed] [Google Scholar]
- McVean, G., P. Awadalla and P. Fearnhead, 2002. A coalescent-based method for detecting and estimating recombination from gene sequences. Genetics 160 1231–1241. [DOI] [PMC free article] [PubMed] [Google Scholar]
- McVean, G., S. R. Myers, S. Hunt, P. Deloukas, D. R. Bentley et al., 2004. The fine-scale structure of recombination rate variation in the human genome. Science 304(5670): 581–584. [DOI] [PubMed] [Google Scholar]
- Nagaraja, R., S. Macmillan, J. Kere, C. Jones, S. Griffin et al., 1997. X chromosome map at 75-kb STS resolution, revealing extremes of recombination and GC content. Genome Res. 7 210–222. [DOI] [PubMed] [Google Scholar]
- Neuhauser, C., and S. M. Krone, 1997. The genealogy of samples in models with selection. Genetics 145 519–534. [DOI] [PMC free article] [PubMed] [Google Scholar]
- Nielsen, R., 2001. Statistical tests of selective neutrality in the age of genomics. Heredity 86 641–647. [DOI] [PubMed] [Google Scholar]
- Robertson, A., 1961. Inbreeding in artificial selection programmes. Genet. Res. 2 189–194. [DOI] [PubMed] [Google Scholar]
- Sawyer, S. A., and D. L. Hartl, 1992. Population genetics of polymorphism and divergence. Genetics 132 1161–1176. [DOI] [PMC free article] [PubMed] [Google Scholar]
- Sawyer, S. A., R. J. Kulathinal, C. D. Bustamante and D. L. Hartl, 2003. Bayesian analysis suggests that most amino acid replacements in Drosophila are driven by positive selection. J. Mol. Evol. 57 S154–S164. [DOI] [PubMed] [Google Scholar]
- Slade, P. F., 2001. Simulation of ‘hitch-hiking’ genealogies. J. Math. Biol. 42(1): 41–70. [DOI] [PubMed] [Google Scholar]
- Slatkin, M., and R. R. Hudson, 1991. Pairwise comparisons of mitochondrial DNA sequences in stable and exponentially growing populations. Genetics 129 555–562. [DOI] [PMC free article] [PubMed] [Google Scholar]
- Tajima, F., 1989. Statistical method for testing the neutral mutation hypothesis by DNA polymorphism. Genetics 123 585–595. [DOI] [PMC free article] [PubMed] [Google Scholar]
- True, J. R., J. M. Mercer and C. C. Laurie, 1996. Differences in crossover frequency and distribution among three sibling species of Drosophila. Genetics 142 507–523. [DOI] [PMC free article] [PubMed] [Google Scholar]
- Wakeley, J., 1997. Using the variance of pairwise differences to estimate the recombination rate. Genet. Res. 69 45–48. [DOI] [PubMed] [Google Scholar]
- Wakeley, J., 2001. The coalescent in an island model with variation among demes. Theor. Popul. Biol. 59 133–144. [DOI] [PubMed] [Google Scholar]
- Wakeley, J., 2003. Polymorphism and divergence for island-model species. Genetics 163 411–420. [DOI] [PMC free article] [PubMed] [Google Scholar]
- Wall, J. D., 2000. A comparison of estimators of the population recombination rate. Mol. Biol. Evol. 17 156–163. [DOI] [PubMed] [Google Scholar]
- Wall, J. D., 2004. Estimating recombination rates using three-site likelihoods. Genetics 167 1461–1473. [DOI] [PMC free article] [PubMed] [Google Scholar]
- Watterson, G. A., 1975. On the number of segregating sites in genetic models without recombination. Theor. Popul. Biol. 7 256–276. [DOI] [PubMed] [Google Scholar]
- Williamson, S., 2003. Adaptation in the env gene of HIV-1 and evolutionary theories of disease progression. Biol. Evol. Mol. Biol. Evol. 20 1318–1325. [DOI] [PubMed] [Google Scholar]
- Williamson, S., A. F. Alon and C. D. Bustamante, 2004. Population genetics of polymorphism and divergence for diploid selection models with arbitrary dominance. Genetics 168 463–475. [DOI] [PMC free article] [PubMed] [Google Scholar]
- Williamson, S., R. Hernandez, A. F. Alon, L. Zhu, R. Nielsen et al., 2005. Simultaneous inference of selection and population growth from patterns of variation in the human genome. Proc. Natl. Acad. Sci. USA 102(22): 7882–7887. [DOI] [PMC free article] [PubMed] [Google Scholar]