

Abstract
The transcription factor LHY and the related protein CCA1 perform overlapping functions in a regulatory feedback loop that is closely associated with the circadian oscillator of Arabidopsis. Overexpression of LHY abolished function of the circadian clock in constant light, but rhythmic expression of several circadian clock-regulated transcripts was observed under light–dark cycles. These oscillations correlated with high amplitude changes in LHY protein levels, caused by light-induced translation of the LHY transcript. Increases in LHY protein levels were also observed in light-grown wild-type plants, when light signals coincided with the circadian-regulated peak of LHY transcription at dawn. Unexpectedly, translational induction coincided with acute downregulation of LHY transcript levels. We suggest that the simultaneous translational induction and transcriptional repression of LHY expression play a role to narrow the peak of LHY protein synthesis at dawn and increase the robustness and accuracy of circadian oscillations. Strong phase shifting responses to light signals were observed in plants lacking function of LHY, CCA1 or both, suggesting that light-regulated expression of these proteins does not mediate entrainment of the clock to light–dark cycles.
Keywords: Arabidopsis/circadian clock/light regulation/translational regulation
Introduction
Circadian clocks are endogenous 24 h pacemakers that allow organisms to adapt their physiology in anticipation of predictable daily changes in environmental conditions. Such clocks have been identified in a variety of organisms ranging from cyanobacteria to mammals (Young and Kay, 2001), and the general principles that govern their function are remarkably similar. Rhythmic behaviour is conferred by negative transcriptional feedback loops (Dunlap, 1999), and interlocked positive feedback loops promote robustness of circadian oscillations (Cheng et al., 2001). Entrainment to day–night cycles is achieved by light-induced changes in the level of a component of the oscillator. Light, for example, resets the Neurospora clock through the transcriptional activation of FREQUENCY expression (Crosthwaite et al., 1995). Expression of mPeriod-1 and -2 transcripts is also induced by light in the suprachiasmiatic nucleus of mammals (Field et al., 2000); however, resetting of the Drosophila clock is mediated by light-induced degradation of the TIMELESS protein (Myers et al., 1996; Naidoo et al., 1999).
In plants, putative elements of the oscillatory mechanism include an atypical two-component response regulator named TOC1 or APRR1, and two related MYB transcription factors known as LHY and CCA1 (Schaffer et al., 1998; Wang and Tobin, 1998; Makino et al., 2000; Strayer et al., 2000). These elements comprise a negative feedback loop, in which LHY and CCA1 act redundantly to repress transcription of the TOC1 gene during the day. Expression of the TOC1 protein at night upregulates transcription of LHY and CCA1, giving rise to peaks of expression in the morning (Alabadi et al., 2001). The function of LHY and CCA1 is essential for the maintenance of free-running oscillations (Alabadi et al., 2002; Mizoguchi et al., 2002), suggesting that the LHY/CCA1/TOC1 feedback loop may function as part of the core oscillator of the Arabidopsis circadian clock.
The mechanism by which the plant circadian clock becomes synchronized to environmental light–dark cycles is not known. Phytochrome and cryptochrome photoreceptors mediate effects of light on circadian rhythms (Somers et al., 1998; Devlin and Kay, 2000). The LOV domain-, Kelch repeat- and F-box-containing proteins ZTL, FKF1 and LKP2, and the novel nuclear proteins GI and ELF3, have also been implicated in light input to the clock (Fowler et al., 1999; Park et al., 1999; Nelson et al., 2000; Somers et al., 2000; Covington et al., 2001; Schultz et al., 2001). The TOC1 protein was shown to associate with the phytochrome B-regulated transcription factor PIF3 and with the related protein PIL1 in a yeast two-hybrid assay (Makino et al., 2002), but the functional significance of this interaction has not yet been demonstrated. PIF3 also binds the promoters of the LHY and CCA1 genes and mediates their transcriptional activation by red light in etiolated plants. Therefore, PIF3-mediated induction of the LHY and CCA1 transcripts has been proposed to mediate entrainment of the clock by light– dark cycles (Martinez-Garcia et al., 2000).
A recent report indicated that CCA1-overexpressing plants exhibit diurnal changes in expression of several clock-regulated genes (Green et al., 2002); however, the mechanism of these oscillations is not known. Here we show that lhy-1 mutant plants, which overexpress the LHY transcript, also exhibit driven rhythmicity. We demonstrate that gene expression rhythms in lhy-1 plants correlate with light- and dark-induced changes in LHY protein levels, caused by light-induced translation of the constitutive LHY transcript. We then investigate the transcriptional and translational regulation of LHY expression in light-grown, wild-type plants, and their possible contribution to circadian entrainment.
Results
Light–dark cycles drove rhythmic expression of clock-controlled genes in lhy-1 plants
The lhy-1 mutation abolished free-running rhythms of CAB and CCR2 gene expression in constant light (Schaffer et al., 1998); however, lhy-1 plants exhibited rhythmic changes in CONSTANS (CO) and CCR2 mRNA levels under diurnal light–dark cycles (Suarez-Lopez et al., 2001; Figure 1A and B). Similar, conditional disruption of rhythmicity has been described for the elf3 mutant (Hicks et al., 1996; McWatters et al., 2000). Under light–dark cycles, increases in expression of a CAB::luciferase (CAB::luc) reporter gene anticipated dawn in elf3, indicating control by an endogenous pacemaker. In order to test whether diurnal rhythms in the lhy-1 mutant also reflected function of a biological clock, CAB::luc expression was analysed in transgenic lhy-1 plants under light–dark cycles of varying total durations (T) (Figure 1C). In wild-type plants, 28 h T cycles advanced the phase angle of the CAB::luc rhythm relative to dawn, whereas 20 h T cycles delayed it. These effects of T cycles on the phase of circadian rhythms were comparable with those reported for Drosophila and Neurospora (Pittendrigh and Minis, 1964; Merrow et al., 1999). In lhy-1 plants, however, the onset of luminescence always coincided with dawn, regardless of T cycle conditions. Therefore, waves of CAB::luc expression were initiated by dark to light transitions rather than by a circadian oscillator.

Fig. 1. Diurnal rhythms of gene expression in LHY-overexpressing plants. (A) Temporal patterns of gene expression in 10-day-old wild-type (Ler) and lhy-1TN104 plants under 12L:12D cycles. CCR2, actin (ACT2) and the overexpressed LHY transcript (LHY-ox) were assayed simultaneously by RNase protection assays. (B) CCR2 mRNA levels from (A) were quantified using a PhosphorImager and normalized to ACT2 mRNA levels. (C) Temporal patterns of CAB::luc expression in wild-type (Ler) and lhy-1 plants under light–dark cycles. Transgenic seedlings expressing a CAB::luc reporter fusion were grown under light–dark cycles of varying total duration (T = 20 h, 6.7L:13.3D; T = 24 h, 8L:16D; T = 28 h, 9.3L:18.7D) for 7 days and imaged every 2 h using a photon-counting camera. Each trace represents luminescence data from a group of 10–15 seedlings. Time scales were normalized to 24 h, to facilitate comparison between the different light–dark cycles. One normalized unit of time corresponds to the total duration of the light–dark cycle (T, in hours) divided by 24. Experiments were carried out at least twice with similar results. White and black boxes at the top of the graphs indicate the intervals of light and darkness, respectively.
Expression of LHY and CCA1 transcripts was repressed in lhy-1 plants under light–dark cycles
The light–dark-driven expression of clock-regulated genes suggested that expression of LHY might not be constitutive in lhy-1 plants under these conditions. Alternatively, light–dark transitions might drive changes in CCA1 expression levels. These possibilities were tested in lhy-1TN104 plants, which carry the dominant lhy-1 mutation as a transgene. Light-induced transcription of CCA1 and of the endogenous LHY mRNA was not impaired in etiolated seedlings (Figure 2A), but expression levels under light– dark cycles remained close to the trough of the wild-type rhythm (Figure 2B). Both transcripts exhibited rhythmic fluctuations at very low levels, but increases in LHY and CCA1 mRNA levels anticipated dawn (Figure 2C). As transcript levels were too low for reliable analysis, rhythmic patterns were confirmed by assaying expression of LHY::luc and CCA1::luc reporter constructs in transgenic plants (Figure 2D). Rhythmic luminescence was observed under light–dark cycles, and persisted for at least one cycle in constant darkness. Thus, increased luminescence at dawn did not simply reflect acute responses to light. Waves of LHY and CCA1 expression may have been triggered by dusk signals, as rhythmic changes in luciferase expression were abolished upon transfer to constant light (LL). As rhythmic changes in LHY or CCA1 transcript occurred at very low levels, these oscillations were unlikely to make significant contributions to rhythmic phenotypes in the lhy-1TN104 mutant.

Fig. 2. Light regulation of CCA1 and LHY expression in lhy-1TN104 plants. Expression of the endogenous CCA1 and LHY transcripts was analysed by RNase protection assays. A probe to the 5′-UTR of the LHY gene was used to detect the wild-type LHY transcript, but not the overexpressed transcript, in lhy-1TN104 plants. (A) Seven-day old etiolated wild-type and lhy-1TN104 plants were exposed to 2 min of red light, and plants were harvested at different time intervals. Closed symbols, dark controls; open symbols, light-induced plants; circles, endogenous LHY mRNA; squares, CCA1 mRNA. (B) Wild-type (Ler) and lhy-1TN104 plants were grown under 12L:12D cycles for 10 days then harvested at 4 h intervals. The CCA1 mRNA and the endogenous LHY transcript were analysed as described above. Open symbols, wild-type plants; closed symbols, lhy-1TN104 plants. White and black boxes at the top of the graphs indicate the intervals of light and darkness, respectively. (C) To emphasize any possible response to light, lhy-1TN104 mRNA levels from (B) were plotted on the same scale as in (A). (D) Expression of LHY::luc and CCA1::luc reporter constructs in Ler (open symbols) and lhy-1 mutant plants (closed symbols) grown under 12L:12D and then transferred to constant light or darkness. Each trace represents average values from 2–10 individual seedlings. Expression levels in wild-type plants are shown on the primary axis, those in lhy-1 plants on the secondary axis. Experiments were carried out at least twice with similar results.
Rhythmic expression of CAB and CCR2 in lhy-1 plants was correlated with light-driven oscillations of LHY protein levels
Immunoblot analyses were carried out to test for light-driven changes in LHY protein levels. The LHY protein was identified as a band of ∼88 kDa, which was present in extracts from wild-type (Ler) plants in the early morning (ZT1), but not in the evening (ZT10) (Figure 3A). Elevated levels of the 88 kDa protein were detected in the lhy-1 mutant, but the protein was absent from a loss-of-function allele (lhy-11) and from plants that overexpressed CCA1 (CCA1-ox). Although larger than the predicted molecular weight (70.4 kDa), the size of this protein matched that of bacterially expressed LHY protein and is thought to correspond to the full-length LHY gene product. A 68 kDa protein detected in extracts from lhy-1 plants may correspond to a degradation product. In wild-type plants grown under 12 h of light and 12 h of darkness (12L:12D), LHY protein levels peaked ∼2 h after the LHY transcript (Figure 3B and C). High amplitude oscillations were also observed in lhy-1TN104 plants, but their pattern was strikingly different. LHY protein levels began to rise immediately after dawn, reached a plateau after 4–6 h, and then decayed during the dark period. These changes did not correlate with significant changes in total LHY mRNA abundance, suggesting regulation by a post-transcriptional mechanism (Figures 1B, LHY-ox, and 3C).

Fig. 3. Temporal patterns of LHY protein expression in wild-type and lhy-1TN104 plants under light–dark cycles. Plants were grown under 12L:12D light–dark cycles for 8 days prior to harvesting. Protein extracts were analysed by SDS–PAGE. The upper part of the gel (containing proteins >60 kDa) was blotted onto nylon membrane, and probed using an antibody to LHY. The bottom part of the same gel was stained using Coomassie Blue, and the most abundant band at 55 kDa, corresponding to RBCL, was used as a loading control. (A) Specificity of the LHY antiserum. Plants were harvested either 1 or 10 h after dawn (ZT 1 or ZT 10). Equal amounts of protein were loaded in each lane. Bacterially expressed LHY protein [B] was used as a size marker. (B) Temporal patterns of LHY protein expression in wild-type (Ler) and lhy-1TN104 plants grown under 12L:12D cycles for 8 days, then harvested over a 49 h time span. The level of LHY protein was determined by western blot analysis. For wild-type samples, 100 µg of total protein were loaded in each lane. For lhy-1 samples, only 30 µg of total protein were used. Exposure times in (B) were optimized to emphasize rhythmic changes in LHY protein levels in the lhy mutant. Similar changes were detected for the experiment in (A) after shorter exposure times. (C) Quantification of protein and mRNA levels, in wild-type (Ler) and lhy-1TN104 plants grown under 12L:12D. LHY protein levels (closed symbols) were determined by quantification of the western blot shown in (B). Total LHY transcript levels (open symbols) were determined by RNase protection assay of RNA prepared from the same plant samples, using a probe to the LHY coding region. RNA and protein levels are expressed as a percentage of their maximum levels. (D) Arrhythmic expression of the LHY protein in lhy-1TN104 plants in constant light. Plants were grown under 12L:12D cycles for 8 days then transferred to constant light at time zero. A 50 µg aliquot of total protein was loaded in each lane. White and black boxes at the top of the graphs indicate the intervals of light and darkness, respectively. Solid and hatched white bars in (D) indicate subjective days and nights, respectively. All experiments except those in (D) were carried out at least twice with similar results.
To test whether oscillations in LHY protein levels reflected a response to light, or the function of a circadian oscillator, we tested whether they would persist in lhy-1TN104 upon transfer to LL. No rhythmic variations were detected in the absence of light–dark transitions (Figure 3D).
Light-induced translation of the constitutive LHY transcript in lhy-1 plants
To test whether light altered the rate of degradation of the LHY protein, lhy-1 seedlings were pulse-labelled with [35S]methionine at ZT 3 (3 h after dawn) and chase experiments were carried out in the light or in darkness. LHY protein levels decayed with similar kinetics in both conditions, indicating that the turnover of LHY was not significantly affected by light over the duration of these experiments (Figure 4). To test for light-induced changes in the rate of LHY protein synthesis, we compared rates of incorporation of [35S]methionine into LHY protein in the light or in the dark. As expected, radioactivity was incorporated more rapidly into LHY in the first 90 min after dawn (ZT 0), when compared with the first 90 min after dusk (ZT 12); however, incorporation into total protein was also faster at ZT 0 than at ZT 12 (Figure 5A). In a second experiment, we compared the effects of light and darkness applied at ZT 12. This time, incorporation into total protein was not significantly affected by light, but accumulation of [35S]methionine-labelled LHY was accelerated specifically (Figure 5B).
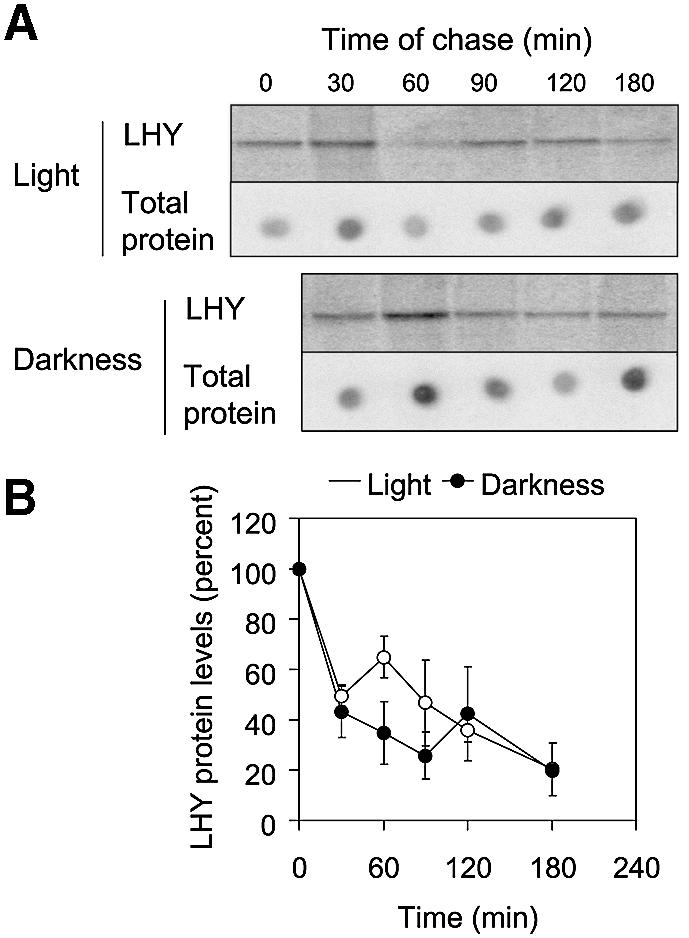
Fig. 4. The half-life of the LHY protein was identical in light or darkness. lhy-1TN104 plants were grown under 12L:12D cycles for 20 days, then pulse-labelled with [35S]methionine for 3 h starting at ZT 3 (3 h after dawn). Chasing experiments were then carried out either in the light, or after transfer to darkness. (A) LHY protein levels were analysed after immunoprecipitation, followed by SDS–PAGE and autoradiography. Total levels of radioactivity incorporated into protein were quantified by spotting 5 µl of sample onto nylon membrane prior to immunoprecipitation. Time zero corresponds to the beginning of the chase. (B) LHY protein levels were quantified using a PhosphorImager, normalized to the number of counts incorporated into total protein, and expressed as a percentage of their initial value. The experiment in (A) was carried out three times. Data points in (B) correspond to average results from two (30, 90 and 180 min) or three (0, 60 and 120 min) experiments. Error bars represent standard deviations.

Fig. 5. Rate of LHY protein synthesis under light or dark conditions. lhy-1TN104 plants were grown under 12L:12D cycles for 20 days prior to labelling with [35S]methionine under light or darkness. Two identical experiments were carried out, starting either at dawn (ZT 0) or at dusk (ZT 12). (A and B) LHY protein levels were analysed by immunoprecipitation followed by SDS–PAGE and autoradiography. Total levels of radioactivity incorporated into protein were quantified by spotting 5 µl of sample onto a nylon membrane, prior to immunoprecipitation. Time zero corresponds to the time at which [35S]methionine was added to the plants. (C and D) Quantification of the experiments in (A) and (B). The radioactivity incorporated into LHY and into total protein was determined using a PhosphorImager (A) or by densitometry (B), and normalized to counts incorporated into total protein.
Similar conclusions were reached when the radioactivity incorporated into LHY was quantified and expressed relative to that incorporated into total protein, in order to correct for differences in uptake of the radiolabel or in overall translational activity (Figure 5C and D). During the initial 30–45 min, the rate of incorporation of radioactivity into LHY in the light was 4–5 times faster than in the dark. Between 45 and 180 min, levels of radiolabelled LHY protein reached a plateau then decayed slowly. The plateau may reflect the equilibrium reached when the rate of new synthesis just compensates that of degradation. The subsequent decay may result from the progressive accumulation of other radiolabelled proteins, resulting in a lower fraction of the label being incorporated into LHY. These results demonstrate that increased levels of LHY protein in the light reflect an acceleration of LHY protein synthesis.
Light-induced expression of LHY in wild-type plants
We then tested whether transcriptional or translational induction of LHY expression was observed in wild-type plants. Seedlings were grown under diurnal light–dark cycles and transferred to constant darkness (DD) at ZT 12. Every 4 h after transfer to DD, plants were exposed to white light for 1 h and tissue was harvested after a further 1 h in darkness. No light-induced increase in LHY mRNA levels was observed between ZT 24 and ZT 40, and expression of the LHY transcript appeared downregulated relative to untreated samples (Figure 6A). An increase in LHY mRNA levels was observed in response to light signals at ZT 44 and ZT 48, but we suspect that this new responsiveness may reflect increased expression of phytochromes A and B after dark adaptation (Somers and Quail, 1995).

Fig. 6. Light regulation of LHY expression in wild-type (Ler) plants. Seedlings were grown under 12L:12D for 8 days then transferred to constant darkness at the normal dusk (ZT 12). At different times in DD, plants were exposed to white light for 1 h and harvested after 1 h further in darkness. (A) LHY mRNA levels were determined by RNA blot analysis using a probe to the LHY coding region, quantified by PhosphorImager analysis and expressed relative to rRNA levels, determined by ethidium bromide staining of the gel. (B) LHY protein levels were assayed by immunoblot analysis and normalized to RBCL levels as described in Figure 3. Analysis of LHY protein levels was carried out three times with similar results. Hatched and solid black bars indicate subjective days and nights, respectively.
LHY protein levels were analysed in the same set of samples (Figure 6B). In three repeat experiments using different extracts, increases were observed following light pulses at ZT 24 and ZT 28. Thus, expression of LHY was regulated by light at the translational level, in de-etiolated, wild-type plants. The lack of LHY protein accumulation at ZT 48 may be explained by the absence of pre-existing LHY transcript at the time of the light pulse.
We also tested the effects of light pulses on expression of the LHY::luc reporter construct in transgenic Arabidopsis. As before, plants were grown under light– dark cycles then transferred to darkness at ZT 12. At 1.5 h intervals between ZT 15 and ZT 24, different sets of plants were exposed to white light for 1 h. Two types of responses were obtained, depending on the time of exposure to light. Pulses that preceded the onset of LHY::luc expression (at ZT 16.5 and 18) did not have immediate effects on luminescence levels but delayed the circadian peak of expression (Figure 7A). Parallel analysis of CCR2::luc expression (data not shown) indicated that its subsequent peak of expression was also delayed, a result consistent with published phase response curves for red and blue light signals (Covington et al., 2001). Pulses that coincided with active transcription from the LHY promoter at ZT 21 and ZT 24 abrogated the peak of LHY::luc expression (Figure 7B). This result concurred with the downregulation of LHY transcript levels observed at ZT 24 and ZT 28 (Figure 6). These pulses also advanced the following peak of CCR2::luc expression (data not shown). Delays of LHY::luc expression or early termination of the peak of luminescence were also observed in plants lacking function of either LHY or CCA1 (data not shown), or both (Figure 7C and D), when light signals were applied at comparable phase points of the LHY::luc rhythm.

Fig. 7. Effects of 1 h light pulses on expression of the LHY::luc reporter gene. Wild-type and lhy-11 cca1-1 plants were grown under light– dark cycles for 7 days, transferred to constant darkness at ZT 12 and exposed to 1 h pulses of white light (70–80 µmol/m2/s) at the times indicated by the open arrows (A, ZT 18; B, ZT 21; C, ZT 15; and D, ZT 18). Immediate effects on the peak of LHY:luc expression were observed when light pulses were applied 2–3 h before (A and C) and after (B and D) the onset of LHY:luc expression. Dampening levels of luminescence due to exhaustion of the luciferin substrate precluded detection of further oscillations in DD. Traces represent average data from individual seedlings or from groups of 10–15 seedlings, normalized to trough luminescence levels prior to the light pulse. Error bars indicate standard errors, and N indicates the number of plants analysed in each experiment.
The LHY::luc construct used in these experiments comprised the full-length 5′-untranslated region (5′-UTR; 667 bp) of the LHY gene as well as promoter sequences, and therefore may report both transcriptional and translational induction. In both wild-type and lhy-1 plants, abrupt increases in LHY::luc luminescence levels were observed at dawn under light–dark cycles, which were not observed in the absence of dark to light transitions (Figure 2D, time 72 h). Thus, patterns of LHY::luc expression might reflect both a circadian component and an acute translational response. Transient increases in LHY::luc luminescence were also observed in some experiments (data not shown), in response to short pulses of light.
Phase shifting responses in plants lacking function of LHY, CCA1 or both
Light-induced perturbations in the level of a specific component of the circadian oscillator should, in theory, reset the phase of the circadian cycle. However, plants lacking function of both LHY and CCA1 were capable of entrainment to light–dark cycles, indicating that at least one other component of the circadian system mediates resetting of circadian oscillations (Mizoguchi et al., 2002).
We reasoned that if LHY and CCA1 contributed to phase shifting responses, knockout mutations in either or both of these genes might result in delayed adjustment to altered light–dark cycles. In order to test this hypothesis, wild-type and mutant plants carrying a CCR2::luc reporter construct were grown under 12L:12D light–dark cycles. Luminescence was assayed over 24 h to determine the phase of the unperturbed rhythm, then the light–dark cycle was shifted by 12 h. Wild-type plants (Landsberg and Wassilewskija ecotypes, Ler and Ws) exhibited maximum expression of CCR2::luc at dusk (Figure 8A). Upon alteration of the light–dark cycle, Ler plants exhibited two consecutive phase delays, and a stable phase relationship relative to dawn and dusk was re-established at time 72 h. Phase shifting was slower in Ws plants, and the CCR2 rhythm only returned to its original phase by time 96 h. The pattern of phase resetting in the cca1-1 mutant was similar to that of its Ws parent (Figure 8B). However, the lhy-11 mutant adjusted to the new light–dark cycle more rapidly, and a broad peak of CCR2 expression centred on time 48 h suggested that resetting was already complete by that time. In the double loss-of-function mutant (lhy-11 cca1-1), the new phase observed at time 42 h was maintained for the rest of the experiment (Figure 8C). Analysis of LHY::luc expression in a parallel experiment also demonstrated rapid phase resetting in the absence of LHY and CCA1 function (data not shown). Knockout mutations in the LHY and CCA1 genes, therefore, enhanced the sensitivity of the clock to phase shifting light signals.

Fig. 8. Phase shifting responses to altered light–dark cycles in plants lacking function of LHY, CCA1 or both. Transgenic plants carrying a CCR2::luc reporter construct were grown under 12L:12D for 7 days prior to imaging. From time 24 h, the light–dark cycle was inverted, resulting in a 12 h phase shift. The experiment was carried out twice with similar results. White and black boxes at the top of the graphs indicate the intervals of light and darkness, respectively.
Discussion
Mechanism of driven rhythmicity in lhy-1 plants under light–dark cycles
Overexpression of the LHY and CCA1 transcripts abolished circadian rhythmicity under constant light (Schaffer et al., 1998; Wang and Tobin 1998), but diurnal rhythms of CAB (lhcb1*1), CCR2 and CAT2 gene expression were observed when CCA1-ox plants were exposed to daily light–dark cycles (Green et al., 2002). Here, we report similar driven rhythms of expression of CAB and CCR2 transcripts in lhy-1 plants.
Rhythmic expression of CAB and CCR2 in lhy-1 plants correlated with light-driven oscillations in LHY protein levels. Increases in CAB::luc expression coincided with light-induced accumulation of the LHY protein, suggesting that LHY may directly activate transcription from the CAB promoter, as previously shown for CCA1 (Wang et al., 1997). LHY and CCA1 bind an ‘evening element’ of the CCR2 promoter that is essential for rhythmic transcription (Harmer et al., 2000), and the pattern of CCR2 expression in antiphase with the LHY protein was consistent with direct repression of CCR2 transcription. It should be noted, however, that expression of the CCR2::luc reporter gene was reduced, rather than increased, in the absence of LHY and CCA1 function (H.R.Song and I.A.Carré, unpublished data) and, therefore, additional factors must contribute to its rhythmic expression.
In plants that carried overexpressed copies of LHY or CCA1, expression of the endogenous LHY and CCA1 transcripts was repressed in constant light, to a level corresponding to the trough of the rhythm of wild-type plants (Schaffer et al., 1998; Fowler et al., 1999). In CCA1-ox plants, light–dark cycles drove rhythmic expression of both mRNAs (Green et al., 2002). Under 8L:16D, the amplitude of these oscillations was comparable with that of wild-type plants. In contrast, in lhy-1 plants grown under 12L:12D, expression of the endogenous LHY and CCA1 transcripts was fully repressed. Rhythmic changes were observed, but increases in expression levels preceded dawn. These oscillations were abolished immediately upon transfer of lhy-1 plants to constant light, indicating that a dark period was required for subsequent anticipation of dawn (Figure 2D). The dark-induced decay of LHY protein levels may be sufficient for partial derepression of TOC1 transcription, and TOC1 protein accumulation during the night may then promote transcription of the LHY and CCA1 genes before dawn.
Light promotes translation of the LHY mRNA
Expression of the LHY transcript was constitutive in lhy-1 plants, but the LHY protein accumulated during the day and decayed during the night. Accumulation of the LHY protein was accelerated within 30 min of exposure to light. Light did not alter the rate of LHY protein turnover; therefore, we conclude that it must regulate translation of the LHY transcript.
Light-regulated translation has been described for specific chloroplast-encoded genes (Mayfield et al., 1995) and for a few nuclear genes such as ferredoxin-1 (Fed-1) in pea (Dickey et al., 1998). Circadian-regulated translation of a luciferase-binding protein (LBP), of a luciferase enzyme (LCF) and of a nuclear-encoded chloroplastic glyceraldehyde 3-phosphate dehydrogenase (GAPCp) has been described in Gonyaulax (Mittag et al., 1994, 1998; Mittag, 1996; Fagan et al., 1999). Translation of the wc1 transcript of Neurospora was also circadian and mediated rhythmic expression from a constitutive mRNA (Lee et al., 2000). Translational regulation is usually mediated by cis-acting sequences within the 5′- or 3′-UTR of the mRNA. The overexpressed transcript in lhy-1 and lhy-1TN104 mutant plants comprised 131 bp of the 5′-UTR sequence of the wild-type gene and a full-length, wild-type 3′-UTR (Schaffer et al., 1998). Either of these sequences may mediate translational regulation of the overexpressed LHY transcript in response to light signals. Further experiments will be required to determine which photoreceptor is important for increasing translation of LHY.
It should be noted that diurnal rhythmicity in CCA1-ox plants is unlikely to be mediated by translational regulation of CCA1 expression, as the coding region of the CCA1 transcript was expressed under the control of the 5′ upstream sequences of 35S (Wang and Tobin, 1998). The CCA1-ox transgene therefore does not comprise sequences that would confer translational regulation by light. Rhythmicity in these plants was proposed to be mediated by light-induced post-translational regulation of CCA1 activity, possibly mediated by the protein kinase CKII (Green et al., 2002). This does not exclude the possibility that the wild-type CCA1 transcript might exhibit light-driven translation.
Gated induction of LHY expression in wild-type plants
Previous work demonstrated that expression of the LHY transcript was induced by light in etiolated plants (Martinez-Garcia et al., 2000). Light–dark-driven changes in expression of endogenous LHY and CCA1 mRNAs have been described in CCA1-ox plants (Green et al., 2002), but it is not clear whether these represent acute responses to lights-on signals at dawn or reflect a process initiated by dusk as shown here for lhy-1. We demonstrate here that transcription of the LHY gene is not up-regulated acutely by light in light-grown plants. Expression of the endogenous LHY transcript was not responsive to light–dark cycles in de-etiolated lhy-1TN104 plants, although dark-grown seedlings exhibited normal responsiveness to light. Furthermore, we were unable to demonstrate increases in LHY transcript levels in wild-type plants that were exposed to 1 h light pulses between ZT 24 and ZT 40. Similar light pulses applied between ZT 15 and ZT 24 also failed to induce expression of an LHY::luc reporter construct. However, light modulated expression of LHY at the translational level, and increased levels of LHY protein were observed when light coincided with expression of the LHY mRNA at ZT 24. Translational induction of LHY protein synthesis relied on availability of the cognate transcript; therefore, responsiveness varied with a circadian rhythm.
Functional significance
Our results suggest a possible mechanism for the circadian modulation of light responses, a phenomenon referred to as gating. The light-induced synthesis of a transcription factor from a rhythmically expressed transcript may allow photic responses to be restricted to specific phases of the circadian cycle. The LHY and CCA1 proteins have been implicated in light regulation of CAB gene expression (Wang et al., 1997; Schaffer et al., 1998; Wang and Tobin, 1998), and induction of CAB::luc expression was gated by the circadian clock (Millar and Kay, 1996). Temporal changes in expression of the LHY mRNA may, therefore, determine the phases of the circadian cycle at which expression of CAB or other light-responsive genes is most responsive to light.
The pattern of LHY induction in Arabidopsis (Figure 6) did not correlate with published phase response curves for light signals (Covington et al., 2001). Maximum increases in LHY protein levels were observed at subjective dawn (ZT 24), whereas maximum advances or delays of circadian rhythms were obtained in the middle of the subjective night (ZT 18). In addition, plants lacking functional copies of LHY, CCA1 or both were not impaired in their ability to adjust to altered light–dark cycles (Figure 8) or to respond to short light pulses (Figure 7). We conclude from these results that effects of light on LHY and CCA1 transcription or translation do not mediate phase resetting of the circadian clock.
An unexpected finding was that light pulses that coincided with expression of the LHY transcript and caused translational induction of LHY protein synthesis also triggered rapid decreases in LHY mRNA and LHY::luc expression (Figures 6 and 7). This light-induced repression was not impaired by the lhy-11 and cca1-1 mutations, and therefore does not reflect negative feedback from these proteins. Light instead may interfere with the activity of a positive effector of LHY and CCA1 transcription. TOC1 is a good candidate, as it was shown recently to form complexes with the phytochrome B-regulated transcription factor PIF3 and with the related protein PIL1 (Makino et al., 2002). Alternatively, light might interfere with the action of ELF3, a negative regulator of light responses that also functions as a positive regulator of LHY expression (Schaffer et al., 1998; Covington et al., 2001; Liu et al., 2001).
Thus, the regulation of LHY expression by light is complex and varies with the stage of development. In etiolated seedlings, transcription of the LHY gene is regulated by phytochrome, a response mediated in part by PIF3 binding to a G-box sequence within the LHY promoter (Martinez-Garcia et al., 2000). A circadian clock is known to be functional in dark-grown seedlings, and its phase is set at the time of seed imbibition (Zhong et al., 1998). Therefore, light-induced transcription of LHY is not required to initiate function of the circadian oscillator. Elevated levels of LHY transcription may represent an adaptation of the circadian system that is required for its oscillation in the light. Further transcriptional induction may not be required in light-grown plants, where LHY mRNA levels already oscillate at relatively high levels. Under entraining light–dark cycles, the simultaneous translational induction and transcriptional repression of LHY expression may narrow the peak of LHY protein synthesis at dawn. A sharp, light-induced peak of LHY expression in the morning would be predicted to tighten the phase of expression of other clock components, as well as that of overt rhythms, thus increasing the precision of the circadian clock. In addition, the positive effect of light on LHY translation at subjective dawn may serve to drive high amplitude oscillations of LHY protein levels in constant light, and may contribute to the robustness of rhythmic phenotypes in free-running conditions.
Materials and methods
Plant materials and growth conditions
The lhy-1, lhy-1TN104, lhy-11, cca1-1 and CCA1-ox plants have been described elsewhere (Schaffer et al., 1998; Wang and Tobin, 1998; Green and Tobin, 1999; Mizoguchi et al., 2002), as have transgenic plants carrying the CAB::luc construct (Millar et al., 1992). For the construction of lhy-11 cca1-1 double mutants, F2 plants that were resistant to both hygromycin and kanamycin were rescreened by PCR to identify those that were homozygous for the Ds and T-DNA insertions characteristic of the lhy-11 and cca1-1 mutations. Primers used for detection of the wild-type and mutant alleles have been described previously (Schaffer et al., 1998; Green and Tobin, 1999).
For most experiments, plants were grown on solid Murashige and Skoog (MS) medium containing 3% sucrose (w/v) at 22°C in temperature-controlled incubators. Illumination was provided by ordinary white fluorescent bulbs (70–80 µmol/m2/cm). For the red light induction of LHY and CCA1 transcription, no sucrose was included in the medium. Imbibed seeds were exposed to white light for 30 min to induce germination, then transferred to an air-conditioned dark room maintained at 22°C. Eight-day-old etiolated seedlings were exposed to red light (25 µmol/m2/cm) from white fluorescent bulbs (Sylvania gro-lux) covered with two layers of filter (Fire red, Lee) for 2 min, then returned to darkness.
Construction of luciferase reporter fusions and generation of transgenic plants
Upstream sequences of LHY (1.7 kb of the LHY promoter and the 5′-UTR), CCA1 (1.4 kb of the CCA1 promoter and the 5′-UTR) or CCR2 (1.5 kb fragment of the CCR2 promoter fused to the Omega translational enhancer) were inserted upstream of a modified luciferase gene (luc+, Promega Corporation, Madison, WI) and of a nopaline synthase (nos) terminator sequence, in the binary vector pGreen (Hellens et al., 2000). Constructs were introduced into different genetic backgrounds by Agrobacterium-mediated transformation.
Analysis of luciferase expression patterns
Luciferase activity was imaged in vivo using liquid nitrogen-cooled or intensified photon-counting cameras (from Roper Scientific or Hamamatsu Corp., respectively). Plants were sprayed three times with a 5 mM solution of luciferin substrate within 24 h prior to imaging. For most experiments, luciferin application was repeated prior to each image, at a 1 mM concentration. Luminescence levels were quantified using the Metamorph™ software (Universal Imaging Corp.).
RNase protection assays
RNA was extracted using the Trizol reagent (Gibco-BRL) or the RNAeasy™ kit (Qiagen) according to the manufacturers’ protocol. RNA blot analysis of LHY transcript levels was carried out as described previously (Schaffer et al, 1998). For RNase protection assays, different ratios of hot and cold CTP were used in order to compensate for differences in expression levels of the transcripts. Reaction cocktails for CCA1, LHY and ACT2 probes contained 60 µCi of [32P]CTP (800 Ci/mmol, 20 µCi/µl, Amersham) and 1.28 µM cold CTP, whereas the CCR2 probe was generated using 40 µCi of [32P]CTP and 7.3 µM cold CTP. A 10 µg aliquot of total RNA was hybridized with riboprobes in 10 µl of hybridization buffer (24 mM PIPES pH 7, 0.86 M NaCl, 0.8 mM EDTA) at 82°C for 3 h. Unhybridized probes were digested by addition of 200 µl of the RNase reaction solution (300 mM sodium acetate, 0, 5 mM EDTA, 10 mM Tris–HCl pH 7.5) containing 120 U of RNase T1, for 30 min at 37°C. Protected fragments were separated by electrophoresis on an 8% (w/v) polyacrylamide–urea gel. Dried gels were exposed on PhosphorImager screens (Molecular Dynamics), and the intensity of bands generated from protected riboprobes was quantified using the ImageQuant™ software. CCA1, LHY and CCR2 transcript levels were normalized to those of ACT2.
LHY expression in Escherichia coli and production of antiserum
The LHY cDNA was amplified by PCR and the product was cloned into the pQE60 vector (Qiagen), resulting in fusion to a C-terminal hexahistidine tag. Bacterially expressed LHY-His6 protein was affinity purified under native conditions on an Ni-NTA–agarose™ column (Qiagen), concentrated using Centriplus™ (Amicon), and 50 µg aliquots emulsified with Freund’s adjuvant were injected into a rabbit at 2 week intervals. The serum obtained from the final bleed after the fifth injection was used without further purification.
Immunoblot analysis
Extraction buffer containing 20 mM HEPES–NaOH pH 7.6, 50 mM KCl, 10 mM EDTA, 2.5 mM MgCl2, 0.1% Triton X-100, 1 mM dithiothreitol (DTT), 0.1 mM phenylmethylsulfonyl fluoride (PMSF) and a protease inhibitor cocktail (Boehringer Mannheim) was added to frozen ground tissue. Homogenates were centrifuged for 10 min at 4°C, and protein concentrations were determined using a Bradford assay (Bio-Rad). Proteins were separated by electrophoresis on an 8% (w/v) SDS–polyacrylamide gel. The upper part of the gel was transferred to a nitrocellulose membrane (Amersham) for immunoblot analysis, and the lower part of the gel containing the large subunit of RUBISCO (RBCL) was stained with Coomassie Blue to compare amounts of loaded protein. Blots were incubated sequentially with 7% (w/v) skimmed milk powder, 0.25% (v/v) anti-LHY antiserum and 0.05% (v/v) peroxidase-conjugated donkey anti-rabbit IgG (Amersham), then developed using ECL reagent (Amersham). Exposed films were scanned using a desktop scanner (Deskscan™, Hewlett Packard) and protein bands were quantified using the Metamorph™ software (Universal Imaging Corp.).
In vivo protein labelling and immunoprecipitation
Seedlings were grown under light–dark cycles of 12 h light and 12 h darkness (12L:12D) for 15–20 days. To determine the half-life of the LHY protein, 3–6 plants were wounded with forceps and incubated in 0.5× MS medium containing [35S]methionine (1 mCi/ml) for 3 h. Plants were washed three times with 0.5× MS medium containing 1% methionine (w/v), and chased under light and dark conditions in the same medium containing 50 mM cycloheximide (Potuschak et al., 1998). Samples were harvested at different intervals and frozen in liquid nitrogen. To assay rates of LHY protein synthesis, plants were incubated in the presence of [35S]methionine as described above and the labelling was interrupted at different times.
For immunoprecipitation of [35S]methionine-labelled LHY protein, labelled tissue was extracted in 1 ml of NET-gel buffer [50 mM Tris–HCl pH 7.5, 150 mM NaCl, 1 mM EDTA, 0.1% (w/v) Tween-20, 1 mM PMSF, 0.25% (w/v) gelatine containing one tablet of protease inhibitor cocktail (Boehringer Mannheim) per 25 ml]. A 5 µl aliquot of anti-LHY serum was added and samples were incubated for 1 h at 4°C. In order to measure incorporation into total protein, a 5 µl aliquot was spotted onto nitrocellulose. The filter was washed three times with TBS buffer [20 mM Tris pH 7.5, 500 mM NaCl, 0.1% (v/v) Tween-20] to remove unincorporated radioactivity prior to exposure to film or to a PhosphorImager screen. A 50 µl aliquot of a 20% (v/v) suspension of protein A–Sepharose beads in NET-gel buffer was added to the remainder of the sample and incubated for a further hour. After extensive washing with NET-gel buffer and TBS buffer, bead complexes were dissolved in 1× Laemmli SDS sample buffer. Bound proteins were separated by electrophoresis on an 8% (w/v) SDS–polyacrylamide gel and analysed by autoradiography on film or PhosphorImager screen.
Acknowledgments
Acknowledgements
We are grateful to Lorenzo Frigerio for his help with immunoprecipitation experiments, George Coupland for the gift of the lhy-11 mutant prior to publication, and members of the circadian rhythm group at Warwick for help with imaging and for critical reading of the manuscript. This work was funded by a BBSRC grant and a Warwick Research fellowship to I.C. The low light video imaging facility at the University of Warwick was funded by the Gatsby Foundation and the BBSRC.
References
- Alabadi D., Oyama,T., Yanovsky,M.J., Harmon,F.G., Mas,P. and Kay,S.A. (2001) Reciprocal regulation between TOC1 and LHY/CCA1 within the Arabidopsis circadian clock. Science, 293, 880–883. [DOI] [PubMed] [Google Scholar]
- Alabadi D., Yanovsky,M.J., Mas,P., Harmer,S.M. and Kay,S.A. (2002) Critical role for CCA1 and LHY in maintaining circadian rhythmicity in Arabidopsis. Curr. Biol., 12, 757–761. [DOI] [PubMed] [Google Scholar]
- Cheng P., Yang,Y. and Liu,Y. (2001) Interlocked feed-back loops contribute to the robustness of the Neurospora circadian clock. Proc. Natl Acad. Sci. USA, 98, 7408–7413. [DOI] [PMC free article] [PubMed] [Google Scholar]
- Covington M.F., Panda,S., Liu,X.L., Strayer,C.S., Wagner,D.R. and Kay,S.A. (2001) ELF3 modulates resetting of the circadian clock in Arabidopsis. Plant Cell, 13, 1305–1315. [DOI] [PMC free article] [PubMed] [Google Scholar]
- Crosthwaite S.K., Loros,J.J. and Dunlap,J.C. (1995) Light-induced resetting of a circadian clock is mediated by a rapid increase in Frequency transcript. Cell, 81, 1003–1012. [DOI] [PubMed] [Google Scholar]
- Devlin P.F. and Kay,S.A. (2000) Cryptochromes are required for phytochrome signalling to the circadian clock but not for rhythmicity. Plant Cell, 12, 2499–2509. [DOI] [PMC free article] [PubMed] [Google Scholar]
- Dickey L.F., Petracek,M.E., Nguyen,T.T., Hansen,E.R. and Thompson,W.F. (1998) Light regulation of Fed-1 mRNA requires an element in the 5′ untranslated region and correlates with differential polyribosome association. Plant Cell, 10, 475–484. [DOI] [PMC free article] [PubMed] [Google Scholar]
- Dunlap J.C. (1999) Molecular bases for circadian clocks. Cell, 96, 271–290. [DOI] [PubMed] [Google Scholar]
- Fagan T., Morse,D. and Hastings,J.W. (1999) Circadian synthesis of a nuclear-encoded chloroplast glyceraldehyde-3-phosphate dehydrogenase in the dinoflagellate Gonyaulax polyhedra is translationally controlled. Biochemistry, 38, 7689–7695. [DOI] [PubMed] [Google Scholar]
- Field M.D., Maywood,E.S., O’Brien,J.A., Weaver,D.R., Reppert,S.M. and Hastings,M.H. (2000) Analysis of clock proteins in mouse SCN demonstrates phylogenetic divergence of the circadian clockwork and resetting mechanisms. Neuron, 25, 437–447. [DOI] [PubMed] [Google Scholar]
- Fowler S., Lee,K., Onouchi,H., Samach,A., Richardson,K., Morris,B., Coupland,G. and Putterill,J. (1999) GIGANTEA: a circadian clock-controlled gene that regulates photoperiodic flowering in Arabidopsis and encodes a protein with several possible membrane-spanning domains. EMBO J., 18, 4679–4688. [DOI] [PMC free article] [PubMed] [Google Scholar]
- Green R.M. and Tobin,E.M. (1999) Loss of the CIRCADIAN CLOCK-ASSOCIATED protein 1 in Arabidopsis results in altered clock-regulated gene expression. Proc. Natl Acad. Sci. USA, 96, 4176–4179. [DOI] [PMC free article] [PubMed] [Google Scholar]
- Green R.M., Tingay,S., Wang,Z.-Y. and Tobin,E.M. (2002) Circadian rhythms confer a higher level of fitness to Arabidopsis plants. Plant Physiol., 129, 576–584. [DOI] [PMC free article] [PubMed] [Google Scholar]
- Harmer S.L., Hogenesch,J.B., Straume,M., Chang,H.-S., Han,B., Zhu,T., Wang,X., Kreps,J.A. and Kay,S.A. (2000) Orchestrated transcription of key pathways in Arabidopsis by the circadian clock. Science, 290, 2110–2113. [DOI] [PubMed] [Google Scholar]
- Hellens R.P., Edwards,E.A., Leyland,N.R., Bean,S. and Mullineaux,P.M. (2000) pGreen: a versatile and flexible binary Ti vector for Agrobacterium-mediated plant transformation. Plant Mol. Biol., 42, 819–832. [DOI] [PubMed] [Google Scholar]
- Hicks K.A., Millar,A.J., Carré,I.A., Somers,D.E., Straume,M., Meeks-Wagner,D.R. and Kay,S.A. (1996) Conditional circadian dysfunction of the Arabidopsis early-flowering 3 mutant. Science, 274, 790–792. [DOI] [PubMed] [Google Scholar]
- Lee K., Loros,J.J. and Dunlap,J.C. (2000) Interconnected feed-back loops in the Neurospora circadian system. Science, 289, 107–110. [DOI] [PubMed] [Google Scholar]
- Liu X.L., Covington,M.F., Fankhauser,C., Chory,J. and Wagner,D.R. (2001) ELF3 encodes a circadian clock-regulated nuclear protein that functions in an Arabidopsis PHYB signal transduction pathway. Plant Cell, 13, 1293–1304. [DOI] [PMC free article] [PubMed] [Google Scholar]
- Makino S. et al. (2000) Genes encoding pseudo-response regulators: insight into His-to-Asp phosphorelay and circadian rhythms in Arabidopsis thaliana. Plant Cell Physiol., 41, 791–803. [DOI] [PubMed] [Google Scholar]
- Makino S., Matsushika,A., Kojima,M., Yamashino,T. and Mizuno,T. (2002) The APRR1/TOC1 quintet implicated in circadian rhythms of Arabidopsis thaliana: I. Characterization with APRR1-overexpressing plants. Plant Cell Physiol., 43, 58–69. [DOI] [PubMed] [Google Scholar]
- Martinez-Garcia J.F., Huq,E. and Quail,P.H. (2000) Direct targeting of light signals to a promoter element-bound transcription factor. Science, 288, 859–863. [DOI] [PubMed] [Google Scholar]
- Mayfield S.P., Yohn,C.B., Cohen,A. and Danon,A. (1995) Regulation of chloroplast gene expression. Annu. Rev. Plant Physiol. Plant Mol. Biol., 46, 147–166. [Google Scholar]
- McWatters H.G., Bastow,R.M., Hall,A. and Millar,A.J. (2000) The ELF3 zeitnehmer regulates light signalling to the circadian clock. Nature, 408, 716–719. [DOI] [PubMed] [Google Scholar]
- Merrow M., Brunner,M. and Roenneberg,T. (1999) Assignment of circadian function for the Neurospora clock gene Frequency. Nature, 399, 584–586. [DOI] [PubMed] [Google Scholar]
- Millar A.J. and Kay,S.A. (1996) Integration of circadian and phototransduction pathways in the network controlling CAB gene expression in Arabidopsis. Proc. Natl Acad. Sci. USA, 93, 15491–15496. [DOI] [PMC free article] [PubMed] [Google Scholar]
- Millar A.J., Short,S.R., Chua,N.-H. and Kay,S.A. (1992) A novel circadian phenotype based on firefly luciferase expression in transgenic plants. Plant Cell, 4, 1075–1087. [DOI] [PMC free article] [PubMed] [Google Scholar]
- Mittag M. (1996) Conserved circadian elements in phylogenetically diverse algae. Proc. Natl Acad. Sci. USA, 93, 14401–14404. [DOI] [PMC free article] [PubMed] [Google Scholar]
- Mittag M., Lee,D.H. and Hastings,J.W. (1994) Circadian expression of the luciferin-binding protein correlates with the binding of a protein to the 3′ untranslated region of its mRNA. Proc. Natl Acad. Sci. USA, 91, 5257–5261. [DOI] [PMC free article] [PubMed] [Google Scholar]
- Mittag M., Li,L. and Hastings,J.W. (1998) The mRNA level of the circadian regulated Gonyaulax luciferase remains constant over the cycle. Chronobiol. Int., 15, 93–98. [DOI] [PubMed] [Google Scholar]
- Mizoguchi T., Wheatley,K., Wright,L., Hanzawa,Y., Mizoguchi,M., Song,H.-R., Carré,I.A. and Coupland,G. (2002) LHY and CCA1 are partially redundant genes required to maintain circadian rhythms in Arabidopsis. Dev. Cell, 2, 629–641. [DOI] [PubMed] [Google Scholar]
- Myers M.P., Wager-Smith,K., Rothenfluh-Hilficker,A. and Young,M.W. (1996) Light-induced degradation of TIMELESS and entrainment of the Drosophila circadian clock. Science, 271, 1736–1740. [DOI] [PubMed] [Google Scholar]
- Naidoo N., Song,W., Hunter-Ensor,M. and Sehgal,A. (1999) A role for the proteasome in the light response of the timeless clock protein. Science, 285, 1737–1741. [DOI] [PubMed] [Google Scholar]
- Nelson D.C., Lasswell,J., Rogg,L.E., Cohen,M.A. and Bartel,B. (2000) FKF-1, a clock-controlled gene that regulates the transition to flowering in Arabidopsis. Cell, 101, 331–340. [DOI] [PubMed] [Google Scholar]
- Park D.H., Somers,D.E., Kim,Y.S., Choy,Y.H., Lim,H.K., Soh,M.S., Kim,H.J., Kay,S.A. and Nam,H.G. (1999) Control of circadian rhythms and photoperiodic regulation of flowering by the Arabidopsis GIGANTEA gene. Science, 285, 1579–1582. [DOI] [PubMed] [Google Scholar]
- Pittendrigh C.S. and Minis,D.H. (1964) The entrainment of circadian clocks by light and their role as photoperiodic clocks. Am. Nat., 98, 261–294. [Google Scholar]
- Potuschak T., Stary,S., Schlögelhofer,P., Becker,F., Nejinskaia,V. and Bachmair,A. (1998) PRT1 of Arabidopsis thaliana encodes a component of the plant N-end rule pathway. Proc. Natl Acad. Sci. USA, 95, 7904–7908. [DOI] [PMC free article] [PubMed] [Google Scholar]
- Schaffer R., Ramsay,N., Samach,A., Corden,S., Putterill,J., Carré,I.A. and Coupland,G. (1998) The late elongated hypocotyl mutation of Arabidopsis disrupts circadian rhythms and the photoperiodic control of flowering. Cell, 93, 1219–1229. [DOI] [PubMed] [Google Scholar]
- Schultz T.F., Kiyosue,T., Yanovsky,M.J., Wada,M. and Kay,S.A. (2001) A role for LKP2 in the circadian clock of Arabidopsis. Plant Cell, 13, 2659–2670. [DOI] [PMC free article] [PubMed] [Google Scholar]
- Somers D.E. and Quail,P.H. (1995) Phytochrome-mediated light regulation of PHYA- and PHYB-GUS transgenes in Arabipopsis thaliana seedlings. Plant Physiol., 107, 523–534. [DOI] [PMC free article] [PubMed] [Google Scholar]
- Somers D.E., Devlin,P.F. and Kay,S.A. (1998) Phytochromes and cryptochromes in the entrainment of the Arabidopsis circadian clock. Science, 282, 1488–1490. [DOI] [PubMed] [Google Scholar]
- Somers D.E., Schultz,T.F., Milnamow,M. and Kay,S.A. (2000) ZEITLUPE encodes a novel clock-associated PAS protein from Arabidopsis. Cell, 101, 319–329. [DOI] [PubMed] [Google Scholar]
- Strayer C., Oyama,T., Schultz,T.F., Raman,R., Somers,D.E., Mas,P., Panda,S., Kreps,J.A. and Kay,S.A. (2000) Cloning of the Arabidopsis clock gene TOC1, an autoregulatory response regulator homolog. Science, 289, 768–771. [DOI] [PubMed] [Google Scholar]
- Suarez-Lopez P., Wheatley,K., Robson,F., Onouchi,H., Valverde,F. and Coupland,G. (2001) CONSTANS mediates between the circadian clock and control of flowering in Arabidopsis. Nature, 410, 1116–1120. [DOI] [PubMed] [Google Scholar]
- Wang Z.-Y. and Tobin,E.M. (1998) Constitutive expression of the CIRCADIAN CLOCK ASSOCIATED (CCA1) gene disrupts circadian rhythms and suppresses its own expression. Cell, 93, 1207–1217. [DOI] [PubMed] [Google Scholar]
- Wang Z.Y., Kenigsbuch,D., Sun,L., Harel,E., Ong,M.S. and Tobin,E.M. (1997) A Myb-related transcription factor is involved in the phytochrome regulation of an Arabidopsis Lhcb gene. Plant Cell, 9, 491–507. [DOI] [PMC free article] [PubMed] [Google Scholar]
- Young M.W. and Kay,S.A. (2001) Time zones: a comparative genetics of circadian clocks. Nat. Rev. Genet., 2, 702–715. [DOI] [PubMed] [Google Scholar]
- Zhong H.H., Painter,J.E., Salomé,P.A., Straume,M. and McClung,C.R. (1998) Imbibition, but not release from stratification, sets the circadian clock in Arabidopsis seedling. Plant Cell, 10, 2005–2017. [DOI] [PMC free article] [PubMed] [Google Scholar]