

Abstract
Patients with the genetic disorder ataxia-telangiectasia (A-T) display a pleiotropic phenotype that includes neurodegeneration, immunodeficiency, cancer predisposition and hypersensitivity to ionizing radiation. The gene responsible is ATM, and Atm-knockout mice recapitulate most features of A-T. In order to study the involvement of oxidative stress in the A-T phenotype, we examined mice deficient for Atm and overexpressing human Cu/Zn superoxide dismutase (SOD1). We report that elevated levels of SOD1 exacerbate specific features of the murine Atm- deficient phenotype, including abnormalities in hematopoiesis and radiosensitivity. The data are consistent with the possibility that oxidative stress contributes to some of the clinical features associated with the A-T phenotype.
Keywords: ataxia-telangiectasia/Atm-knockout/oxidative stress/radiosensitivity/transgenic SOD1
Introduction
Ataxia-telangiectasia (A-T) is an autosomal genetic disorder characterized by progressive cerebellar degeneration, oculocutaneous telangiectasia, immunodeficiency, genomic instability, predisposition to lymphoreticular malignancies and extreme sensitivity to ionizing radiation (IR) and radiomimetic chemicals (for review see Lavin and Shiloh, 1997). The gene responsible, ATM, encodes a serine/threonine protein kinase that is a member of a family of PI3-kinase-like large proteins. ATM plays a crucial role in the rapid induction of multiple signaling pathways in response to IR-induced DNA damage, leading to DNA repair and activation of cell cycle checkpoints, and triggering multiple cellular stress responses (for review see Rotman and Shiloh, 1999). Atm-knockout (AtmKO) mice recapitulate most aspects of the human disease, exhibiting growth retardation, infertility, enhanced radiosensitivity, defects in T-lymphocyte maturation and a high frequency of thymic lymphomas (Barlow et al., 1996; Elson et al., 1996; Xu et al., 1996). However, a major characteristic of A-T, the overt cerebellar ataxia and degeneration of Purkinje neurons, is not clearly observed in these mice.
We have previously suggested that ATM may be involved either directly or indirectly in pathways of oxidative metabolism, and that absence of ATM results in preferential loss of vulnerable cells such as neurons and thymocytes due to a mild chronic increase in oxidative damage (Rotman and Shiloh, 1997a,b). Recent evidence indeed ties oxidative stress to some of the degenerative processes observed in A-T (Barlow et al., 1999; Reichenbach et al., 1999; Watters et al., 1999; Takao et al., 2000; Kamsler et al., 2001). Oxidative stress has been shown to be intrinsic in many diseases, including those involving neurodegeneration such as Parkinson’s and Alzheimer’s diseases (Gorman et al., 1996; Hogg, 1998). Cu/Zn superoxide dismutase (SOD1) plays a major role in cellular metabolism of oxygen radicals, through conversion of superoxide radicals to H2O2. We have previously created mice transgenic for human SOD1 (TgSOD), which overexpress this protein and display three to six times higher SOD1 activity than non-transgenic littermates (Avraham et al., 1988; Bar-Peled et al., 1996; Peled-Kamar et al., 1997). These mice have higher levels of hydrogen peroxide and hydroxyl radicals, leading to oxidative damage to the nervous and hematopoietic systems (Peled-Kamar et al., 1995, 1997; Bar Peled et al., 1996). As a result, affected cells are compromised and become more susceptible to stress conditions. To examine the relationship between ATM deficiency and aberrant cellular balance of oxidative species, we generated mice deficient for Atm that overexpress the human SOD1 protein. This novel genotype termed SAT (SOD1 and A-T) is null for Atm and homozygous for the human SOD1 transgene.
SAT mice display a marked enhancement of certain characteristics of AtmKO mice, such as defective T-cell development and increased radiosensitivity. The hypersensitivity of SAT mice to IR is manifested by defective regeneration of bone marrow and white blood cells, resulting in an increased rate of infections and mortality as compared with AtmKO mice. In contrast, SAT mice succumb to thymic lymphomas at a rate similar to that of AtmKO mice. These observations indicate a high sensitivity of Atm-deficient cells to alterations in the cellular balance of reactive oxygen species.
Results
Generation of SAT mice
Atm-deficient mice are infertile. The following breeding scheme, therefore, was applied in order to generate SAT mice: Atm heterozygotes (Atm +/–) were outbred with mice homozygous for the human SOD1 transgene (see Materials and methods). The resulting double heterozygotes were then inbred to produce mice bearing the following genotypes, which were used throughout this study: WT (Atm +/+ without the SOD1 transgene), TgSOD (Atm +/+ and homozygous for the SOD1 transgene), AtmKO (Atm –/– without the SOD1 transgene), SAT (Atm –/– and homozygous for the SOD1 transgene). All genotypes were viable and their distribution among progenies roughly followed Mendelian inheritance patterns. Quantification of SOD1 protein levels as well as enzymatic activity in the four genotypes was performed (Figure 1A). Brain, bone marrow, intestine and thymus of homozygous TgSOD and SAT mice had 3- to 5-fold higher SOD1 activity compared with AtmKO and non-transgenic control mice (Figure 1A).
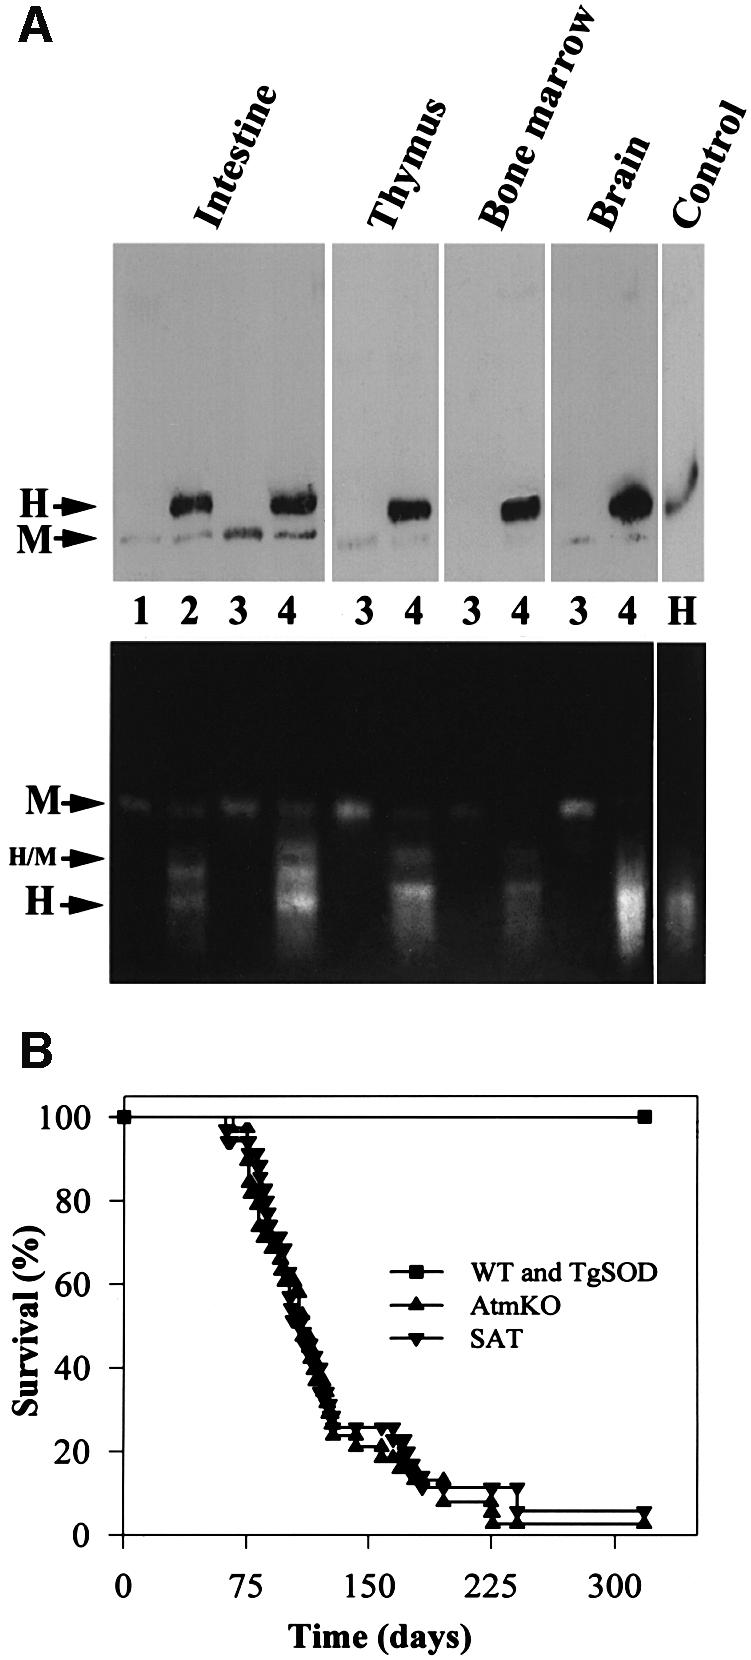
Fig. 1. Initial analyses of SAT mice. (A) Expression and activity of SOD1. Extracts (100 µg/µl) from duodenum, thymus, bone marrow and brain, as well as 1 µg of human recombinant SOD1 protein (control) were analyzed as described in Material and methods. Western blots (upper panel) were probed with anti-human SOD1 antibody, which also recognizes the mouse SOD1 protein. Activity gel assay (lower panel) depicts three distinct functional proteins: the human (H) and mouse (M) homodimers and human/mouse (H/M) heterodimer. Lanes 1, 2, 3 and 4 represent WT, TgSOD, AtmKO and SAT mice, respectively. (B) Development of thymic lymphomas. SAT mice (n = 35) and AtmKO mice (n = 38 mice) succumb to thymic lymphomas with similar kinetics.
Growth retardation and tumorigenesis in SAT mice
Atm-deficient mice are growth retarded (Barlow et al., 1996; Elson et al., 1996; Xu et al., 1996). The elevated levels of SOD1 activity in TgSOD mice also appear to contribute to growth retardation, but to a lesser degree (Table I). The combination of Atm deficiency and SOD1 overexpression in SAT mice resulted in further growth retardation throughout life (Table I). Hence, SAT mice of both sexes are smaller than controls (∼20%) and AtmKO (∼9%) littermates at the age of 1 and 2 months.
Table I. SOD1 overexpression increases the Atm-deficient mouse growth defect, regardless of gender.
| Age | Gender | Genotype | Number | Weight (g) | Change (%) |
|---|---|---|---|---|---|
| 26–30 days | male | WT | 12 | 18.90 ± 0.74 | – |
| male | TgSOD | 7 | 17.37 ± 1.51 | –8 | |
| male | AtmKO | 6 | 16.26 ± 0.76 | –14 | |
| male | SAT | 9 | 14.58 ± 0.80 | –23 | |
| female | WT | 8 | 15.65 ± 0.43 | – | |
| female | TgSOD | 10 | 14.30 ± 0.78 | –9 | |
| female | AtmKO | 8 | 14.06 ± 0.43 | –10 | |
| female | SAT | 10 | 12.69 ± 0.52 | –19 | |
| 54–58 days | male | WT | 15 | 26.30 ± 0.77 | – |
| male | TgSOD | 16 | 24.43 ± 0.67 | –7 | |
| male | AtmKO | 8 | 23.21 ± 1.19 | –12 | |
| male | SAT | 14 | 21.77 ± 0.71 | –17 | |
| female | WT | 5 | 20.00 ± 0.39 | – | |
| female | TgSOD | 8 | 20.08 ± 0.60 | 0 | |
| female | AtmKO | 7 | 18.70 ± 1.23 | –7 | |
| female | SAT | 5 | 15.98 ± 0.61 | –20 |
Weights of WT, TgSOD, AtmKO and SAT male and female mice. Data are presented for mice 1 week after weaning (26–30 days) and for adults (54–58 days).
While growth of SAT mice is retarded as compared with AtmKO mice, the rate at which these mice succumbed to thymic lymphoma was similar (Figure 1B). Cells from SAT tumors were monomorphic lymphoblasts, mostly double positive for the CD4 and CD8 cell surface receptors, as observed by hematoxylin–eosin staining and flow cytometry, respectively (not shown). These properties are similar to those reported previously for AtmKO thymic lymphomas (Barlow et al., 1996; Elson et al., 1996; Xu et al., 1996). TgSOD mice do not develop such tumors nor do they die prematurely.
SAT mouse pathology
Cerebellar ataxia, a major hallmark of A-T, results from progressive degeneration of existing neurons of the cerebellum, particularly Purkinje cells. Conflicting observations have been reported regarding the pathological changes in the cerebellum of Atm-deficient mouse strains (Barlow et al., 1996; Xu et al., 1996; Kuljis et al., 1997; Borghesani et al., 2000). SAT cerebellar sections from 3-month-old mice, stained with hematoxylin–eosin, showed no gross pathological abnormalities. Indeed, the Purkinje and granular cell layers and the nuclei of the cerebellum appeared morphologically intact (data not shown). While organs were generally smaller in SAT mice, histological analysis of the liver, spleen and kidney showed no apparent differences between the genotypes. Sections of testes and ovaries of SAT mice were similar to AtmKO littermates, demonstrating abnormal spermatogenesis and oogenesis (data not shown). As a consequence, both male and female SAT mice, like AtmKO mice, are infertile.
Hematopoietic defects in SAT mice
Lymphoid organs from SAT mice were smaller and the number of cells was 3- to 4.6-fold lower in the thymus and 2- to 3-fold lower in the spleen compared with AtmKO and control (TgSOD and WT) mice, respectively (Figure 2A and B). Maturation of thymocytes involves several stages of differentiation with regard to expression of CD4 and CD8 cell surface antigens. Early thymic cell populations are CD4 and CD8 double negative, and differentiate into CD4 and CD8 double-positive cells, which later mature into either CD4 or CD8 single-positive lymphocytes. Atm deficiency has a profound effect on T-cell development (for review see Xu, 1999), manifested by a significant decrease in the number of single-positive mature thymocytes, particularly that of the CD4+ cells, while the number of double-positive thymocytes is significantly increased. Accordingly, the number of T cells in the peripheral lymphoid organs of AtmKO mice is greatly reduced (Barlow et al., 1996; Elson et al., 1996; Xu et al., 1996).

Fig. 2. SOD1 overexpression combined with Atm deficiency causes severe defects in T-lymphocyte maturation. (A) Number of cells per thymus (mean ± SE), n = 6–9 animals for each genotype. The number of SAT thymocytes is clearly lower than that of AtmKO thymi, but the difference does not reach statistical significance. (B) Number of cells per spleen, n = 6–11 spleens for each genotype. (C) Representative flow cytometry scatter plots of lymphocyte-gated thymocytes stained for the CD4 and CD8 cell surface antigens. In the SAT thymus the CD4–/CD8– double-negative population at the bottom left quadrant does not mature toward the CD4+/CD8+ double-positive population observed in the top right quadrant, and the CD4+ and CD8+ single-positive populations, located at the bottom right and top left, respectively.
Using flow cytometry (Figure 2C and Table II), we observed defective differentiation of SAT thymocytes, manifested by a severe perturbation of CD4/CD8 double-negative cell maturation into the double-positive and single-positive thymocyte populations. As a result, the absolute number of CD4/CD8 double-negative cells in SAT mice is 2.6- to 2.9-fold higher than that observed in controls (WT and TgSOD) and AtmKO thymi, respectively. Percentage-wise, SAT thymi display a marked 7.6- and 11-fold increase in the frequency of CD4/CD8 double-negative cells as compared with AtmKO and control mice, respectively (Table II). In contrast to AtmKO mice, which show an increase in the frequency of CD4/CD8 double-positive cells (Barlow et al., 1996; Elson et al., 1996; Xu et al., 1996 and Table II), SAT mice display a significant 2-fold decrease in these cells (Table II). The frequency of CD4 and CD8 single-positive cells in SAT thymi was 3.3- and 1.6-fold lower than that of controls, but was not different from those of AtmKO mice (Table II). In addition, SAT thymi revealed a 2-fold and a 6-fold decrease in the percentage of CD3+ cells compared with AtmKO and control mice, respectively (Table II). The total number of CD3+ cells in the thymus of SAT mice is thus a striking 28-fold less than controls and 5.6-fold less than AtmKO mice. To characterize further SAT thymocytes we stained them for the T-cell-specific Thy 1.2 cell surface marker. Similar to all littermates, >90% of SAT thymocytes were Thy 1.2 positive (data not shown).
Table II. SOD1 overexpression combined with Atm deficiency affects maturation of T lymphocytes in the thymus.
| Tissue | Genotype | % cells with CD4, CD8, CD3 and B220 cell surface markers |
|||||
|---|---|---|---|---|---|---|---|
| CD4–/CD8– | CD4+/CD8– | CD4–/CD8+ | CD4+/CD8+ | CD3+ | B220 | ||
| Thymus | WT | 4.58 ± 0.29 | 12.28 ± 1.09 | 4.53 ± 0.47 | 78.62 ± 1.46 | 19.19 ± 4.60 | ND |
| TgSOD | 4.66 ± 0.95 | 12.14 ± 1.82 | 3.86 ± 0.60 | 79.35 ± 2.74 | 20.21 ± 2.26 | ND | |
| AtmKO | 6.83 ± 1.06 | 4.65 ± 0.65 | 2.32 ± 0.44 | 86.20 ± 1.78 | 6.29 ± 1.48 | ND | |
| SAT | 52.21 ± 11.65** | 3.69 ± 1.19 | 2.76 ± 0.49 | 41.34 ± 10.64** | 3.09 ± 1.68 | ND | |
| Spleen | WT | 77.60 ± 1.84 | 13.96 ± 0.97 | 7.45 ± 1.61 | 0.99 ± 0.26 | 22.79 ± 1.89 | 46.96 ± 3.66 |
| TgSOD | 72.82 ± 6.04 | 17.07 ± 6.23 | 9.08 ± 1.42 | 1.04 ± 0.23 | 26.27 ± 5.59 | 48.90 ± 3.68 | |
| AtmKO | 89.02 ± 1.53 | 5.94 ± 1.32 | 4.01 ± 0.75 | 1.03 ± 0.32 | 13.38 ± 2.99 | 53.70 ± 4.85 | |
| SAT | 89.58 ± 2.96 | 5.54 ± 2.57 | 4.09 ± 0.64 | 0.79 ± 0.08 | 15.92 ± 4.07 | 45.00 ± 6.02 | |
Flow cytometry analysis of lymphocyte-gated thymocytes and splenocytes, derived from 1-month-old mice. Values represent percentage of cells staining positive for cell surface molecules ± SEM, n ≥4 for all thymocyte samples. The differences between SAT and AtmKO double-negative (CD4–/CD8–) and double-positive (CD4+/CD8+) thymocytes are statistically significant (t = 5.650 and t = 6.037, respectively. In both cases **p <0.001 versus AtmKO mice).
In the spleen, analysis of CD4-, CD8- and CD3-expressing T cells showed similar frequencies in SAT and AtmKO mice, which were lower than in WT and TgSOD mice (Table II). Staining of splenocytes for the B220 cell surface marker (Table II) indicates normal maturation of B cells in AtmKO and SAT mice as compared with WT and TgSOD mice. Taken together, the above data indicate a block in T-lymphocyte development in SAT mice due to chronic overexpression of SOD1. The resulting oxidative insult affects T lymphogenesis in general, but particularly obstructs the transition of double- negative thymocytes to the double-positive T-cell stage. This differentiation block in SAT mice occurs at an earlier stage than the block seen in AtmKO mice in the transition of double-positive to single-positive T cells.
Hematopoiesis in adults is initiated within the bone marrow, which includes blast cells for all blood cell lineages. Leukocytes, the circulating mature white blood cells, represent both the myeloid (granulocyte and monocyte) and non-myeloid (lymphocyte) populations. Analysis of bone marrow showed that the number of nucleated cells in SAT mice (13 × 106 cells/femur) was lower than that in all of their littermates, with an ∼33% decrease from wild type and TgSOD controls and a 15% decrease compared with AtmKO mice. Of these cells, the number of nucleated erythroid cells in SAT mice was 35% lower than in controls, but only 9% lower than in AtmKO mice (Table III). The myeloid cell count was similarly affected, with a 31 and 11% decrease in SAT mice compared with control and AtmKO mice, respectively. The most significant decrease was found in the number of SAT bone marrow lymphoid cells, which was 35% lower than that of AtmKO mice and ∼43% lower than controls (Table III).
Table III. SOD1 overexpression combined with Atm deficiency affect several hematopoietic lineages.
| Genotype | Nucleated bone marrow cells/femur × 10–6 |
Peripheral blood leukocytes/ml × 10–6 |
|||
|---|---|---|---|---|---|
| Lymphoid | Myeloid | Erythroid | Lymphocytes | Myeloid | |
| WT | 3.33 ± 1.17 (17)a | 10.41 ± 2.29 (53) | 5.87 ± 0.98 (30) | 9.40 ± 0.23 (82) | 2.06 ± 0.33 (18) |
| TgSOD | 3.53 ± 0.61 (18) | 10.55 ± 0.81 (54) | 5.48 ± 0.20 (28) | 8.95 ± 0.88 (81) | 2.10 ± 0.55 (19) |
| AtmKO | 3.02 ± 0.80 (20) | 8.05 ± 0.80 (53) | 4.07 ± 0.16 (27) | 6.25 ± 0.08 (81) | 1.47 ± 0.24 (19) |
| SAT | 1.97 ± 0.65 (15) | 7.20 ± 0.65 (56) | 3.70 ± 0.52 (29) | 3.15 ± 0.21* (74) | 1.11 ± 0.27 (26) |
Differential counts of non-treated 1-month-old mice bone marrow and blood cells according to groups (n ≥3).
aNumbers within brackets indicate the percentage of total bone marrow or blood leukocytes, respectively. Differences between SAT and AtmKO blood lymphocytes are statistically significant (t = 6.186, *p <0.01 versus AtmKO mice).
Decreased numbers of circulating Atm-deficient leukocytes were reported previously (Barlow et al., 1996; Elson et al., 1996; Xu et al., 1996). Overall reduction of peripheral white blood cell counts was exacerbated in SAT mice, reaching a pronounced 45% and a 62% decrease compared with AtmKO and control animals, respectively (Table III). Accordingly, the total number of SAT lymphocytes showed a significant 50 and 66% decrease as compared with AtmKO and controls, and the myeloid numbers in SAT mice were 24 and 47% lower than AtmKO and control values, respectively (Table III). These results indicate that constitutive overexpression of SOD1 further affects the already compromised hematopoiesis in the absence of Atm, leading to a marked reduction in the number of peripheral white blood cells, as can be seen in SAT mice.
Radiation sensitivity of SAT mice
Ionizing radiation leads to formation of free radicals either directly upon reacting with a given molecule, or indirectly through surrounding water molecules (Bacq and Alexander, 1961). Radiosensitivity is an important feature of A-T and ATM-deficient cells (McKinnon, 1987; Taylor et al., 1989; Lavin, 1998). AtmKO mice are also hypersensitive to ionizing irradiation and succumb to irradiation more quickly and at lower doses than controls (Barlow et al., 1996). To evaluate the possible effect of elevated SOD1 on this radiosensitivity, we exposed SAT mice to two doses of γ-irradiation that are known to be either lethal (8 Gy) or sublethal (4 Gy) to wild-type mice. Following 8 Gy, SAT mice succumb somewhat more quickly than AtmKO mice; nevertheless, both exhibit higher radiosensitivity compared with WT and TgSOD mice (Figure 3A). As described previously for AtmKO mice (Barlow et al., 1996), the primary cause of death was found to be severe deterioration of the intestinal tract manifested by epithelial crypt degeneration and ulcer formation. The epithelial villi were severely blunted and shortened in the small intestine of SAT and AtmKO mice, while no blunting of the intestine was evident in control mice (Figure 3B). At day 5 post-irradiation, numerous foci of regenerating glands were observed in the intestine of WT and TgSOD mice, while AtmKO and SAT mice showed less or no foci of intestinal regeneration, respectively (Figure 3B). Contrary to the similar radiosensitivity of AtmKO and SAT mice at 8 Gy, SAT mice were markedly more susceptible than AtmKO and control mice to irradiation at 4 Gy (Figure 3C). No gastrointestinal deterioration was observed at 4 Gy and the difference in death kinetics of SAT mice following 4 Gy, as compared with 8 Gy, correlated with bone marrow depletion and hematopoietic failure (see below), leading to concomitant infection.

Fig. 3. Atm-deficient radiosensitivity is exacerbated by SOD1 overexpression. (A) Survival curves of WT, TgSOD, AtmKO and SAT mice following 8 Gy γ-irradiation (n = 5–7). At this dose the I50 of SAT mice is 4.8 days as compared with 5.7 days for AtmKO mice. (B) Hematoxylin–eosin-stained sections of small intestines of mice, 5 days after 8 Gy γ-irradiation; arrow (d) depicts blunting of the intestinal villi and arrow (r) corresponds to regions of hyperplasia and regeneration. (C) Survival curves following 4 Gy γ-irradiation. SAT mice are highly sensitive to this dose of radiation with an I50 of 11.27 days (n = 13). The I50 of AtmKO mice is 21.02 days (n = 17). None of the controls died at this dose. Using the Mann–Whitney method (two tailed), assuming non-parametric data, the difference between SAT and AtmKO mice survival is extremely significant (U = 14, **p <0.0001).
Loss of ATM has been shown to radiosensitize bone marrow cells (Westphal et al., 1998). We analyzed the depletion and regeneration of bone marrow cells following IR at 4 Gy (Figure 4A). In all four genotypes, a drastic decrease (>90%) in the number of bone marrow cells was observed at day 3 as compared with pre-irradiation levels (defined as 100%). Importantly, at day 8, recovery of bone marrow cellularity was detected in all mice except SAT. At this day control mice had 51% and AtmKO mice 36% of their original pre-irradiation levels, whereas SAT mice had only 10% of their already low pre-irradiation values. SAT bone marrow cell numbers at day 8 post-irradiation were ∼4-fold lower than for AtmKO mice, and ∼10-fold lower than control values. Histological sections of bone specimens correlated well with the observed pattern of bone marrow regeneration (data not shown). The decrease in SAT bone marrow cell populations at 8 days post-irradiation is documented in Figure 4B–D. SAT mice displayed a dramatic decrease in all types of hematopoietic precursor cells. The number of bone marrow lymphoid cells in SAT mice was 2.3-fold lower than in AtmKO mice and 9.6-fold lower than controls (Figure 4B). Nucleated erythroid cells also declined drastically in SAT mice, with a 4.2- and 5.4-fold decrease as compared with AtmKO mice and controls, respectively (Figure 4C). SAT myeloid cells showed a severe decline of 4.4- and 17-fold as compared with AtmKO and control littermates, respectively (Figure 4D). Within the myeloid group a specific marked decrease of bone marrow mature neutrophils was observed in irradiated SAT and AtmKO mice. Of note, these cells are the first defense-line against invading microorganisms.

Fig. 4. Regeneration of bone marrow cellularity in SAT mice is abrogated after 4 Gy γ-irradiation. (A) Percentage of nucleated bone marrow cells by time (relative to the pre-irradiation values of each genotype, defined as 100%). (B–D) Fraction of day 8 post-irradiation lymphoid, nucleated erythroid and myeloid cells relative to pre-irradiation counts. Note that in all instances SAT bone marrow regeneration is severely aberrant. However, at day 8 the differences between SAT and AtmKO mice do not reach statistical significance. Myeloid cells are particularly sensitive to this dose of irradiation.
Depletion and regeneration of circulating leukocytes in response to IR is depicted in Figure 5A. At day 1 post-irradiation, AtmKO and SAT leukocytes appear less sensitive to γ-irradiation. By day 3, a significant decrease of these cells was still evident in all genotypes as compared with pre-irradiation levels, although leukocytes from AtmKO mice remained less affected. In contrast to the bone marrow regeneration described above, no significant increase in blood leukocytes at day 8 post-irradiation was observed in all four genotypes (Figure 5A). At this day the lowest number of circulating leukocytes was observed in SAT mice (∼200 000 cells/ml blood). A relative radiation resistance is evident at day 8 post-irradiation in AtmKO circulating lymphocytes (Figure 5B). These observations are in agreement with previously published data showing that A-T lymphocytes and lymphoblastoid cell lines are more resistant to IR-induced apoptosis (Duchaud et al., 1996; Takagi et al., 1998), and that irradiated AtmKO lymphoid tissues possessed more residual cells than control tissues (Barlow et al., 1996). The relative resistance of Atm-deficient lymphocytes to apoptosis reflects a requirement for ATM in the activation of apoptotic pathways following IR exposure (Vit et al., 2000). This requirement is cell-type specific and is also observed in Atm-deficient thymocytes (Xu and Baltimore, 1996; Westphal et al., 1997) and developing neurons (Herzog et al., 1998), but not in other cell types such as fibroblasts (Duchaud et al., 1996) and astrocytes (Gosink et al., 1999).

Fig. 5. Irradiation-induced depletion of circulating leukocytes is prominent in SAT mice. (A) Percentage of leukocyte depletion (relative to the pre-irradiation values of each genotype) following 4 Gy γ-irradiation. At day 1, a difference between the levels of AtmKO and control leukocytes (n ≥6 for each genotype) is observed, with AtmKO and SAT mice being less sensitive to this treatment. At day 8, leukocyte regeneration in SAT mice is abrogated as compared with controls. (B and C) Percentage of lymphocytes and myeloid cells from their pre-irradiation counts. At day 8 post-irradiation, lymphocyte numbers in SAT mice are significantly lower than AtmKO mice (t = 8.79, **p <0.001 versus AtmKO mice).
Severe lymphopenia was prevalent in irradiated SAT mice, as their pre-irradiation lymphocyte levels were already extremely low (Table III). Thus, the absolute number of circulating SAT lymphocytes at day 8 post-irradiation (0.14 × 10⁶ cells/ml) was only 19% of that found in irradiated control mice (0.74 × 10⁶ cells/ml). As a consequence of lymphocyte depletion following irradiation, the SAT thymus shrinks drastically and becomes void of lymphocytes (data not shown).
SAT blood myeloid cell numbers (granulocytes and monocytes) at day 8 after irradiation showed a 2- and 5-fold decrease as compared with AtmKO and control mice, respectively (Figure 5C). While a massive depletion of SAT erythroid precursor cells in the bone marrow was evident at day 8 (Figure 4C), the absolute number of circulating erythrocytes scarcely changed in all genotypes (data not shown). This is probably due to reduced sensitivity to radiation and oxidative stress, and longer turnover time of erythrocytes as compared with leukocytes. Hematopoietic failure in irradiated SAT mice may reflect severe sensitivity of mature cells in these mice, defective migration from bone marrow to the peripheral blood or a defect in precursor cells. The latter give rise to mature cells through multiplication and differentiation influenced by hematopoietic regulatory cytokines. It was therefore important to determine whether the number of hematopoietic precursor cells in the bone marrow of these mice reflected abnormalities in repopulation and/or sensitivity following irradiation. The efficacy of myeloid growth and differentiation can be analyzed by surveying the colony-forming abilities of the bone marrow granulocyte/macrophage precursors in vitro (Pluznik and Sachs, 1965). These granulocyte/macrophage colony-forming cells (CFU-GM), stimulated with either granulocyte/macrophage colony-stimulating-factor (GM-CSF) or interleukin 3 (IL-3) growth factors, proliferate to form granulocyte, macrophage and mixed granulocyte-macrophage colonies. Using GM-CSF, analysis of CFU-GM showed that untreated SAT mice had an average of 18 and 46% reduction in the number of colony-forming cells in bone marrow as compared with AtmKO and control mice, respectively (Figure 6A). Similar results were obtained when CFU-GM was assayed with IL-3 (data not shown). Colony-forming abilities of bone marrow granulocyte/macrophage precursor cells from day 8 post-irradiated (4 Gy) SAT mice were almost completely abolished while those of AtmKO mice were severely compromised (Figure 6B). Surprisingly, although colony-forming ability was also markedly reduced in irradiated WT and TgSOD mice, there were more CFU-GM in the bone marrow of TgSOD mice than in WT mice (Figure 6B). The origin for this phenomenon is not clear.

Fig. 6. SAT granulocyte/macrophage progenitor cell colony-forming abilities are severely abrogated following γ-irradiation. (A) Colony-forming ability of granulocyte/macrophage progenitor cells in the presence of GM-CSF (n ≥5). Data are presented as mean ± SE. (B) Colony-forming abilities of granulocyte/macrophage progenitor cells following 4 Gy γ-irradiation. Bone marrow cells were extracted from the mice 8 days after treatment (n = 3, for each genotype). Data refer to number of CFU-GM per mouse femur.
The data presented above suggest that the extreme sensitivity of SAT mice to sublethal doses of γ-radiation results primarily from cellular depletion of bone marrow and peripheral leukocyte pools. This assumption was supported by post-mortem analysis, which revealed widespread streptococcal infection in the respiratory tract, micrococcal colonies in the kidneys and lungs, and sepsis in four out of six SAT mice (data not shown). To verify bacterial pathogens as the cause of death we irradiated SAT mice and divided them into two groups: the first was treated with the broad-spectrum antibiotic trimethoprim sulphadoxine, while the second was treated with saline. Antibiotic treatment of SAT mice resulted in an almost 2-fold increase in survival as five of eight treated, but only three of nine non-treated, mice (63 versus 33%) were alive at day 30 following 4 Gy γ-irradiation.
Discussion
Recent reports provided convincing evidence that certain Atm-deficient tissues and cells are under oxidative stress. This seems to be the case particularly in the cerebellum, where high levels of hydroxyl radicals were detected (L.Dugan, personal communication), as well as a dramatic increase in heme oxygenase activity (Barlow et al., 1999) and alterations of cellular antioxidant defense mechanisms (Kamsler et al., 2001), including a significant reduction in catalase activity. Lower levels of catalase activity were also reported in A-T cells (Vuillaume et al., 1986; Watters et al., 1999). Additionally, the plasma of A-T patients has lower antioxidative capacity (Reichenbach et al., 1999)
SOD1 is responsible for dismutation of superoxide radicals into molecular oxygen and hydrogen peroxide (for review see Culotta, 2000). Catalase, the subsequent enzyme in this pathway, converts hydrogen peroxide into water and molecular oxygen. High levels of SOD1 activity such as in TgSOD and SAT mice, without a concomitant increase in catalase, could cause escalation of the Fenton reaction producing hydroxyl radical from hydrogen peroxide (Yim et al., 1990, 1993; Peled-Kamar et al., 1997). Reduction of catalase activity in AtmKO mice (Kamsler et al., 2001) will probably enhance the Fenton reaction in SAT mice. In addition, exposing the mice to IR will further exacerbate the oxidative stress through increased production of cellular hydrogen peroxide and hydroxyl radical (Bacq and Alexander, 1961).
While elevated activity of SOD1 in TgSOD mice causes thymic abnormalities manifested by sensitivity of TgSOD thymocytes and bone marrow cells to lipopolysaccharide injection (Peled-Kamar et al., 1995), it does not result in overt phenotypic defects in hematopoiesis or enhanced radiosensitivity (this study). Loss of Atm, on the other hand, through an as yet unknown mechanism, causes a decrease in antioxidant defense mechanisms concomitant with an increase in oxidative damage (Barlow et al., 1999; Kamsler et al., 2001). It seems that particularly vulnerable cells, such as bone marrow and circulating white blood cells as well as neurons, progressively succumb to this chronic stress. Under this state of reduced antioxidative capacity, the effect of additional oxidative insults on these already compromised cells can be substantial.
Indeed, our results demonstrate that elevated levels of SOD1, which in an Atm +/+ background leads only to a moderate state of oxidative stress, exacerbate the degenerative processes observed in the absence of Atm, namely growth retardation and defective maturation of T cells. In addition, the radiosensitivity of Atm-deficient mice is significantly augmented by overexpression of SOD1, due to the inability of the SAT hematopoietic system to regenerate following exposure to sublethal doses of radiation. Interestingly, predisposition to thymic lymphomas is not enhanced in SAT mice, indicating that oxidative stress does not contribute to tumorigenesis in the AtmKO mouse. Therefore, these malignancies probably stem from defective induction of Atm-dependent cell cycle checkpoints and DNA repair, leading to genomic instability.
The oxidative changes in the cerebella of Atm-deficient mice do not lead to overt ataxia or to gross cerebellar degeneration and histological abnormalities (Barlow et al., 1996; Xu et al., 1996), although one strain of Atm-deficient mice was reported to exhibit mild non-progressive alterations in the Purkinje cell layer (Borghesani et al., 2000). Nonetheless, an abnormal physiology of the Atm-deficient nervous system is suggested by behavioral tests of motor function, as these mice show neurological dysfunction and deficits in motor learning (Barlow et al., 1996; Eilam et al., 1998; Borghesani et al., 2000). Some of the motor defects in Atm-deficient mice were reported to result from degeneration of the dopaminergic neurons of the substantia nigra compacta and could be reversed by l-dopa (Eilam et al., 1998). Similar to AtmKO mice, gross pathological changes were not detected in SAT cerebella; however, further physiological and biochemical analyses of these and other organs need to be carried out.
We propose that oxidative stress contributes to many, although not all of the phenotypic features of A-T; in particular, radiosensitivity and thymic degeneration, and possibly other degenerative processes leading to premature aging and neurodegeneration. In view of our results, the use of antioxidants may be useful in treatment of patients with the aim of ameliorating certain clinical symptoms of the disease and slowing its progression. The AtmKO and SAT mouse models may be used to evaluate the efficacy of such treatments.
Materials and methods
Genetic backgrounds and characterization of mice
AtmKO mice were on a 129/C57 background (Elson et al., 1996) and TgSOD mice (line 51; Avraham et al., 1988) were derived from the outbred matings of BALB/c × C57BL/6J with C57BL/6J × DBA strains. Atm genotypes were determined in two separate tests, either by Southern blot analysis or genomic PCR, distinguishing between the wild-type and knockout alleles. The presence of the human SOD1 transgene was determined by genomic PCR. SOD1 homozygosity was verified by backcrossing with wild-type animals. Mice were housed in a pathogen-free environment under standard conditions and maintained on a 12:12 h light/dark cycle with food and water ad libitum. The procedures employed in this study were approved by the animal care and use committee of the Weizmann Institute and conformed to NIH guidelines.
Quantification of SOD1
Human and murine SOD1 enzymes show a difference in migration in both denatured and non-denatured PAGE. For western blot analysis, tissue extracts were solubilized in RIPA buffer (10 mM Tris–HCl pH 7.2, 150 mM NaCl, 1% Triton X-100, 0.1% SDS, 1% deoxycholate and 5 mM EDTA) supplemented with protease inhibitors (Protease inhibitor cocktail, Sigma, Israel), and 100 µg of protein were subjected to SDS– gel electrophoresis, blotted onto nitrocellulose membranes and incubated with anti-human SOD1 antibodies. The second antibody used was horseradish peroxidase linked to protein A. Detection was by the ECL (enhanced chemiluminescent) reaction and exposure to X-ray film. For the SOD1 gel activity assay, extracts and analysis were performed as reported previously (Peled-Kamar et al., 1995).
Growth measurements and histology
SAT mice were weighed at weekly intervals beginning at weaning (19–21 days) through adulthood (82–86 days). Tissues were removed, fixed in 10% buffered formalin, embedded in paraffin blocks, sectioned at 7 µm and stained with hematoxylin and eosin. Sections were photographed at the magnifications indicated.
Irradiation treatments
One-month-old mice were irradiated with 4 or 8 Gy at a dose of 0.69 Gy/min using a 60Cobalt source (Nordion Gammabeam 150, Canada). Mice were subsequently housed together and examined for clinical symptoms. To study the effect of antibiotics on SAT mice survival, irradiated mice were injected daily subcutaneously with 120 mg/kg of trimethoprim sulphadoxine (Doxyprim; Vitamed, Israel) or saline for a period of 2 weeks, and the number of surviving mice was determined.
Blood and bone marrow cell staining
Circulating blood was drawn from the orbital sinus. Femur bones were flushed with Dulbecco’s modified Eagle’s medium (DMEM) through the shaft of individually dissected femora, and bone marrow cells were centrifuged onto glass slides using a Cytospin (Shandon Products). Both blood smears and bone marrow cell cytospin preparations were stained by the May–Grunwald–Giemsa technique and analyzed morphologically for differential cell counts under a microscope by two independent observers. Total nucleated bone marrow and peripheral blood leukocyte numbers were determined by counting using a hemacytometer.
Bone marrow progenitor colony-forming assays
Cells prepared as indicated above were seeded in duplicate (5 × 10⁴ or 25 × 104 cells per 35 mm Petri dish), in a 0.8 ml layer of 0.3% agar on top of a 2.5 ml 0.5% agar layer (Pluznik and Sachs, 1965). Both layers contained DMEM and 20% heat-inactivated horse serum. Recombinant mouse GM-CSF or IL-3 (1 ng/ml) were included in the bottom layer. The cells in agar were cultured at 37°C in a 10% CO2 atmosphere and the number of granulocytes and/or macrophage colonies (>50 cells/colony) were counted under a microscope 7 days after seeding.
Flow cytometry analysis
Samples were obtained from adult mice (30–45 days old). Cells prepared from thymus, spleen and thymic tumors were stained with fluorescent antibodies and subjected to flow cytometry (FACScan, Becton Dickinson). Data were analyzed with the Cell Quest software package. The following monoclonal antibodies were used in this study: fluorescein-conjugated rat anti-mouse CD4/L3T4 (Southern Biotechnology Associates; Birmingham, AL; clone GK1.5), R-phycoerythrin-conjugated rat anti-mouse CD8α/Lyt-2 (clone 53-6.7), spectral red-conjugated hamster anti-mouse CD3ε (clone 145-2C11) and fluorescein-conjugated rat anti-mouse CD45R (BB20) (IQ products; Groningen, The Netherlands, clone RA3-6B2). Thy 1.2 goat anti-mouse antibodies were a gift from Dov Zippori of the Weizmann Institute.
Statistical analysis
Unless noted, comparative analysis of SAT and AtmKO data was performed by Student’s t-test.
Acknowledgments
Acknowledgements
We thank Yehudit Hermesh and Shoshana Grossfeld for their technical work, Alon Hermalin for his help with histological analysis, Raya Eilam and Cathy Harris-Cerrutti for their valuable discussions and advice. The work was supported by grants from the Commission of the European Community’s Biomedicine and Health research program BIOMED II No. PL963039 and the Shapell family biomedical research foundation at the Weizmann Institute (to Y.G.), and the A-T Medical Research Foundation, the A-T Children’s Project and the Thomas Appeal (to Y.S.).
References
- Avraham K.B., Schickler,M., Sapoznikov,D., Yarom,R. and Groner,Y. (1988) Down’s syndrome: Abnormal neuromuscular junction in tongue of transgenic mice with elevated levels of human Cu/Zn-superoxide dismutase. Cell, 54, 823–829. [DOI] [PubMed] [Google Scholar]
- Bacq Z.M. and Alexander,P. (1961) Fundamentals of radiobiology. In Alexander,P. and Bacq,Z.M. (eds), Modern Trends in Physiological Sciences. Pergamon Press, Oxford, UK.
- Barlow C. et al. (1996) Atm-deficient mice: A paradigm of ataxia-telangiectasia. Cell, 86, 159–171. [DOI] [PubMed] [Google Scholar]
- Barlow C., Dennery,P.A., Shigenaga,M.K., Smith,M.A., Morrow,J.D., Jackson Roberts,L.,II, Wynshaw-Boris,A. and Levine,R.L. (1999) Loss of ataxia-telangiectasia gene product causes oxidative damage in target organs. Proc. Natl Acad. Sci. USA, 96, 9915–9919. [DOI] [PMC free article] [PubMed] [Google Scholar]
- Bar-Peled O., Korkotian,E., Segal,M. and Groner,Y. (1996) Constitutive overexpression of Cu/Zn superoxide dismutase exacerbates kainic acid-induced apoptosis of transgenic Cu/Zn superoxide dismutase neurons. Proc. Natl Acad. Sci. USA, 93, 8530–8535. [DOI] [PMC free article] [PubMed] [Google Scholar]
- Borghesani P.R. et al. (2000) Abnormal development of Purkinje cells and lymphocytes in Atm mutant mice. Proc. Natl Acad. Sci. USA, 97, 3336–3341. [DOI] [PMC free article] [PubMed] [Google Scholar]
- Culotta V.C. (2000) Superoxide dismutase, oxidative stress, and cell metabolism. Curr. Top. Cell Regul., 36, 117–132. [DOI] [PubMed] [Google Scholar]
- Duchaud E., Ridet,A., Stoppa-Lyonnet,D., Janin,N., Moustacchi,E. and Rosselli,F. (1996) Deregulated apoptosis in ataxia telangiectasia: association with clinical stigmata and radiosensitivity. Cancer Res., 56, 1400–1404. [PubMed] [Google Scholar]
- Eilam R., Peter,Y., Elson,A., Rotman,G., Shiloh,Y., Groner,Y. and Segal,M. (1998) Selective loss of dopaminergic nigro-striatal neurons in brains of Atm-deficient mice. Proc. Natl Acad. Sci. USA, 95, 12653–12656. [DOI] [PMC free article] [PubMed] [Google Scholar]
- Elson A., Wang,Y., Daugherty,C., Morton,C., Zhou,F., Campos-Torres,J. and Leder,P. (1996) Pleiotropic defects in ataxia telangiectasia protein deficient mice. Proc. Natl Acad. Sci. USA, 93, 13084–13089. [DOI] [PMC free article] [PubMed] [Google Scholar]
- Gorman A.M., McGowan,A., O’Neill,C. and Cotter,T. (1996) Oxidative stress and apoptosis in neurodegeneration. J. Neurol. Sci., 139, 45–52. [DOI] [PubMed] [Google Scholar]
- Gosink E.C., Chong,M.J. and McKinnon,P.J. (1999) Ataxia telangi ectasia mutated deficiency affects astrocyte growth but not radiosensitivity. Cancer Res., 59, 5294–5298. [PubMed] [Google Scholar]
- Herzog K.H., Chong,M.J., Kapsetaki,M., Morgan,J.I. and McKinnon,P.J. (1998) Requirement for Atm in ionizing radiation-induced cell death in the developing central nervous system. Science, 280, 1089–1091. [DOI] [PubMed] [Google Scholar]
- Hogg N. (1998) Free radicals in disease. Semin. Reprod. Endocrinol., 16, 241–248. [DOI] [PubMed] [Google Scholar]
- Kamsler A., Daily,D., Hochman,A., Stern,N., Shiloh,Y., Rotman,G. and Barzilai,A. (2001) Increased oxidative stress in ataxia-telangiectasia evidenced by alterations in redox state of brains from Atm-deficient mice. Cancer Res., in press. [PubMed] [Google Scholar]
- Kuljis R.O., Xu,Y., Aguila,M.C. and Baltimore,D. (1997) Degeneration of neurons, synapses and neuropil and glial activation in a murine Atm knockout model of ataxia-telangiectasia. Proc. Natl Acad. Sci. USA, 94, 12688–12693. [DOI] [PMC free article] [PubMed] [Google Scholar]
- Lavin M.F. (1998) Radiosensitivity and oxidative signaling in ataxia-telangiectasia: an update. Radiother. Oncol., 47, 113–123. [DOI] [PubMed] [Google Scholar]
- Lavin M.F. and Shiloh,Y. (1997) The genetic defect in ataxia-telangiectasia. Annu. Rev. Immunol., 15, 177–202. [DOI] [PubMed] [Google Scholar]
- McKinnon P.J. (1987) Ataxia-telangiectasia: an inherited disorder of ionizing radiation sensitivity in man. Hum. Genet., 75, 197–208. [DOI] [PubMed] [Google Scholar]
- Peled-Kamar M., Lotem,J., Okon,E., Sachs,L. and Groner,Y. (1995) Thymic abnormalities and enhanced apoptosis of thymocytes and bone marrow cells in transgenic mice overexpressing Cu/Zn-superoxide dismutase: implications in Down syndrome. EMBO J., 14, 4985–4993. [DOI] [PMC free article] [PubMed] [Google Scholar]
- Peled-Kamar M., Lotem,J., Wirguin,I., Weiner,L., Hermalin,A. and Groner,Y. (1997) Oxidative stress mediates impairment of muscle function in transgenic mice with elevated levels of wild-type Cu/Zn-superoxide dismutase. Proc. Natl Acad. Sci. USA, 94, 3883–3887. [DOI] [PMC free article] [PubMed] [Google Scholar]
- Pluznik D.H. and Sachs,L. (1965) The cloning of normal ‘mast’ cells in tissue culture. J. Cell. Physiol., 66, 319–324. [DOI] [PubMed] [Google Scholar]
- Reichenbach J., Schubert,R., Schwan,C., Müller,K., Böhles,H.J. and Zielen,S. (1999) Anti-oxidative capacity in patients with ataxia-telangiectasia. Clin. Exp. Immunol., 117, 535–539. [DOI] [PMC free article] [PubMed] [Google Scholar]
- Rotman G. and Shiloh,Y. (1997a) The ATM gene and protein: possible roles in genome surveillance, checkpoint controls and cellular defense against oxidative stress. Cancer Surv., 29, 285–304. [PubMed] [Google Scholar]
- Rotman G. and Shiloh,Y. (1997b) Ataxia-telangiectasia: is ATM a sensor of oxidative damage and stress? BioEssays, 19, 911–917. [DOI] [PubMed] [Google Scholar]
- Rotman G. and Shiloh,Y. (1999) ATM: a mediator of multiple responses to genotoxic stress. Oncogene, 18, 6135–6144. [DOI] [PubMed] [Google Scholar]
- Takagi M. et al. (1998) Defective control of apoptosis, radiosensitivity and spindle checkpoint in ataxia telangiectasia. Cancer Res., 58, 4923–4929. [PubMed] [Google Scholar]
- Takao N., Li,Y. and Yamamoto,K. (2000) Protective roles for ATM in cellular response to oxidative stress. FEBS Lett., 472, 133–136. [DOI] [PubMed] [Google Scholar]
- Taylor A.M.R., Metcalfe,J.A. and McConville,C. (1989) Increased radiosensitivity and the basic defect in ataxia-telangiectasia. Int. J. Radiat. Biol., 56, 677–684. [DOI] [PubMed] [Google Scholar]
- Vit J.P., Moustacchi,E. and Rosselli,F. (2000) ATM protein is required for radiation-induced apoptosis and acts before mitochondrial collapse. Int. J. Radiat. Biol., 76, 841–851. [DOI] [PubMed] [Google Scholar]
- Vuillaume M., Calvayrac,R., Best-Belpomme,M., Tarroux,P., Hubert,M., Decroix,Y. and Sarasin,A. (1986) Deficiency in the catalase activity of xeroderma pigmentosum cell and simian virus 40-transformed human cell extracts. Cancer Res., 46, 538–544. [PubMed] [Google Scholar]
- Watters W. et al. (1999) Localization of a portion of extranuclear ATM to peroxisomes. J. Biol. Chem., 274, 34277–34282. [DOI] [PubMed] [Google Scholar]
- Westphal C.H., Rowan,S., Schmaltz,C., Elson,A., Fisher,D.E. and Leder,P. (1997) Atm and p53 cooperate in apoptosis and suppression of tumorigenesis, but not in resistance to acute radiation toxicology. Nature Genet., 16, 397–401. [DOI] [PubMed] [Google Scholar]
- Westphal C.H., Hoyes,K.P., Canman,C.E., Huang,X., Kastan,M.B., Hendry,J.H. and Leder,P. (1998) Loss of atm radiosensitizes multiple p53 null tissues. Cancer Res., 58, 5637–5639. [PubMed] [Google Scholar]
- Xu Y. (1999) ATM in lymphoid development and tumorigenesis. Adv. Immunol., 72, 179–189. [DOI] [PubMed] [Google Scholar]
- Xu Y. and Baltimore,D. (1996) Dual roles of ATM in the cellular response to radiation and cell growth control. Genes Dev., 10, 2401–2410. [DOI] [PubMed] [Google Scholar]
- Xu Y., Ashley,T., Brainerd,E.E., Bronson,R.T., Meyn,M.S. and Baltimore,D. (1996) Targeted disruption of ATM leads to growth retardation, chromosomal fragmentation during meiosis, immune defects, and thymic lymphoma. Genes Dev., 10, 2411–2422. [DOI] [PubMed] [Google Scholar]
- Yim M.B., Chock,P.B. and Stadtman,E.R. (1990) Copper, zinc superoxide dismutase catalyzes hydroxyl radical production from hydrogen peroxide. Proc. Natl Acad. Sci. USA, 87, 5006–5010. [DOI] [PMC free article] [PubMed] [Google Scholar]
- Yim M.B., Chock,P.B. and Stadtman,E.R. (1993) Enzyme function of copper,zinc superoxide dismutase as a free radical generator. J. Biol. Chem., 268, 4099–4105. [PubMed] [Google Scholar]