Abstract
I show that Tajima's D, a commonly used summary of the site-frequency spectrum for single-nucleotide polymorphism data, is a biased summary of the site-frequency spectrum. Under neutral models, this bias depends on the population recombination rate. This bias of D in summarizing the data makes inference of demographic parameters sensitive to assumptions about recombination rates.
THE complexity of population-genetic data provides serious challenges when making statistical inferences about the demographic and selective histories of populations. Because full-likelihood methods are either intractable or overly computationally intensive for many models of interest, inferences tend to be obtained on the basis of summaries of the data, rather than on the full data themselves. Broadly speaking, there are two types of summaries of single-nucleotide polymorphism (SNP) data. The first is summaries of the site-frequency spectrum (i.e., the distribution of SNP frequencies in the sample), of which Tajima's D (Tajima 1989) is the best known. The second class is summaries of the associations between SNPs in the sample (linkage disequilibrium) (e.g., Wall 1999).
Recently, several authors have turned to summary statistic likelihood (SSL) methods for making inferences about population parameters (Wall 2000) or demographic processes (Glinka et al. 2003; Akey et al. 2004; Tenaillon et al. 2004). This approach has been employed in both likelihood (Wall 2000; Glinka et al. 2003; Akey et al. 2004; Tenaillon et al. 2004) and Bayesian (Pritchard et al. 1999; Beaumont et al. 2002; Marjoram et al. 2003; Przeworski 2003) contexts. Specifically, the observed data, 𝒟, are assumed to come from a model specified by a set of parameters Θ. When 𝒟 can be reduced to a summary statistic (or set of statistics)  and data are simulated from the model for a particular Θ, then
 |
(1) |
In Equation 1, ɛ is a tolerance (or set of tolerances) that represents a trade-off between accuracy and required computational time. As ɛ decreases, Equation 1 converges to a more precise estimate the likelihood of the data, at the cost of having to simulate more replicates to accurately estimate  (see Beaumont et al. 2002 for a detailed discussion). Simulating over a grid of Θ provides an estimate of the likelihood surface.
While the use of summary statistics results in a loss of information, it is possible to develop inference procedures that perform well (e.g., Wall 2000; Beaumont et al. 2002; Przeworski 2003). The performance of estimators depends in part on the choice of both which summary statistic to use and how many different summaries to use (Beaumont et al. 2002). This note emphasizes a third point that affects accuracy of inference, namely how accurately the summary statistic summarizes the data. Several recent articles have applied the SSL approach in an attempt to distinguish the effects of demography from natural selection in natural or domesticated populations (Glinka et al. 2003; Akey et al. 2004; Tenaillon et al. 2004). In general, the idea is to find a demographic model that fits the data and then identify outlier loci that are putative targets of recent selection. When the interest is in using the SSL approach to make inference about demographic models, it is common to conduct the coalescent simulations without recombination (Glinka et al. 2003; Akey et al. 2004) (see Tenaillon et al. 2004 for an exception). The rationale for this is twofold. First, the appropriate value of the population recombination rate to use in the simulations is often unclear, and both genetic map-based and population genetic-based estimates have their drawbacks. Second, it is generally argued that the expectation of many summary statistics does not depend on the recombination rate, but rather the variance decreases as ρ increases. These arguments appear to have been interpreted to imply that point estimates obtained via simulation without recombination will be correct, but that the size of confidence intervals will be overestimated.
Here I focus on a widely used summary of the site-frequency spectrum, Tajima's (1989) D. D is defined as the standardized difference between two estimators of θ, the population mutation rate. The numerator of the statistic is  , where
  is the mean number of pairwise differences between individuals in the sample (Tajima 1983), and
  is Watterson's (1975) moment estimator. The denominator of D, which we label here as k, is an estimate of
  and is calculated as a function of the number of segregating sites in the sample (Equation 38 in Tajima 1989). First, I show that the expectation of Tajima's D is a biased summary of the expected site-frequency spectrum. Second, the discrepancy between D and the true site-frequency spectrum can lead to substantial biases in estimates of bottleneck parameters obtained from single loci. This bias is partially mitigated by a simple change in how the likelihood of the data is estimated, although the accuracy of estimates of
  still depends on the assumed population recombination rate. For the parameter values of the bottleneck model examined here, these results hold for data sets composed of multiple independent loci.
I consider the case of a simple stepwise bottleneck model, constraining the bottleneck to the case where the effective population size recovers to the prebottleneck size (N0) and model changes in effective size as occurring instantaneously. The model then has six parameters, the sample size (n), the coalescent mutation rate (θ = 4N0μ, where N0 is the effective population size and μ is the neutral mutation rate per generation), the coalescent recombination rate (ρ = 4N0r), the time of recovery from the bottleneck (tr), the duration of the bottleneck (d), and the severity of the bottleneck (f). All times in the simulation are measured in units of 4N0 generations, and  , the ratio of the effective size during the bottleneck to before the bottleneck. Scaling N0 = 1 constrains 0 < f ≤ 1 and puts θ on the scale of N0.
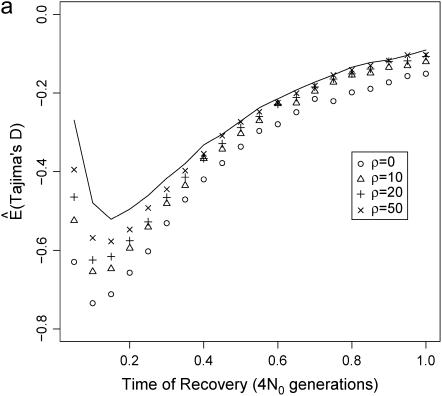
We first consider the effect that a population bottleneck has on the expectation of Tajima's D, estimating E(D) by simulation under the infinite-sites model. Figure 1a plots  for a short (d = 0.05), severe (f = 0.1) bottleneck, as a function of the recovery time of the bottleneck. Clearly,
  depends both on the value of ρ and on the bottleneck parameters. However, there is good reason to suspect that the curves in Figure 1a do not accurately represent the average site-frequency spectrum. Figure 1a implies that the effects of a bottleneck, such as the degree to which the site-frequency spectrum is skewed toward rare alleles, will depend on the recombination rate in a manner similar to the effect of natural selection on linked neutral sites (e.g., Braverman et al. 1995). However, a correlation of recombination rate and diversity is not expected under any neutral mutation model, suggesting that Figure 1a is an incorrect picture of the average effect that a bottleneck has on the site-frequency spectrum.
Figure 1.
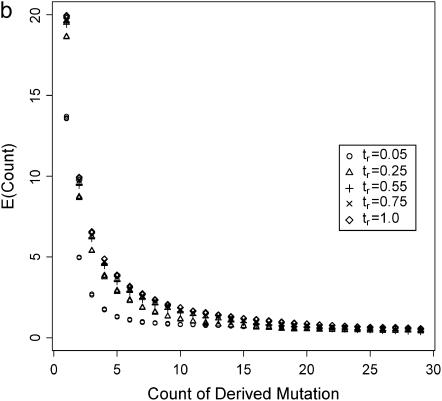
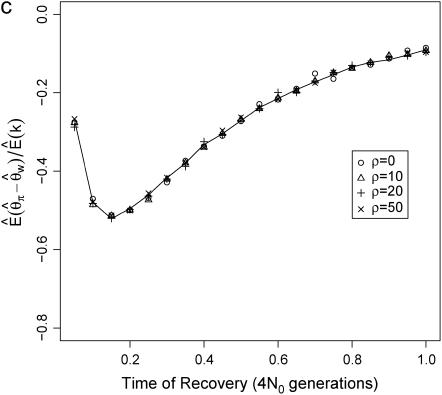
The site-frequency spectrum under a severe bottleneck model. (a) The expectation of Tajima's D was estimated from 104 coalescent simulations of a stepwise bottleneck. The bottleneck duration (d) was 0.05, on the scale of 4N0 generations, and the reduction in effective size was 90% (f = 0.1). All simulation results shown here from the bottleneck model are for sample size n = 30, θ = 20, ρ = 50 or 0, d = 0.05, and f = 0.1 with mutations occurring according to the infinitely many sites model (Hudson 2002), and summary statistics were calculated as previously described (Thornton 2003). The recovery time (tr) was varied from 0.05 to 1 in steps of 0.05. For small tr, this bottleneck model approximates the reduction in diversity observed when comparing non-African samples of Drosophila melanogaster to African samples (e.g., Glinka et al. 2003; Haddrill et al. 2005). Four different recombination rates were simulated, 4N0r = 0, 10, 20, and 50, as well as free recombination (solid line). (b) The full site-frequency spectrum for 5 of the recovery times plotted in a and all four values of ρ. The different values of ρ are not distinguished, as they are all superimposed for any particular value of tr. (c) The quantity  , where k is the denominator of Tajima's D, was estimated from 105 coalescent simulations for the same bottleneck models as those in a. The solid line is
  under the free recombination model, just as that in a. Simulations of a region of L independent sites (i.e., free recombination) with total mutation rate θ were performed by pooling the results of L simulations runs, each with mutation rate
  , into a single sample.
The conjecture that the expectation of Tajima's D does not accurately represent the average site-frequency spectrum is confirmed in Figure 1b, which shows the expectation of the full site-frequency spectrum for four of the values of tr in Figure 1a. For each value of tr, the plots of the expected site-frequency spectrum are indistinguishable for all values of ρ.
The reason why  depends on ρ is that D is defined as the ratio of two random variables (both the numerator and the denominator are functions of the number of segregating sites in the sample), and the expectation of a ratio of random variables is not equal to the ratio of expectations in general. To illustrate this point,
  , the ratio of the expectation of the numerator and denominator of D, is plotted as a function of tr in Figure 1c. The ratio of expectations depends only on time of recovery from the bottleneck and not on ρ. For comparison,
  for the case of free recombination is also plotted in Figure 1c (solid line), and the curve is not distinguishable from
  .
.
While the results here are presented for Tajima's D in the context of a bottleneck model, they also hold for other normalized summaries of the site-frequency spectrum, such as Fu and Li's (1993) statistics, and for a model of exponential population growth (data not shown). For the growth model, the differences in  for different values of ρ for a particular growth rate are not as large as those for very recent, severe bottlenecks (Figure 1a) and are almost negligible for high growth rates. Under the standard coalescent model of a large, panmictic population with mutations occurring under the infinite-sites model (e.g., Hudson 1983; Tajima 1983), the expectation of the full site-frequency spectrum does not depend on recombination (since the history of the sample is the average of many correlated histories, all of which have the same expectation), but the expectation of Tajima's D does (Table 1). These results imply that, under neutral models, the average observed value of Tajima's D in a region of low recombination can be different from that observed in a region of high recombination, simply because ρ differs, and not because of a difference in the site-frequency spectrum between regions, and that caution should be taken in interpreting a correlation of D with recombination rate as evidence for selection (e.g., Stajich and Hahn 2005).
TABLE 1.
Estimated expectation of Tajima's D and  under the standard neutral model
| ρ |  |
 |
|---|---|---|
| 0 | −0.104 | −0.0016 |
| 10 | −0.041 | −0.0014 |
| 50 | −0.011 | −0.0008 |
| ∞ | −0.001 | −0.0006 |
Calculations are based on 105 coalescent simulations per value of ρ with n = 30, θ = 20, and 1-kb regions. ρ = ∞ refers to the case of independent sites.
The observation that Tajima's D is a biased summary of the site-frequency spectrum suggests that using D may lead to biased inference of model parameters. Specifically, given that the bias in D as a summary of the data depends on ρ, we may expect parameter estimates to be biased when data from recombining regions are analyzed assuming no recombination (e.g., Glinka et al. 2003; Akey et al. 2004), because the simulated data and observed data will have different biases. We now investigate the properties of estimating  , using Tajima's D as the sole summary of the data. Ten thousand data sets were simulated under each of five bottleneck models. For each bottleneck, n = 30; θ = 20; d = 0.05; f = 0.1; and tr = 0.05, 0.15, 0.25, 0.35, or 0.45. The true ρ = 4N0r = 50. Inference was made only on tr using the SSL procedure, assuming that d, f, and θ are known precisely. I generated tables of summary statistics by simulating 106 replicates of the stepwise bottleneck model with parameters ρ = 50 (the true value), n = 30, θ = 20, d = 0.05, f = 0.1 for values of tr ranging from 0 to 2 in steps of 0.01.
These tables of summary statistics allow the conditional likelihood curve,  , to be estimated for samples of size 30. Estimating these curves with ρ = 0 mimics the procedures of Glinka et al. (2003) and Akey et al. (2004). When analyzing data sets of multiple independent loci, the likelihood curves were summed in log scale, and cases where the probability of the data was estimated to be zero were considered to be 10−6. I estimated these conditional-likelihood curves using two different estimates of the likelihood of the data (in the following Θ is the set {tr, d = 0.05, f = 0.1, θ = 20, ρ = 50 or 0}),
 |
(2) |
 |
(3) |
where S is the number of segregating sites in the data, and ∧ denotes “logical and.” Equation 2 estimates the likelihood of the data by estimated the likelihood of Tajima's D. Equation 3 estimates the likelihood using just the components of the numerator of D. Equation 3 is also appealing because it is equivalent to  for all 0 ≤ ɛ < 1. For all estimation using the above equations, an ɛ = 0.05 was used, although the results described here do not depend strongly on ɛ.
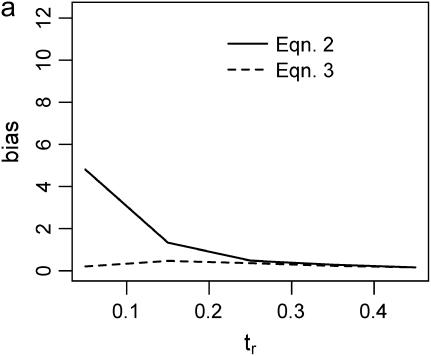
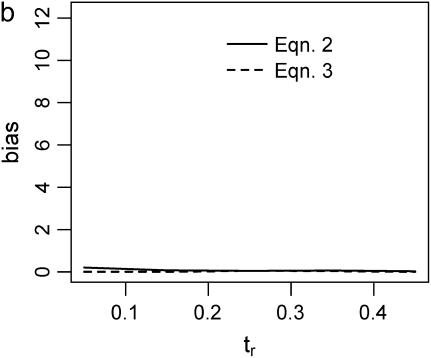
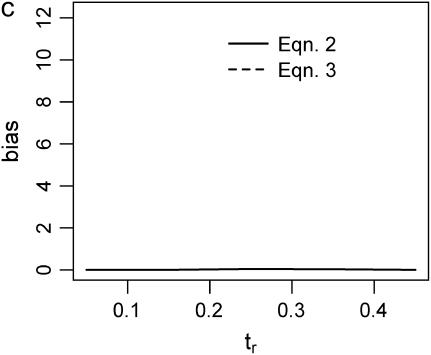
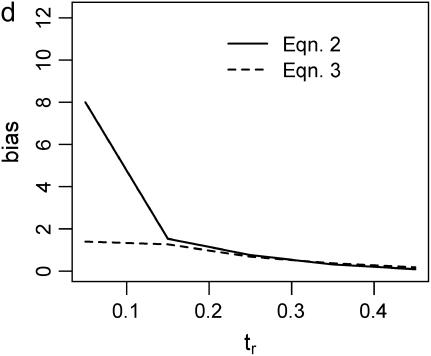
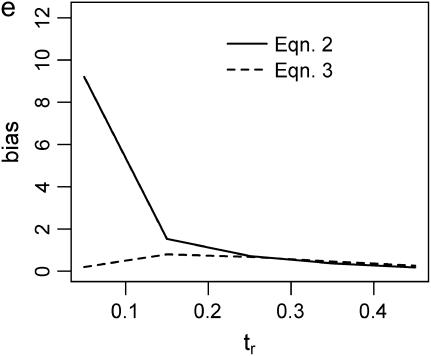
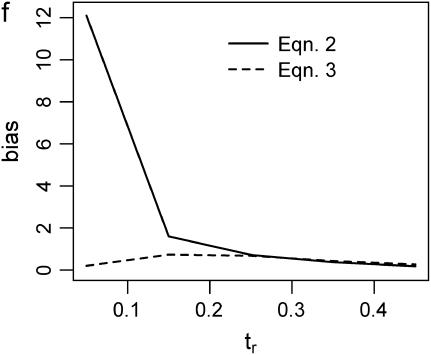
Figure 2 plots the median bias in  as a function of the true value for both single- and multilocus data sets. The median bias is plotted because the distribution of the estimator tended to have a long tail to the right. Note that the bias is relative to the true value, such that a bias of 1 corresponds to a twofold overestimate, etc. There are two points to make regarding Figure 2. The first is the bias that results from different estimates of
  . In Figure 2, a–f, the solid line corresponds to the bias when estimating
  using Tajima's D as the sole summary of the data (Equation 2). The dashed line corresponds to the bias when estimating
  using Equation 3. For a single locus (Figure 2a), estimating
  using Equation 2 results in a larger median upward bias than using Equation 3. For data sets consisting of 10 or 20 independent loci (Figure 2, b and c, respectively), the median bias is quite low.
Figure 2.
Bias of point estimates of tr obtained by summary statistic likelihood. (a–c) Data sets consisting of 1, 10, and 20 independent loci, respectively, were simulated with ρ = 50 and tr estimated, assuming ρ and all other model parameters are known precisely. (d–f) The same data sets are reanalyzed, assuming no recombination. As the distributions of  tended to be right skewed (i.e., biased toward overestimating), the median bias is plotted, rather than the mean. The estimate
  was obtained for data simulated under a bottleneck mode by summary statistic likelihood, using two different ways of estimating the probability of the data (Equations 2 and 3). Equation 2 corresponds to estimating the likelihood of the data by estimating the likelihood of the observed value of Tajima's D. The bias is standardized to the true value of tr.
The second point to make concerns the effect that the recombination rate used in simulations to estimate  has on the parameter estimation procedure. Figure 2, a–c, is the bias in
  when the recombination rate used in the simulations to estimate
  was equal to the true value (ρ = 50). When using Equation 3, the bias in
  is reasonably small, even for single-locus data sets. For multilocus data sets, estimates obtained using Equation 2 (i.e., using Tajima's D to summarize the data) are not seriously biased when the true tr is relatively large, and the bias is within a factor of 3 when the bottleneck is more recent (i.e., Figure 2b). However, when the model is misspecified and simulations to estimate
  are performed with no recombination, there is a severe upward bias in
  when the bottleneck is recent and Equation 2 was used to estimate
  . Using Equation 3 and simulating with ρ = 0 resulted in much less bias in
  , although a nearly threefold median upward bias was still observed for single-locus data sets when the true tr = 0.05 (Figure 2d).
The above results emphasize that the choice of summary statistic is important when implementing approximate inference methods. The fact that bottlenecks result in skewed site-frequency spectra means that Tajima's D is a natural summary statistic to use when inferring bottleneck parameters, but the results here suggest that biases in parameter estimates can be large if simulations are conducted with no recombination and data are sampled from recombining regions of the genome. Figure 2, d–f, suggests that this effect of ρ can be partially mitigated by replacing D with  and S as the summaries of the data when estimating
  (i.e., Equation 3).
All the examples of inference described here were performed assuming that all other model parameters were known precisely (except for ρ, to explore the effect of recombination on inference). The bottleneck model considered here has a total of five parameters (θ, ρ, tr, d, and f). In practice, a grid would need to be simulated over all five parameters, and the tables of summary statistics stored, for each parameter combination, requiring a potentially impractical amount of storage. An additional complication of the likelihood approach arises when one desires to obtain P-values for individual loci under the demographic model, as done in Akey et al. (2004). These authors obtained P-values for individual summaries for each locus at the most likely parameter values for a bottleneck. However, it is desirable to take into account uncertainty in the estimates of demographic parameters. In a Bayesian context (e.g., Beaumont et al. 2002; Przeworski 2003) such simulations are straightforward as posterior densities are proper probability distributions and are used easily in model validation (e.g., Gelman et al. 2003, p. 159).
The number of summary statistics used is also relevant to the accuracy of inference. Here, either one statistic (Tajima's D) or two statistics ( and S, which are components of D) were used, with the intention of illustrating that biases in how D summarizes the site frequency spectrum have an effect on parameter inference. In practice, combining statistics that summarize different features of the data should improve estimates of the likelihood of the data [although examples exist of where adding more summary statistics increases the error of estimates (Beaumont et al. 2002)]. However, other summaries of the site-frequency spectrum (e.g., Fu and Li 1993) are strongly correlated with Tajima's D and may or may not yield additional information about parameter values. Summaries of the linkage disequilibrium in the data summarize information not captured in Tajima's D, but the distributions of these statistics clearly depend on ρ.
Acknowledgments
I thank Scott Williamson, Bret Payseur, Carlos Bustamante, and Andrew Clark for valuable discussion and comments on the manuscript. Richard Hudson and Molly Przeworski gave critical comments on an early version of the manuscript. K.T. is supported by a Sloan Postdoctoral Fellowship in Computational Molecular Biology.
References
- Akey, J. M., M. A. Eberle, M. J. Rieder, C. S. Carlson, M. D. Shriver et al., 2004. Population history and natural selection shape patterns of genetic variation in 132 genes. PloS Biol. 2(10): 1591–1599. [DOI] [PMC free article] [PubMed] [Google Scholar]
- Beaumont, M. A., W. Zhang and D. J. Balding, 2002. Approximate Bayesian computation in population genetics. Genetics 162: 2025–2035. [DOI] [PMC free article] [PubMed] [Google Scholar]
- Braverman, J. M., R. R. Hudson, N. L. Kaplan, C. H. Langley and W. Stephan, 1995. The hitchhiking effect on the site frequency-spectrum of DNA polymorphisms. Genetics 140: 783–796. [DOI] [PMC free article] [PubMed] [Google Scholar]
- Fu, Y. X., and W. H. Li, 1993. Statistical tests of neutrality of mutations. Genetics 133: 693–709. [DOI] [PMC free article] [PubMed] [Google Scholar]
- Gelman, A., J. B. CArlin, H. S. Stern and D. B. Rubin, 2003. Bayesian Data Analysis, Ed. 2. Chapman & Hall/CRC Press, London/New York/Cleveland/Boca Raton, FL.
- Glinka, S., L. Ometto, S. Mousset, W. Stephan and D. D. Lorenzo, 2003. Demography and natural selection have shaped genetic variation in Drosophila melanogaster: a multilocus approach. Genetics 165: 1269–1278. [DOI] [PMC free article] [PubMed] [Google Scholar]
- Haddrill, P., K. Thornton, B. Charlesworth and P. Andolfatto, 2005. Multilocus patterns of nucleotide variability and the demographic and selection history of Drosophila melanogaster populations. Genome Res. 15: 790–799. [DOI] [PMC free article] [PubMed] [Google Scholar]
- Hudson, R. R., 1983. Properties of a neutral allele model with intragenic recombination. Theor. Popul. Biol. 23: 183–201. [DOI] [PubMed] [Google Scholar]
- Hudson, R. R., 2002. Generating samples under a Wright-Fisher neutral model of genetic variation. Bioinformatics 18: 337–338. [DOI] [PubMed] [Google Scholar]
- Marjoram, P., J. Molitor, V. Plagnol and S. Tavare, 2003. Markov chain Monte Carlo without likelihoods. Proc. Natl. Acad. Sci. USA 100: 15324–15328. [DOI] [PMC free article] [PubMed] [Google Scholar]
- Pritchard, J. K., M. T. Seielstad, A. Perez-Lezaun and M. W. Feldman, 1999. Population growth of human Y chromosomes: a study of Y chromosome microsatellites. Mol. Biol. Evol. 16: 1791–1798. [DOI] [PubMed] [Google Scholar]
- Przeworski, M., 2003. Estimating the time since the fixation of a beneficial allele. Genetics 164: 1667–1676. [DOI] [PMC free article] [PubMed] [Google Scholar]
- Stajich, J. E., and M. W. Hahn, 2005. Disentangling the effects of demography and selection in human history. Mol. Biol. Evol. 22: 63–73. [DOI] [PubMed] [Google Scholar]
- Tajima, F., 1983. Evolutionary relationship of DNA sequences in finite populations. Genetics 105: 437–460. [DOI] [PMC free article] [PubMed] [Google Scholar]
- Tajima, F., 1989. Statistical method for testing the neutral mutation hypothesis by DNA polymorphism. Genetics 123: 585–595. [DOI] [PMC free article] [PubMed] [Google Scholar]
- Tenaillon, M. I., J. U'ren, O. Tenaillon and B. S. Gaut, 2004. Selection versus demography: a multilocus investigation of the domestication process in maize. Mol. Biol. Evol. 21(7): 1214–1225. [DOI] [PubMed] [Google Scholar]
- Thornton, K., 2003. libsequence: a C++ class library for evolutionary genetic analysis. Bioinformatics 19: 2325–2327. [DOI] [PubMed] [Google Scholar]
- Wall, J. D., 1999. Recombination and the power of statistical tests of neutrality. Genet. Res. 74: 65–79. [Google Scholar]
- Wall, J. D., 2000. A comparison of estimators of the population recombination rate. Mol. Biol. Evol. 17: 156–163. [DOI] [PubMed] [Google Scholar]
- Watterson, G. A., 1975. Number of segregating sites in genetic models without recombination. Theor. Popul. Biol. 7: 256–276. [DOI] [PubMed] [Google Scholar]


