

Abstract
Drosophila melanogaster originated in tropical Africa but has achieved a cosmopolitan distribution in association with human habitation. Cosmopolitan populations of D. melanogaster are known to have reduced genetic variation, particularly on the X chromosome. However, the relative importance of population bottlenecks and selective sweeps in explaining this reduction is uncertain. We surveyed variation at 31 microsatellites across a 330-kb section of the X chromosome located between the white and kirre genes. Two linked clusters of loci were observed with reduced variation and a skew toward rare alleles in both an Ecuador and a Zimbabwe population sample. Examining Zimbabwe DNA sequence polymorphism within one of these regions allowed us to localize a selective sweep to a 361-bp window within the 5′ regulatory region of the roughest gene, with one nucleotide substitution representing the best candidate for the target of selection. Estimates of sweep age suggested that this fixation event occurred prior to the expansion of D. melanogaster from sub-Saharan Africa. For both putative sweep regions in our data set, cosmopolitan populations showed wider footprints of selection compared to those in Zimbabwe. This pattern appears consistent with the demographic amplification of preexisting sweep signals due to one or more population bottlenecks.
ASSESSING the evolutionary forces that shape levels and patterns of genetic variation is a central aim of population genetics. In comparing genomic patterns of variability between more recently founded (cosmopolitan) and more ancient (Afrotropical) populations of Drosophila melanogaster, it has been found that X-linked loci show disproportionately reduced variability in cosmopolitan populations, while autosomal loci show a more modest reduction (Andolfatto 2001; Kauer et al. 2002). It has been suggested that this pattern might result from a high rate of selective sweeps affecting cosmopolitan D. melanogaster in the recent past, under the logic that selection may be more efficient on the X chromosome, and several recent multilocus studies have supported this hypothesis (Kauer et al. 2002; Glinka et al. 2003; Orengo and Aguadé 2004). However, it should be noted that selective sweeps are not predicted to reduce the ratio of X-linked to autosomal variation if adaptation occurs from standing genetic variation (Orr and Betancourt 2001) or if the majority of adaptive substitutions are not recessive (Betancourt et al. 2004). Several other hypotheses have been proposed to explain the relative levels of X vs. autosome variation in Afrotropical and cosmopolitan populations, including autosomal inversions within Africa and differences in sex-specific life history traits (reviewed in Andolfatto 2001).
A recent burst of adaptation in cosmopolitan D. melanogaster is conceivable, given the history of the species. From an Afrotropical origin, D. melanogaster is thought to have expanded into Eurasia ∼10,000 years ago (Lachaise et al. 1988) and to have reached other parts of the world much more recently (David and Capy 1988). This expansion into new environments may have triggered adaptations detectable from population genetic data. However, the overall lower variability of cosmopolitan D. melanogaster suggests that the founding of these populations was accompanied by one or more population bottlenecks (e.g., Begun and Aquadro 1993; Baudry et al. 2004; Haddrill et al. 2005).
Population bottlenecks can have a variety of effects on commonly used “tests of neutrality” such as Tajima's D (Tajima 1989). A severe bottleneck may eliminate variation entirely at many loci. As new mutations arise following this event, an excess of rare alleles is expected (Tajima 1989; Simonsen et al. 1995). More moderate bottlenecks, in which several lineages survive but some low-frequency variants are lost, may produce the opposite pattern of an excess of intermediate-frequency variants (Pluzhnikov et al. 2002; Depaulis et al. 2003). Many realistic bottlenecks may encompass both of these extremes, such that at some loci only one allele survives, while at others multiple lineages persist. This scenario has the potential to closely mimic the predictions of a model involving multiple selective sweeps, in which most loci show ample variation while some loci are nearly invariant. Other proposed tests of neutral evolution, such as Fay and Wu's (2000) H and the likelihood method of Kim and Stephan (2002), have also been shown to be quite sensitive to population bottlenecks (Depaulis et al. 2003; Jensen et al. 2005). Therefore, bottlenecked populations present a special challenge for studies aimed at detecting and localizing selective sweeps, and such histories must be taken into account before conclusions regarding positive selection can be made.
The recent selective fixation of a beneficial mutation is expected to generate patterns of reduced variation (Maynard Smith and Haigh 1974), an excess of rare alleles as new mutations begin to accumulate (Braverman et al. 1995), and an excess of high-frequency-derived alleles (Fay and Wu 2000) at sites near the target of selection. If selective sweeps have been especially frequent in the recent history of a population, then a genomewide or chromosomewide survey of variation might detect some fraction of loci showing some or all of the above signals of positive selection. Several recent studies of this type have examined multilocus patterns of genetic variation in D. melanogaster. Kauer et al. (2002) examined levels of polymorphism at X-linked and autosomal microsatellites. These authors suggested that low levels of X-linked variability in a European sample were due to selective sweeps, while the unusual pattern of higher X-linked than autosomal variation in an African sample may have been caused by background selection. A subsequent study (Kauer et al. 2003) reached similar conclusions but found that simulations involving a founder event plus unequal sex ratios could account for many aspects of their data. Glinka et al. (2003) surveyed DNA sequence variation at 105 fragments of the X chromosome. They reported no evidence of selective sweeps affecting these loci in an African sample, but a large number of fragments with low variation in the European sample, with these fragments generally having elevated frequencies of derived alleles. A recent update to this project, involving 253 sequenced fragments, reached similar conclusions—that some loci were better explained by selective sweeps in the European sample than by a bottleneck alone (Ometto et al. 2005). Finally, Orengo and Aguadé (2004) analyzed DNA sequence variation at 109 X-linked loci in a European population only, finding that loci closer to coding regions showed lower Tajima's D (Tajima 1989) and, at least in some cases, reduced ratios of polymorphism to divergence. Each of the above studies compared experimental data to simulations involving population bottlenecks, but concluded that at least some aspects of their data could not be explained by demographic history and were consistent with the hypothesis of recent selective sweeps affecting cosmopolitan populations specifically. On the other hand, a recent study by Haddrill et al. (2005) examined the data of Glinka et al. (2003) plus 10 additional loci, concluding that certain bottleneck models were capable of explaining all aspects of the data that were examined.
In this study, we have conducted a fine-scale scan of microsatellite and DNA sequence variation across a 330-kb region of the X chromosome in Afrotropical and cosmopolitan populations of D. melanogaster. This approach should allow us to both observe the neutral pattern of variability for each population studied and determine whether variation in this region has been influenced by selective sweeps. The region studied is located between the white and kirre genes, distal to Notch, and experiences a moderately high rate of recombination [2.1 × 10⁻⁸ recombinations (rec)/bp/generation (gen), Kliman and Hey 1993; 3.0 × 10⁻⁸ rec/bp/gen, Kindahl 1994]. It was chosen without prior evidence for selection. Thus, like the genomewide and chromosomewide studies cited above, our study takes a noncandidate approach to assess the frequency of positive selection. In contrast, though, we have chosen to take a more intensive look at a single genomic region. In this way, our approach is more similar to that of Harr et al. (2002) and of Bauer DuMont and Aquadro (2005), although both of these studies included loci with prior suspicion of nonneutrality. The chromosomal region examined in this study is immediately distal to the Notch region studied by Bauer DuMont and Aquadro (2005). And coincidentally, our region of study overlaps with the data of Harr et al. (2002), specifically surrounding their “sweep region 2.”
Over our full region of study, we observed two potential sweep signals based on microsatellite polymorphism. Interestingly, these two signals appeared to be present in both the cosmopolitan and the Afrotropical population samples we examined. Analysis of DNA sequence polymorphism in one of these regions supported the hypothesis of a selective sweep affecting the common ancestor of the populations studied. In the Zimbabwe sample, the strongest sweep signal from sequence polymorphism data was quite narrow, allowing us to localize the target of selection to a very narrow window. In the cosmopolitan populations, the signal appeared to cover a broader area. This could represent a “demographic amplification” of the original sweep signal, perhaps due to the effect of a bottleneck subsequent to the sweep.
MATERIALS AND METHODS
Microsatellite methods:
Thirty-one dinucleotide microsatellites were typed in extracted (homozygous) X chromosome lines derived from isofemale lines, which were established from flies collected in Ecuador (Atacame) and Zimbabwe (Sengwa), for sample sizes of 49–55 chromosomes each. The collection of these samples is described in Begun and Aquadro (1995) and Begun and Aquadro (1994), respectively. Primer sequences and motif types for each locus can be found in supplemental Table S1 at http://www.genetics.org/supplemental/. Genomic DNA was isolated using cesium chloride gradient purification or using the Puregene cell and tissue DNA isolation kit from Gentra Systems (Research Triangle Park, NC). PCR amplification using forward primers fluorescently labeled with FAM (Applied Biosciences, Foster City, CA) was done using conditions described in the supplemental Table S1 legend (http://www.genetics.org/supplemental/). Amplified fragments were sized using an ABI 377 DNA sequencer and analyzed using GeneScan 3.1.2 and Genotyper 2.1.
Expected heterozygosity for each microsatellite locus was calculated as 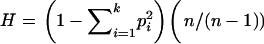 , where pi denotes the frequency of the ith allele, the total number of alleles is k, and a sample size correction is made on the basis of the number of sampled alleles n (Nei 1978). Variance in repeat number was calculated as
 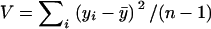 , where yi represents the number of repeat units inferred for the ith allele in a sample of size n. The allele frequency spectrum was summarized using the DH/sd statistic reported by the Bottleneck computer program (Cornuet and Luikart 1996). This method uses a simulation approach to generate a distribution of expected heterozygosities given the observed number of alleles and the mutation model chosen. Negative values of DH/sd indicate an excess of heterozygosity (i.e., an excess of rare alleles) compared to neutral equilibrium expectations, while positive values indicate the opposite pattern. Statistical significance of DH/sd values was assessed under both a stepwise mutation model and a two-phase mutation model with 20% nonstepwise jumps and a variance in the size of these jumps of 30. No correction was made for multiple testing, because the P-values were used only to flag regions for follow-up sequencing and not for hypothesis testing. The ln RV and ln RH tests were performed as described in Schlötterer (2002) and Schlötterer and Dieringer (2005). These two statistics measure the difference between populations in variance in repeat number and heterozygosity, respectively, to identify outlier loci that may represent population-specific selective sweeps.
Sequence polymorphism data:
DNA sequencing was performed for sample sizes of 12–14 chromosomes per population for 20 loci, of ∼1 kb each, distributed across a 60-kb region that was selected on the basis of reduced/skewed microsatellite variation. In addition to Ecuador and Zimbabwe, we obtained sequence polymorphism data from a Beijing, China population (to include a more variable cosmopolitan sample). One allele from D. simulans was amplified and sequenced for each locus. For some loci, a single allele from D. yakuba was amplified and sequenced as well. PCR and sequencing primers are listed in supplemental Table S2 (http://www.genetics.org/supplemental/). Locus-specific reaction conditions are available upon request. PCR products were purified using the QiaQuick PCR purification kit from QIAGEN (Valencia, CA). Sequencing reactions using ABI BigDye ddNTPs were read by an ABI 3730 capillary sequencer at the Biotechnology Resource Center of Cornell University (http://www.brc.cornell.edu). Sequence reads were aligned using Sequencher 4.2. Chromatograms were visually inspected at all putatively polymorphic sites. Final alignments were made using the CLUSTALW algorithm as implemented in MegAlign 5.08 and manually corrected.
DNA summary statistics, including Tajima's D (Tajima 1989), were obtained using DnaSP 4.0 (Rozas and Rozas 1999), and their statistical significance was calculated using the “coalescent simulations” tool in this program. In calculating the population recombination rate for these simulations, we used 3Ne = 3,000,000 for these X-linked loci and a recombination rate r = 2.1 × 10⁻⁸ rec/bp/gen (Kliman and Hey 1993). These parameters should be conservative because the recombination rate for this region may actually be somewhat higher (Kindahl 1994) and because, particularly for Zimbabwe D. melanogaster, the true Ne may be >1,000,000 (Kreitman 1983; Thornton and Andolfatto 2005). These same parameter estimates for Ne and r were used in all subsequent analyses and simulations.
We explored two additional options to test whether observed negative values of Tajima's D could be explained by population history. First, we used the coalescent simulator ms (Hudson 2002) to simulate DNA sequence data under a plausible demographic model for a locus resembling the one being examined. For the China population, the model used was a recent bottleneck with parameters estimated by Thornton and Andolfatto (2006) from non-African sequence polymorphism data. In coalescent units (of 3Ne generations), this model involved a bottleneck beginning at time 0.019, reducing Ne to a proportion 0.03 of the original size, and instantaneously recovering to the original Ne at time 0.004. For the Zimbabwe population, the model used was a more ancient bottleneck, representing simply an example of a model that Haddrill et al. (2005) could not reject as an explanation for Zimbabwe patterns of polymorphism. Here, the bottleneck occurred at time 0.125, reduced Ne to 0.00001 of the original size, but lasted only until time 0.125005. The msstats option, as implemented under libsequence (Thornton 2003), was used to obtain values of Tajima's D from each simulated replicate. We then obtained a P-value equal to the proportion of simulated replicates that yielded a lower value of D than our observed value.
Second, we compared values of Tajima's D from our China and Zimbabwe sequence data to those obtained by Ometto et al. (2005). This study included 253 loci sequenced in one cosmopolitan (The Netherlands) and one Zimbabwe population. While European and Chinese populations might differ in their recent demographic histories, they appear to have similar levels of genetic diversity (Baudry et al. 2004), implying that they may have been affected in roughly similar ways by the founder event that gave rise to the more ancient cosmopolitan populations (David and Capy 1988). For this comparison, P-values were defined as the proportion of loci from Ometto et al. (2005) that had a lower Tajima's D than our locus being tested.
Likelihood analysis and sweep localization:
We also analyzed our sequence polymorphism data using the composite likelihood-ratio (CLR) method for the detection and localization of selective sweeps (Kim and Stephan 2002). This method compares three estimators of θ (θw from the number of segregating sites, θπ from nucleotide diversity, and θH based on the frequency of derived alleles) to test whether sequence polymorphism data deviate from neutral equilibrium predictions. If a selective sweep is inferred, the CLR method estimates the location of the advantageous mutation and the strength of selection (α). Because this method was known to give false positive results if polymorphism data are missing from the majority of the region studied (Y. Kim, personal communication), we focused this analysis on subsections of the sequenced region that were fully or mostly covered by our polymorphism data. In cases where a neutral, equilibrium model was rejected by the CLR test, we analyzed the same data using a goodness-of-fit test (Jensen et al. 2005). This test compares the fit of a selective sweep model to the data against that of a generalized alternative model, with the goal of differentiating rejections due to selective sweeps from those potentially due to population history.
After identifying a putative selective sweep and localizing it within a narrow window, we identified candidate fixations that might represent the target of selection. Lacking an unswept population sample of D. melanogaster, we considered as candidate fixations any substitution or indel that occurred along the D. melanogaster lineage (as inferred using D. simulans and D. yakuba as outgroups) within the region of interest. This region included no known protein-coding sequences, but fell within the inferred 5′ regulatory region of the roughest gene. To test candidate fixations for possible regulatory significance, we applied MatInspector (Cartharius et al. 2005) to sequences from these three species, to test for the gain or loss of predicted transcription factor binding sites.
Age of the sweep:
The method of Przeworski (2003) uses a rejection-sampling approach to generate a posterior distribution for the time since fixation of a beneficial allele, given summaries of the observed data. Data were input for windows of 500 and 2000 bp on both sides of the suspected target. The program was run to obtain 2000 successful matches, and the age estimate was obtained by finding the mode of a histogram with bin size 0.01 (in coalescent units of 3Ne generations). An additional sweep age calculation, under the assumption that the postsweep genealogy resembled a star phylogeny, was done to compute the time (in years) since the sweep as T = no. mutations/(no. sites × no. individuals × mutation rate per year)(Slatkin and Hudson 1991; Baudry et al. 2004). The mutation rate estimate used here, 1.1 × 10⁻⁸, was taken from Tamura et al. (2004).
Microsatellite simulations with selection:
We used SelSimM (Spencer and Coop 2004) to test whether an inferred sweep was sufficient to explain the significantly negative DH/sd values at neighboring microsatellite loci in the Zimbabwe sample. The sweep position and selection coefficient used were from the CLR analysis. However, it was necessary to scale down Ne to 1000 (and to correspondingly scale up s, maintaining the same Nes) to run the program. For both of the above sets of simulations, the population mutation rate (θ) for each microsatellite was estimated from Zimbabwe heterozygosity, using the formula 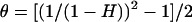 (Ohta and Kimura 1973), which assumes a stepwise model of microsatellite evolution. Each microsatellite locus within 40 kb of the inferred sweep was simulated. Allele frequency spectra for these simulated loci were analyzed using the DH/sd statistic of Cornuet and Luikart (1996). For each locus, we then obtained the proportion of simulated replicates where simulated DH/sd was less than DH/sd observed in our empirical data.
RESULTS
Microsatellite polymorphism:
For each of the 31 microsatellite loci examined, Zimbabwe showed a greater number of alleles and a higher expected heterozygosity (Figure 1, Table 1) than Ecuador. The degree of the reduction in Ecuador heterozygosity was considerably variable among loci: at some loci, Ecuador had nearly the heterozygosity of Zimbabwe, but two clusters of linked microsatellites (from 105 to 142 and from 205 to 228 kb) showed dramatically reduced variation in the Ecuador sample. In both of these regions, however, at least some loci appeared to have modestly reduced heterozygosity in the Zimbabwe sample as well. A Mann-Whitney test confirmed that Zimbabwe heterozygosities were lower for the 8 loci within these two windows than for the 23 remaining loci (P = 0.036). This result does not appear to be a product of differences in length-mediated mutation rate: while mean repeat length is correlated with measures of variability in our full data set (results not shown), no significant difference in mean repeat length in Zimbabwe was detected between loci within and outside of these same windows (P = 0.32, Mann-Whitney test).
Figure 1.

Summaries of microsatellite polymorphism. Heterozygosity refers to expected heterozygosity (based on allele frequencies) in Ecuador (dashed line) and Zimbabwe (solid line). Allele frequency distribution is summarized by the DH/sd statistic for Ecuador (dashed line) and Zimbabwe (solid line). Open triangles indicate monomorphic loci, for which DH/sd could not be calculated. Negative DH/sd values indicate an excess of rare alleles compared to the neutral equilibrium expectation under a stepwise mutation model. The statistical significance of these DH/sd values is given in Table 1. ln RV (dashed line) and ln RH (solid line) were calculated, with negative values indicating a greater than average reduction in Ecuador variability. The location of annotated genes within the region of study is plotted on the same kilobase scale. The gene near 180 kb, depicted as a pair of points connected by a line, is roughest.
TABLE 1.
Summaries of microsatellite polymorphism
| Ecuador
|
Zimbabwe
|
|||||||||||
|---|---|---|---|---|---|---|---|---|---|---|---|---|
| Locus | n | A | H | V | DH/sd | n | A | H | V | DH/sd | ln RH | ln RV |
| 0 | 55 | 7 | 0.81 | 4.92 | 0.58 | 49 | 11 | 0.83 | 13.30 | −1.93 | −0.21 | −0.99 |
| 3 | 54 | 3 | 0.29 | 0.52 | −1.38 | 52 | 8 | 0.80 | 3.06 | −0.47 | −3.13 | −1.78 |
| 12 | 54 | 6 | 0.73 | 3.08 | −0.2 | 52 | 9 | 0.78 | 6.99 | −1.67 | −0.45 | −0.82 |
| 14 | 55 | 5 | 0.34 | 24.15 | −4.31** | 49 | 11 | 0.84 | 15.52 | −1.51 | −3.37 | 0.44 |
| 22 | 55 | 8 | 0.74 | 3.69 | −1.93 | 49 | 11 | 0.85 | 32.45 | −1.19 | −1.15 | −2.17 |
| 29 | 55 | 6 | 0.69 | 3.50 | −0.84 | 49 | 10 | 0.81 | 7.85 | −1.77 | −1.06 | −0.81 |
| 45 | 54 | 3 | 0.48 | 2.18 | −0.03 | 53 | 8 | 0.82 | 6.98 | 0.14 | −2.44 | −1.16 |
| 46 | 54 | 5 | 0.64 | 6.36 | −0.62 | 54 | 14 | 0.92 | 14.64 | 0.49 | −3.05 | −0.83 |
| 47 | 55 | 4 | 0.11 | 0.49 | −4.84*** | 49 | 10 | 0.84 | 12.38 | −0.83 | −4.98 | −3.23 |
| 59 | 54 | 4 | 0.57 | 15.97 | −0.34 | 53 | 8 | 0.72 | 2.48 | −2.22 | −1.02 | 1.86 |
| 64 | 54 | 8 | 0.52 | 7.21 | −7.11*** | 52 | 16 | 0.88 | 17.87 | −2.87* | −2.97 | −0.91 |
| 67 | 50 | 5 | 0.60 | 2.11 | −1.15 | 54 | 11 | 0.83 | 6.14 | −1.89 | −1.82 | −1.07 |
| 81 | 54 | 3 | 0.35 | 0.21 | −0.95 | 52 | 13 | 0.88 | 10.05 | −1.09 | −3.87 | −3.88 |
| 87 | 54 | 5 | 0.69 | 2.32 | 0.01 | 52 | 7 | 0.80 | 2.26 | 0.35 | −0.98 | 0.02 |
| 105 | 53 | 2 | 0.14 | 0.28 | −0.69 | 54 | 5 | 0.70 | 1.36 | 0.15 | −3.32 | −1.56 |
| 122 | 51 | 3 | 0.15 | 0.56 | −2.48 | 51 | 11 | 0.87 | 6.30 | −0.06 | −5.08 | −2.42 |
| 129 | 54 | 6 | 0.24 | 1.54 | −8.04*** | 52 | 11 | 0.68 | 5.27 | −8.08*** | −2.43 | −1.23 |
| 142 | 54 | 3 | 0.14 | 0.30 | −2.51 | 53 | 11 | 0.88 | 8.94 | 0.28 | −5.26 | −3.39 |
| 154 | 54 | 4 | 0.55 | 6.53 | −0.52 | 54 | 10 | 0.85 | 6.55 | −0.17 | −2.42 | 0.00 |
| 174 | 54 | 8 | 0.79 | 2.90 | −0.56 | 52 | 13 | 0.90 | 10.97 | 0.24 | −1.60 | −1.33 |
| 179 | 55 | 4 | 0.67 | 0.77 | 0.63 | 49 | 11 | 0.79 | 8.44 | −3.71* | −0.93 | −2.39 |
| 189 | 55 | 3 | 0.35 | 1.03 | −0.92 | 49 | 8 | 0.78 | 2.63 | −1.09 | −2.61 | −0.93 |
| 205 | 54 | 2 | 0.07 | 0.04 | −1.12 | 53 | 8 | 0.65 | 7.91 | −3.95* | −3.76 | −5.38* |
| 207 | 55 | 1 | 0.00 | 0.00 | NA | 49 | 10 | 0.78 | 10.36 | −2.74* | −5.57* | −6.35* |
| 214 | 54 | 4 | 0.14 | 1.65 | −4.43** | 52 | 10 | 0.73 | 8.76 | −4.57** | −3.54 | −1.67 |
| 228 | 53 | 1 | 0.00 | 0.00 | NA | 54 | 7 | 0.56 | 2.37 | −4.39** | −3.95 | −4.83 |
| 234 | 54 | 6 | 0.41 | 6.04 | −5.35** | 52 | 9 | 0.86 | 8.56 | 0.46 | −3.22 | −0.35 |
| 289 | 54 | 4 | 0.53 | 3.31 | −0.74 | 54 | 9 | 0.78 | 6.10 | −1.68 | −1.74 | −0.61 |
| 316 | 54 | 8 | 0.76 | 20.74 | −1.27 | 52 | 13 | 0.81 | 7.21 | −4.19** | −0.46 | 1.06 |
| 325 | 54 | 5 | 0.33 | 0.79 | −4.31** | 52 | 6 | 0.73 | 1.08 | −0.22 | −2.34 | −0.31 |
| 332 | 54 | 7 | 0.49 | 1.55 | −5.75*** | 52 | 9 | 0.84 | 7.59 | 0.07 | −2.60 | −1.59 |
Locus designations are given by kilobase position within the region studied. n is the number of chromosomes sampled. A is the number of alleles observed for this locus in the given population. H and V are expected heterozygosity and variance in repeat number, respectively, and are calculated using the formulas given in materials and methods. DH/sd, ln RH, and ln RV are also described in materials and methods. For DH/sd, *P < 0.025, **P < 0.005, and ***P < 0.001. For ln RH and ln RV, * denotes values that fall outside the 95% confidence intervals for these statistics.
To quantify the between-population difference in variability at each locus, we performed the ln RV (Schlötterer 2002) and ln RH (Schlötterer and Dieringer 2005) tests (Figure 1, Table 1). For ln RV, two loci fell outside the 95% confidence interval (205 and 207). Using ln RH, only 207 fell outside the 95% confidence interval. Each of these cases suggested disproportionately low variation in Ecuador. However, it should be noted that locus 207 is monomorphic in Ecuador, and these statistics could be calculated only by using the suggestion of Schlötterer and Dieringer (2005) to change one allele in the monomorphic population to an allele differing by one repeat unit.
For the DH/sd statistic (Cornuet and Luikart 1996), a total of eight loci for Ecuador and eight loci for Zimbabwe rejected a neutral equilibrium expectation when a stepwise mutation model was assumed (Table 1). In all of these cases, negative DH/sd values indicated a heterozygote deficiency (i.e., an excess of rare alleles). Results were very similar if a two-phase mutation model with 20% nonstepwise jumps and a variance of 30 in the size of these jumps was used (results not shown). Importantly, for both of the large valleys of heterozygosity described above, both Ecuador and Zimbabwe contained one or more loci with a significant excess of rare alleles (Figure 1). Since allele frequency spectra can be quite sensitive to population history, and because of the large number of tests performed, we use these results mainly to motivate further data collection at the level of DNA sequence polymorphism.
Patterns of nucleotide variation:
As depicted in Figure 2, we obtained DNA sequence polymorphism data for a series of 20 ∼1-kb loci distributed between locations 182 and 241 kb. These loci were spaced ∼5 kb apart or closer, with additional data being collected in regions of particular interest. We continue to refer to these loci by their kilobase locations, using the same scale as for the microsatellites. The Ecuador population sample showed exceptionally low nucleotide diversity (Table 2; average over 11 loci, π = 0.0011), with some invariant and nearly invariant sequencing loci even at both ends of this 60-kb region. In contrast, an additional 1-kb locus sequenced at position 290 kb had a nucleotide diversity of 0.0029, which is more consistent with that of other loci sequenced in similar recombinational environments for this population sample (V. Bauer DuMont and C. F. Aquadro, unpublished data). Due to the extended region of reduced variation, it was not possible to localize any selective sweeps that might have impacted the Ecuador sample in this region.
Figure 2.

Data collected within the 60-kb sequencing region. All rows are plotted according to the kilobase scale below. The positions of microsatellites genotyped in the Zimbabwe and Ecuador samples are noted. Sequencing loci are depicted, indicating regions where polymorphism data have been collected in Zimbabwe, China, and Ecuador. The portion of the roughest gene overlapping with this region is shown. The first two protein-coding exons for this gene are included within sequencing locus 182. roughest also has two noncoding exons (present in the spliced product, but occurring before the initiating methionine) present at approximately positions 189 and 197.5.
TABLE 2.
Summaries of DNA sequence polymorphism
| Ecuador
|
China
|
Zimbabwe
|
|||||||||
|---|---|---|---|---|---|---|---|---|---|---|---|
| locus | bp | n | π | Taj. D | n | π | Taj. D | n | π | Taj. D | dvg |
| 182 | 1213 | 12 | 0.0007 | −1.18 | 12 | 0.0005 | −1.23 | 14 | 0.0114 | 0.15 | 0.047 |
| 187 | 1208 | — | — | — | 12 | 0.0016 | 1.15 | 12 | 0.0067 | 0.16 | 0.015 |
| 193 | 1101 | 12 | 0.0000 | NA | 12 | 0.0010 | −0.74 | 14 | 0.0071 | −0.55 | 0.047 |
| 198 | 1445 | — | — | — | 12 | 0.0071 | 0.36 | 14 | 0.0111 | −0.62 | 0.055 |
| 199 | 1026 | 12 | 0.0008 | −1.75* | 12 | 0.0011 | 0.22 | 14 | 0.0046 | −1.85** | 0.039 |
| 200 | 899 | — | — | — | — | — | — | 14 | 0.0085 | −1.22* | 0.051 |
| 201 | 936 | — | — | — | 12 | 0.0017 | −1.30 | 14 | 0.0112 | −0.69 | 0.077 |
| 204 | 935 | 12 | 0.0017 | −0.62 | 12 | 0.0021 | 0.19 | 14 | 0.0085 | −0.67 | 0.049 |
| 207 | 1013 | — | — | — | 12 | 0.0053 | 0.34 | 12 | 0.0049 | −1.15* | 0.044 |
| 209 | 1148 | 12 | 0.0000 | NA | 12 | 0.0014 | −0.91 | 14 | 0.0108 | −0.12 | 0.045 |
| 211 | 1097 | 12 | 0.0005 | −1.63* | 12 | 0.0015 | −1.57* | 14 | 0.0080 | −0.64 | 0.049 |
| 212 | 1088 | 12 | 0.0028 | −0.59 | 12 | 0.0051 | −0.37 | 14 | 0.0081 | −0.45 | 0.046 |
| 213 | 839 | — | — | — | 12 | 0.0037 | 0.41 | 12 | 0.0075 | −1.15* | 0.043 |
| 216 | 1061 | — | — | — | 12 | 0.0039 | −0.40 | 12 | 0.0106 | −1.02* | 0.067 |
| 218 | 738 | 12 | 0.0054 | −0.61 | 12 | 0.0034 | −1.63* | 14 | 0.0123 | −0.64 | 0.037 |
| 221 | 1119 | — | — | — | 12 | 0.0031 | −0.37 | 12 | 0.0074 | −0.62 | 0.053 |
| 224 | 759 | 12 | 0.0000 | NA | 12 | 0.0034 | −0.43 | 12 | 0.0096 | −0.68 | 0.091 |
| 228 | 1276 | — | — | — | 12 | 0.0032 | −0.05 | 12 | 0.0100 | −0.36 | 0.064 |
| 233 | 1202 | 12 | 0.0000 | NA | 12 | 0.0009 | −0.74 | 12 | 0.0065 | −0.76 | 0.040 |
| 241 | 762 | 12 | 0.0002 | −1.14 | — | — | — | — | — | — | 0.046 |
Locus names refer to kilobase positions. bp is the length of the sequenced locus in base pairs, n is the number of chromsomes sampled, π refers to nucleotide diversity, Taj. D is Tajima's D, and dvg is pairwise, per-nucleotide divergence to D. simulans. For Tajima's D, * indicates rejection of the neutral equilibrium model using simulations only with recombination (no rejection without recombination and no rejection if a demographic correction is applied) and ** indicates rejection of the neutral equilibrium model with or without recombination and also if a demographic correction is applied.
To have a more variable non-African sample, we added a population sample from China to our DNA sequence analysis (Begun and Aquadro 1995; Bauer DuMont et al. 2004). The China sample did show greater variation than Ecuador (Table 2), although still less than that observed at other loci in similar recombinational environments for this population (V. Bauer DuMont and C. F. Aquadro, unpublished data). Nucleotide diversity and Tajima's (1989) D in the China sample showed an uneven pattern across this region (Figure 3). For two loci (211 and 218), Tajima's D was significantly negative if recombination was simulated (D = −1.57 and −1.63, P = 0.011 and 0.005, respectively). However, these rejections were not robust to demographic correction: they were no longer significant at the P < 0.025 level when compared against neutral data simulated under the recent bottleneck model described in materials and methods (P = 0.072 and 0.053) or when compared to the empirical data of Ometto et al. (2005) (P = 0.116 and 0.091).
Figure 3.

Nucleotide diversity and Tajima's D are plotted for each locus across the 60-kb sequencing region for the China (dashed line) and Zimbabwe (solid line) population samples. Statistical significance of Tajima's D-values is given in Table 2.
For the Zimbabwe sample, levels of sequence polymorphism and the frequency spectrum were fairly consistent across the 60-kb region (Figure 3; Table 2). Notably, however, one locus (at 199 kb) showed reduced diversity and a strong skew toward rare alleles (Tajima's D = −1.85, P = 0.0001). Several other loci (200, 207, 213, and 216) had Tajima's D-values slightly less than −1 that were also significant with recombination simulated. However, when we applied a demographic correction, only locus 199 was significantly negative when its value of D was compared to neutral data simulated under the ancient bottleneck scenario described in materials and methods (P = 0.014) and to the empirical data of Ometto et al. (2005) (P = 0.000, no D-values of ≤−1.85 were reported for the 253 loci in their Zimbabwe data set).
In contrast to the typical pattern of variation in Zimbabwe D. melanogaster, where we normally observe abundant variation at a variety of frequencies, polymorphism at locus 199 included an ∼700-nucleotide window where each segregating site was present at a low frequency. Within this window, variation consisted of 14 singleton variants, 1 site at frequency 2 out of 14, and six indels present in one individual out of 14. Like Tajima's D, Fu and Li's (1993) D- and F-statistics were both significantly negative for locus 199 (D = −2.65, P = 0.005; F = −2.93, P = 0.005; both P-values drop to 0.0001 if recombination is simulated). Fay and Wu's (2000) H was nonsignificantly negative for the full 1 kb (−2.99, P = 0.11 using simulations with recombination), but within this locus two sharply negative windows were observed (Figure 4).
Figure 4.

Sliding-window plots of Tajima's D and Fay and Wu's H across 4 kb of contiguous sequence for Zimbabwe. The window size is 500 bp, slid at 25-bp increments. At the bottom, the boundaries of each sequencing locus are indicated.
Likelihood sweep detection and localization:
The composite-likelihood sweep detection method of Kim and Stephan (2002) was applied to the two regions with greatest sequence coverage, where some possible indication of nonneutrality had been observed in both populations. Specifically, for China the analysis was conducted once for the subsection of 198–201 kb and once for the subsection of 209–213 kb. For Zimbabwe, the analysis was conducted once for the subsection of 198–201 kb and once for the subsection of 211–216 kb. Likelihood analysis of the full data set in each population sample was not considered due to concern about false positive results given the abundance of missing sequence in the full 60-kb region (Y. Kim, personal communication). For the analyses including locus 199, a neutral equilibrium model was rejected for both populations (Table 3). For the analyses including locus 211, neither population approached rejection of the null model.
TABLE 3.
CLR and GOF tests for positive selection
| Region | Sample | α | KS LR | KS P | GOF LR | GOF P |
|---|---|---|---|---|---|---|
| 199 | China | 258.23 | 5.49 | 0.040 | 391.3 | 0.144 |
| 199 | Zimbabwe | 100.00 | 6.95 | 0.045 | 793.8 | 0.889 |
| 211 | China | 67.02 | 1.43 | 0.659 | n/a | n/a |
| 211 | Zimbabwe | 40.91 | 3.67 | 0.258 | n/a | n/a |
α refers to the selection coefficient estimated by the CLR method of Kim and Stephan (2002). KS LR refers to the likelihood ratio (for test 1: with outgroup data) returned by this method. KS P is the proportion of neutrally simulated replicates having a higher likelihood ratio than our data. GOF LR is the likelihood ratio returned by the goodness-of-fit method (Jensen et al. 2005). GOF P is the P value obtained from this method, where a selective sweep is the null hypothesis.
Because the CLR test rejected a neutral equilibrium model for both of the runs that included locus 199, we applied a goodness-of-fit (GOF) test developed by Jensen et al. (2005) to this same subsection of the data for each population. This method, which aims to distinguish CLR rejections due to positive selection from those due to population history, specifically tests how well a selective sweep model fits the data, as opposed to a generalized alternative model. Thus, high P-values represent a good fit of the sweep model to the data, while lower P-values fall within the range of effects that can also be generated by demographic events such as population bottlenecks. For China, the GOF P-value of 0.144 falls within the range explainable by either a selective sweep or a recent, severe bottleneck. For Zimbabwe, the GOF P-value of 0.889 indicates that a sweep model cannot be rejected and that it seems to fit the data quite well.
In light of the goodness-of-fit results, and because Zimbabwe yielded a CLR likelihood surface with a much sharper sweep localization peak than China, we have focused our primary attention on the sweep inferred at locus 199 in Zimbabwe. The estimate of α (1.5Nes) obtained from this method was 100. While this corresponds to a fairly modest selective advantage (s = 6.67 × 10⁻⁵ if Ne = 1,000,000), it is consistent with the narrow width of the swept region.
As mentioned above, Zimbabwe sequence polymorphism at locus 199 included two windows of strongly negative Fay and Wu's H, suggesting an excess of high-frequency-derived alleles within these fragments. These negative windows were particularly driven by several sites with the derived allele at a frequency of 13 of 14 (Figure 5). This pattern might be expected if recombination during the course of a selective sweep that was centered between these two fragments prevented the derived alleles from hitchhiking to fixation (Fay and Wu 2000; Kim and Stephan 2002). In agreement with this explanation, the CLR method predicted the target of selection in Zimbabwe to be within the 361-bp window between the two clusters of high-frequency-derived alleles (Figure 5, marked by the arrow near position 199.7 kb).
Figure 5.

Derived allele frequencies and candidate fixations within a 1.5-kb window surrounding the likely sweep window for Zimbabwe. Within the main graph area, the frequency of the derived allele is plotted for each Zimbabwe segregating site within locus 199 and the first half of locus 200 (the sample size was 14 alleles). Plotted along the top are the locations of derived candidate fixations (sites where D. melanogaster is fixed for one state, while D. simulans and D. yakuba show a different state). The circled candidate fixations represent mutations along the D. melanogaster lineage that led to differences in predicted transcription factor binding sites. The arrow represents the location of the target of selection predicted by the CLR method.
Also plotted in Figure 5 are candidate fixations, defined as any substitution or indel fixed for one state in D. melanogaster but showing a different, presumably ancestral, state in D. simulans and in D. yakuba. These criteria yielded only a single candidate fixation within the window of greatest interest, with several others just outside of this window. This region is ∼2 kb upstream from the first noncoding exon of the roughest gene, within the putative 5′ regulatory region for this gene, which is thought to extend for at least 18 kb (Araujo et al. 2003; Apitz et al. 2004). We used MatInspector (Cartharius et al. 2005) to look for derived changes in predicted transcription factor binding sites between D. melanogaster and its relatives, D. simulans and D. yakuba. Three such changes were found (Figure 5), including one in the center of our 361-bp candidate sweep window. Here, an Ultraspiracle binding site is predicted in D. simulans and in D. yakuba, but a substitution in the D. melanogaster lineage prevents its prediction in this species.
Age of the selective sweep:
In an attempt to estimate the historical timing of the inferred sweep, we applied the method of Przeworski (2003). When provided with data from the 500 bp left (distal) and the 500 bp right (proximal) of the candidate fixation described above (and assuming that this site was the target of selection), this method returns age estimates and 95% confidence intervals corresponding to 25,500 [14,485, 107,583] and 37,500 [20,980, 139,752] years, respectively, for the age of the sweep (assuming 3Ne = 3,000,000 and 10 generations per year). If the full contiguous sequence data on each side are provided—1967 bp to the left and 2007 bp to the right—the ages estimated are 73,500 [46,983, 235,507] and 49,500 [30,377, 157,680] years. As a second estimate of sweep age (Slatkin and Hudson 1991; Baudry et al. 2004), we counted the number of new mutations that have occurred within the 361-bp window that appears to have been completely swept and divided this number by the product of the number of sites, the number of individuals sequenced, and an estimate of the per-year mutation rate (from Tamura et al. 2004), giving T = 4/[356 × 14 × (1.1 × 10−8)] = 72,960 years.
Predicted effect of a sweep on linked microsatellites:
We used SelSimM (Spencer and Coop 2004) to assess the degree to which the sweep inferred in Zimbabwe at locus 199 might explain the significant skew toward rare alleles observed at microsatellite loci between 179 and 228 kb in this population. We simulated microsatellite loci resembling those in our data set between 174 and 234 kb, with a selective sweep occurring with the position and selection coefficient suggested by the CLR test. For each locus, we recorded the proportion of simulated replicates where the simulated DH/sd value (Cornuet and Luikart 1996) was lower than that for our empirical Zimbabwe microsatellite data and defined this as our P-value. Thus, a P-value <0.05 indicates that linkage to a selective sweep like the one simulated is unlikely to explain the excess of rare alleles observed at this locus in our data. The average values of DH/sd obtained from these simulations were only slightly negative for loci close to the target of the sweep (Table 4). We obtained P-values <0.05 for four loci (179, 205, 214, and 228), suggesting that a sweep like the one we simulated may not be sufficient to explain the excess of rare alleles observed at these loci in our empirical Zimbabwe data.
TABLE 4.
Microsatellite simulations with selection
| Locus | DH/sd (obs) | Mean DH/sd (sim) | P |
|---|---|---|---|
| 174 | 0.24 | 0.10 | 0.861 |
| 179 | −3.71 | −0.02 | 0.035 |
| 189 | −1.09 | −0.04 | 0.351 |
| 205 | −3.95 | −0.12 | 0.042 |
| 207 | −2.74 | −0.06 | 0.110 |
| 214 | −4.57 | −0.08 | 0.022 |
| 228 | −4.39 | −0.18 | 0.033 |
| 234 | 0.46 | 0.01 | 0.872 |
Locus refers to the microsatellite from our empirical data set that is being simulated. DH/sd (obs) is the value of DH/sd obtained for our empirical data. Mean DH/sd (sim) is the mean value of DH/sd for this locus across all simulated replicates. P-value is defined as the proportion of replicates where simulated DH/sd for a particular locus was less than or equal to the value of DH/sd from our empirical data.
DISCUSSION
In this study we have taken a noncandidate approach to assess the importance of selective and demographic factors in shaping genetic variation within a limited region of the X chromosome in Afrotropical and cosmopolitan populations of D. melanogaster. This fine-scale approach allowed us to observe both neutral patterns of genetic variation and local departures from neutrality.
Initial scan of microsatellite variation:
Starting with a screen of 31 dinucleotide microsatellites spaced along a 330-kb region, we identified two windows containing loci with reduced heterozygosity and a skew toward rare alleles in both an Ecuador and a Zimbabwe population sample (one from 105 to 142 kb and one from 205 to 228 kb). These data suggested the possibility that positive selection may have acted near these loci in the history of both populations. The footprint of reduced/skewed variation is notably wider in the Ecuador sample. This footprint enlargement is particularly evident in the 105- to 142-kb window, where in Zimbabwe only locus 129 appears to deviate from neutral expectations, while in Ecuador flanking loci are notably affected as well.
The relatively small number of loci (31) in our data set, along with the presence of monomorphic loci in the Ecuador sample, makes it less than ideal for the application of ln RH and ln RV. Nonetheless, the pattern produced in these statistics deserves attention. If monomorphic data are included (by changing the length of one allele by one repeat unit), the loci identified as outliers by these analyses were 205 (which had the second most negative ln RV in our data set) and 207 (which had the most negative ln RH and ln RV values). Since these statistics suggested a disproportionate reduction in variability for the Ecuador sample at both loci, the typical interpretation would be that a nearby selective sweep had affected this population specifically. However, our subsequent analysis of DNA sequence polymorphism suggested that a selective sweep at position 199 kb had affected both populations, and no clear evidence for selective sweeps specific to the cosmopolitan populations was detected. Thus, it appears that significant values of ln RV and ln RH may have been generated by a difference in the size of “sweep footprints” between ancient and recently derived populations.
A similar possibility is suggested for the region of 105–142 kb. At locus 129, where both populations show their most extreme skew toward rare alleles in our data set, ln RH and ln RV were less negative than at many other loci, and both their Z-scores were slightly positive. At the flanking loci, which appeared to have reduced variation only in the Ecuador sample, both ln RH and ln RV were strongly negative. Thus, both statistics produced a W-shaped pattern in this region, becoming less negative at the locus that may be the closest to a selective sweep. In our data set, which has only 31 loci from which to infer the distribution of ln RH and ln RV values, locus 142 is significantly negative for ln RH if the loci monomorphic in Ecuador are excluded, but in a larger data set it seems likely that both 122 and 142 would be significantly negative for ln RH (these loci give the second- and third-most negative ln RH values in our data set) and that 142 might be significant for ln RV as well.
Microsatellite loci 122, 129, and 142 (along with several others in our data set) were also examined in a separate study by Harr et al. (2002). The full extent of the overlapping region is from position 0 to 174 kb on our scale (and from MSX-5 to MSX-14 in their study), with mostly the same loci chosen in both studies. Harr et al. (2002) restricted their microsatellite analysis to ln RV, while we chose to examine several different summaries of the data. On the basis of a significantly negative ln RV at locus 142 (their MSX-12) and limited follow-up sequencing, Harr et al. (2002) concluded that a selective sweep near locus 142 had occurred in the recent history of a European population, but not in Zimbabwe. We have collected only microsatellite data in this region, but the strong skew toward rare alleles in our Ecuador and Zimbabwe samples at locus 129 (their MSX-11, but Harr et al. do not report allele frequency data) suggested that a sweep closer to this position might have affected both populations. Although this hypothesis requires further verification, the possibility that this region might not represent an “Out of Africa” selective sweep suggests that ln RV and ln RH may be most useful as part of a broader examination of microsatellite polymorphism and that the possibility of selective sweeps not specific to cosmopolitan populations should be considered carefully.
Sequence polymorphism across a 60-kb region:
We chose to focus further data collection in the region between positions 182 and 241 kb, which encompasses several microsatellite loci with reduced and significantly skewed variation in both populations. Within this region, which includes the 5′ exons and upstream regulatory region of the roughest gene, we surveyed sequence polymorphism for a total of 20 fragments, each ∼1 kb in length. The Ecuador population sample showed very low nucleotide diversity, even at both ends of this 60-kb region, where it seemed that microsatellite variation had started to recover. This result suggests that microsatellites may be valuable in delimiting regions of reduced variation even in populations with particularly low nucleotide diversity.
A second cosmopolitan population, China, showed an erratic pattern of nucleotide diversity and Tajima's D among these loci, but without any well-defined footprints of selection. Two moderately negative values of D were observed, but these values fell within the neutral expectations of a reasonable bottleneck model. Although we cannot exclude the possibility of one or more selective sweeps in this region specific to the cosmopolitan populations, the China sequence polymorphism data seem compatible with the null hypothesis of neutral evolution in a bottlenecked population. On the basis of our sweep age inferences from Zimbabwe, it seems likely that an Afrotropical ancestor of the cosmopolitan populations did experience a selective sweep at position 199 kb, and this is in agreement with the significant CLR result for the 199-kb region in China. Yet Tajima's D is slightly positive at 199 kb in China, and the CLR likelihood surface is fairly flat. Thus, while variation at this locus remains quite low in China, it would appear that the sweep signal was somewhat obscured during the bottleneck event.
We have inferred a selective sweep at locus 199 on the basis of Zimbabwe sequence polymorphism data. First identified on the basis of a strong skew toward rare alleles (Tajima's D = −1.85), this locus was also found to contain two clusters of high-frequency-derived alleles (including several sites with the derived allele at a frequency of 13 of 14). Not surprisingly, a composite-likelihood method based on these summaries of the data (Kim and Stephan 2002) rejected the neutral equilibrium model for this region. Furthermore, a goodness-of-fit analysis (Jensen et al. 2005) suggested a simple sweep model to be a good match to the data.
In the case of the high-frequency-derived alleles mentioned above, the single ancestral allele in the sample was not always carried by the same individual. Intuitively, this suggests that enough time has elapsed since the sweep for recombination to break up the initial patterns of linkage disequilibrium. However, the pattern of high-frequency-derived alleles is still observable, as might be expected in a large population where drift will be very slow in pushing high-frequency-derived alleles to fixation.
The pattern of two clusters of high-frequency-derived alleles is consistent with the expectations of the selective sweep model, since these sites will be created where recombination has begun to split the advantageous mutation off from its original haplotype. This leaves a very narrow window (361 bp) between these clusters as the region most likely to contain the target of selection. While this might be described as a “sweep in miniature,” the value of 1.5Nes estimated by the CLR method, 100, suggests that a sweep of this magnitude is entirely plausible. It is also quite similar to the length (∼400 bp) of a region of reduced variation at Acp26Aa in a Malawi population sample of D. melanogaster (Aguadé 1998).
Potential single-nucleotide localization of the sweep:
We defined candidate fixations potentially representing the target of selection as any substitution or indel fixed for one state in D. melanogaster and showing another state in both D. simulans and D. yakuba. These criteria yielded only a single candidate fixation within the region of greatest interest. Computational analysis via MatInspector (Cartharius et al. 2005) revealed that this C to G substitution in the D. melanogaster lineage prevented the prediction of an Ultraspiracle transcription factor binding site that was predicted in D. simulans and D. yakuba. No molecular or genetic interaction between roughest and ultraspiracle has previously been reported, but ultraspiracle does share with roughest a role in ommatidial cluster formation during eye development (Zelhof et al. 1997; Ghbeish and McKeown 2002; Araujo et al. 2003). Thus, one plausible hypothesis for the inferred sweep would be that this mutation either eliminated or quantitatively reduced the activity of an Ultraspiracle binding site, causing a change in the regulation of the roughest gene.
Historical context of the inferred sweep:
Using the method of Przeworski (2003), our estimates for the age of the sweep range between 25,500 and 73,500 years, and these numbers will represent underestimates if the true Ne for Zimbabwe D. melanogaster is >1,000,000, as seems likely. All four confidence intervals from this method overlapped over the range of 46,983–107,583 years, and our estimate of T from the observed number of mutations (72,960 years) also fell within this range. Therefore, it would appear that this sweep happened long before D. melanogaster expanded out from tropical Africa, an event that is generally estimated to have occurred on the order of 10,000 years ago (Lachaise et al. 1988; Baudry et al. 2004). The wider window of reduced variation observed in the cosmopolitan samples for this region may therefore represent the effect of bottlenecks enlarging a preexisting valley of variation that was caused by the sweep in Africa. The more severe reduction in variation observed in the Ecuador sample, as compared to that from China, most likely reflects a history of additional bottlenecks in the founding of this New World population. Additional geographic sampling, along with a better overall understanding of the demographic history of this species, particularly within Africa, might improve our ability to place this selective event in a broader context. Also, future molecular studies may help elucidate the biological relevance of the candidate fixation we have detected.
Expected effect of the inferred sweep on microsatellite variation:
On the basis of theoretical considerations, we expected that our scan of microsatellite variation should be capable of detecting sweeps involving fairly strong selection. Using the (c/s)log N approximation of Maynard Smith and Haigh (1974), we calculate that the selection coefficients required to reduce heterozygosity at a marker 5 kb away by 10, 50, or 90% would be 0.0007, 0.0013, and 0.0063, respectively. It is somewhat surprising, then, that on the basis of initial evidence from microsatellite polymorphism, we identified a sweep with an estimated selection coefficient of 6.67 × 10⁻⁵. In simulating the effect of linked selection, we found that a sweep such as the one inferred at locus 199 should not have a large influence on the allele frequency spectra of microsatellites 15–30 kb away. In our empirical data, however, we did observe a significant skew toward rare alleles for loci at these distances from the inferred target of selection. It is conceivable that these empirical data result from the combined effects of a sweep at locus 199 and the influence of population history. Testing this possibility will require simulation methods capable of modeling both selective sweeps and demography simultaneously. Alternatively, there might have been additional, undetected sweeps within the 60-kb sequencing region, either fixing independently of the sweep at locus 199 or increasing in frequency in epistatic combination. However, any other sweeps within this region would have to be similarly narrow as the one at locus 199 to avoid detection by our sequence polymorphism scan.
Summary and future prospects:
While cosmopolitan populations of D. melanogaster have often been probed for evidence of selective sweeps, it has sometimes been assumed that Afrotropical populations exist at a demographic and adaptive state of equilibrium. A study by Mousset et al. (2003), however, suggested a high rate of nonneutral evolution in a West African sample, some of it possibly related to a recent change in inversion frequencies on the second chromosome (Andolfatto and Kreitman 2000). And, recently, two studies examining variation around loci identified by Glinka et al. (2003) as having low variation in cosmopolitan samples concluded that sweeps in these regions had affected both African and European populations (Li and Stephan 2005; Beisswanger et al. 2006). These results, together with our data indicating one or perhaps two selective sweeps affecting both Afrotropical and cosmopolitan D. melanogaster, suggest that it may be misleading to assume that Afrotropical populations have existed in adaptive stasis while only cosmopolitan populations have been subject to recent selective pressures.
Our findings appear to contrast with those of two recent multilocus studies of molecular variation in this species (Kauer et al. 2002; Ometto et al. 2005), which have reported ample evidence of positive selection in cosmopolitan, but not in Afrotropical, populations. Of course, it is possible that the region of the genome we have chosen to study is unusual and does not reflect genomic patterns of adaptive history. An alternative explanation is that some loci with low variation in cosmopolitan populations may represent demographic amplifications of sweep signals that were already present in Africa. Such sweeps could be associated with the adaptation of D. melanogaster to a human commensalist lifestyle or to new environments within Africa. The relative narrowness of these sweep signals in Afrotropical populations might prevent their detection in studies using loci separated by fairly large genetic distances.
How many putative sweep signals detected in cosmopolitan populations represent selective fixations specific to those populations, and how many represent demographic amplifications of sweep footprints already present in Africa, is currently an open question. In some cases (e.g., Bauer DuMont and Aquadro 2005) a close examination of sequence polymorphism data may support the hypothesis of a cosmopolitan-specific sweep. Other regions, like the one examined in this study, may show evidence for a narrower sweep footprint in Africa, nested within a broader cosmopolitan reduction. Regarding the first category, cosmopolitan-specific sweeps are often difficult to infer and may sometimes prove difficult to localize, due to the confounding effect of population history. On the other hand, sweeps of the second type may prove particularly useful for the study of molecular adaptation. A broad window of reduced variation may facilitate the detection of these sweeps in cosmopolitan populations. If a narrower footprint is then detected in one or more Afrotropical populations, it may be easier to infer a sweep with confidence, since these populations appear not to have experienced recent, severe bottlenecks. And if the sweep footprint is sufficiently narrow in Africa, it may be possible to identify one or more nucleotide substitutions as candidate targets of selection. Therefore, sweeps of this type may offer the best prospects for pinpointing the mutations involved in adaptive evolution.
Acknowledgments
We thank Jeff Jensen for help with the goodness-of-fit analysis, Raazesh Sainudiin for help with microsatellite simulations, Kevin Thornton for providing demographic parameter estimates, and Koni Wright for programming assistance. We also thank the above individuals plus Bret Payseur, Floyd Reed, and Alex Wong for helpful discussions. This research was supported by a National Institutes of Health grant GM36431 to C.F.A.
References
- Aguadé, M., 1998. Different forces drive the evolution of the Acp26Aa and Acp26Ab accessory gland genes in the Drosophila melanogaster species complex. Genetics 150: 1079–1089. [DOI] [PMC free article] [PubMed] [Google Scholar]
- Andolfatto, P., 2001. Contrasting patterns of X-linked and autosomal nucleotide variation in Drosophila melanogaster and Drosophila simulans. Mol. Biol. Evol. 18: 279–290. [DOI] [PubMed] [Google Scholar]
- Andolfatto, P., and M. Kreitman, 2000. Molecular variation at the In(2L)t proximal breakpoint site in natural populations of Drosophila melanogaster and D. simulans. Genetics 154: 1681–1691. [DOI] [PMC free article] [PubMed] [Google Scholar]
- Apitz, H., M. Kambacheld, M. Höhne, R. G. P. Ramos, A. Straube et al., 2004. Identification of regulatory modules mediating specific expression of the roughest gene in Drosophila melanogaster. Dev. Genes Evol. 214: 453–459. [DOI] [PubMed] [Google Scholar]
- Araujo, H., L. C. H. Machado, S. Octacílio-Silva, C. M. Mizutani, M. J. F. Silva et al., 2003. Requirement of the roughest gene for differentiation and time of death of interommatidial cells during pupal stages of Drosophila compound eye development. Mech. Dev. 120: 537–547. [DOI] [PubMed] [Google Scholar]
- Baudry, E., B. Viginier and M. Veuille, 2004. Non-African populations of Drosophila melanogaster have a unique origin. Mol. Biol. Evol. 21: 1482–1491. [DOI] [PubMed] [Google Scholar]
- Bauer DuMont, V., and C. F. Aquadro, 2005. Multiple signatures of positive selection downstream of Notch on the X chromosome in Drosophila melanogaster. Genetics 171: 639–653. [DOI] [PMC free article] [PubMed] [Google Scholar]
- Bauer DuMont, V., J. C. Fay, P. P. Calabrese and C. F. Aquadro, 2004. DNA variability and divergence at the Notch locus in Drosophila melanogaster and D. simulans: a case of accelerated synonymous site divergence. Genetics 167: 171–185. [DOI] [PMC free article] [PubMed] [Google Scholar]
- Begun, D. J., and C. F. Aquadro, 1993. African and North American populations of Drosophila melanogaster are very different at the DNA level. Nature 365: 548–550. [DOI] [PubMed] [Google Scholar]
- Begun, D. J., and C. F. Aquadro, 1994. Evolutionary inferences from DNA variation at the 6-phosphogluconate dehydrogenase locus in natural populations of Drosophila: selection and geographic differentiation. Genetics 136: 155–171. [DOI] [PMC free article] [PubMed] [Google Scholar]
- Begun, D. J., and C. F. Aquadro, 1995. Molecular variation at the vermilion locus in geographically diverse populations of Drosophila melanogaster and D. simulans. Genetics 140: 1019–1032. [DOI] [PMC free article] [PubMed] [Google Scholar]
- Beisswanger, S., W. Stephan and D. De Lorenzo, 2006. Evidence for a selective sweep in the wapl region of Drosophila melanogaster. Genetics 172: 265–274. [DOI] [PMC free article] [PubMed] [Google Scholar]
- Betancourt, A. J., Y. Kim and H. A. Orr, 2004. A pseudohitchhiking model of X vs. autosomal diversity. Genetics 168: 2261–2269. [DOI] [PMC free article] [PubMed] [Google Scholar]
- Braverman, J. M., R. R. Hudson, N. L. Kaplan, C. H. Langley and W. Stephan, 1995. The hitchhiking effect on the sites frequency evolutionary force shaping the partitioning of variability spectrum of DNA polymorphisms. Genetics 140: 783–796. [DOI] [PMC free article] [PubMed] [Google Scholar]
- Cartharius, K., K. Frech, K. Grote, B. Klocke, M. Haltmeier et al., 2005. MatInspector and beyond: promoter analysis based on transcription factor binding sites. Bioinformatics 21: 2933–2942. [DOI] [PubMed] [Google Scholar]
- Cornuet, J. M., and G. Luikart, 1996. Description and power analysis of two tests for detecting recent population bottlenecks from allele frequency data. Genetics 144: 2001–2014. [DOI] [PMC free article] [PubMed] [Google Scholar]
- David, J. R., and P. Capy, 1988. Genetic variation of Drosophila melanogaster natural populations. Trends Genet. 4: 106–111. [DOI] [PubMed] [Google Scholar]
- Depaulis, F., S. Mousset and M. Veuille, 2003. Power of neutrality tests to detect bottlenecks and hitchhiking. J. Mol. Evol. 57: S190–S200. [DOI] [PubMed] [Google Scholar]
- Fay, J. C., and C.-I Wu, 2000. Hitchhiking under positive Darwinian selection. Genetics 155: 1405–1413. [DOI] [PMC free article] [PubMed] [Google Scholar]
- Fu, Y. X., and W. H. Li, 1993. Statistical tests of neutrality of mutations. Genetics 133: 693–709. [DOI] [PMC free article] [PubMed] [Google Scholar]
- Ghbeish, N., and M. McKeown, 2002. Analyzing the repressive function of ultraspiracle, the Drosophila RXR, in Drosophila eye development. Mech. Dev. 111: 89–98. [DOI] [PubMed] [Google Scholar]
- Glinka, S., L. Ometto, S. Mousset, W. Stephan and D. De Lorenzo, 2003. Demography and natural selection have shaped genetic variation in Drosophila melanogaster: a multilocus approach. Genetics 165: 1269–1278. [DOI] [PMC free article] [PubMed] [Google Scholar]
- Haddrill, P. R., K. R. Thornton, B. Charlesworth and P. Andolfatto, 2005. Multilocus patterns of nucleotide variability and the demographic and selection history of Drosophila melanogaster populations. Genome Res. 15: 790–799. [DOI] [PMC free article] [PubMed] [Google Scholar]
- Harr, B., M. Kauer and C. Schlötterer, 2002. Hitchhiking mapping: a population-based fine-mapping strategy for adaptive mutations in Drosophila melanogaster. Proc. Natl. Acad. Sci. USA 99: 12949–12954. [DOI] [PMC free article] [PubMed] [Google Scholar]
- Hudson, R. R., 2002. Generating samples under a Wright-Fisher neutral model. Bioinformatics 18: 337–338. [DOI] [PubMed] [Google Scholar]
- Jensen, J. D., Y. Kim, V. B. DuMont, C. F. Aquadro and C. D. Bustamante, 2005. Distinguishing between selective sweeps and demography using DNA polymorphism data. Genetics 170: 1401–1410. [DOI] [PMC free article] [PubMed] [Google Scholar]
- Kauer, M., B. Zangerl, D. Dieringer and C. Schlötterer, 2002. Chromosomal patterns of microsatellite variability contrast sharply in African and non-African populations of Drosophila melanogaster. Genetics 160: 247–256. [DOI] [PMC free article] [PubMed] [Google Scholar]
- Kauer, M., D. Dieringer and C. Schlötterer, 2003. A microsatellite variability screen for positive selection associated with the “out of Africa” habitat expansion of Drosophila melanogaster. Genetics 165: 1137–1148. [DOI] [PMC free article] [PubMed] [Google Scholar]
- Kim, Y., and W. Stephan, 2002. Detecting a local signature of genetic hitchhiking along a recombining chromosome. Genetics 160: 765–777. [DOI] [PMC free article] [PubMed] [Google Scholar]
- Kindahl, E. C., 1994. Recombination and DNA polymorphism on the third chromosome of Drosophila melanogaster. Ph.D. Thesis, Cornell University, Ithaca, NY.
- Kliman, R. M., and J. Hey, 1993. Reduced natural selection associated with low recombination in Drosophila melanogaster. Mol. Biol. Evol. 10: 1239–1258. [DOI] [PubMed] [Google Scholar]
- Kreitman, M., 1983. Nucleotide polymorphism at the alcohol dehydrogenase locus of Drosphila melangoaster. Nature 304: 412–417. [DOI] [PubMed] [Google Scholar]
- Lachaise, D., M. Cariou, J. R. David, F. Lemeunier, L. Tsacas et al., 1988. Historical biogeography of the Drosophila melanogaster species subgroup, pp. 159–225 in Evolutionary Biology, Vol. 22, edited by M. K. Hecht, B. Wallace and G. T. Prance. Plenum Press, New York.
- Li, H., and W. Stephan, 2005. Maximum-likelihood methods for detecting recent positive selection and localizing the selected site in the genome. Genetics 171: 377–384. [DOI] [PMC free article] [PubMed] [Google Scholar]
- Maynard Smith, J., and J. Haigh, 1974. The hitch-hiking effect of a favourable gene. Genet. Res. 23: 23–35. [PubMed] [Google Scholar]
- Mousset, S., L. Brazier, M.-L. Cariou, F. Chartois, F. Depaulis et al., 2003. Evidence of a high rate of selective sweeps in African Drosophila melanogaster. Genetics 163: 599–609. [DOI] [PMC free article] [PubMed] [Google Scholar]
- Nei, M., 1978. Estimation of average heterozygosity and genetic distance from a small number of individuals. Genetics 89: 583–590. [DOI] [PMC free article] [PubMed] [Google Scholar]
- Ohta, T., and M. Kimura, 1973. A model of mutation appropriate to estimate the number of electrophoretically detectable alleles in finite populations. Genet. Res. 22: 201–204. [DOI] [PubMed] [Google Scholar]
- Ometto, L., S. Glinka, D. De Lorenzo and W. Stephan, 2005. Inferring the effects of demography and selection on Drosophila melanogaster populations from a chromosome-wide scan of DNA variation. Mol. Biol. Evol. 22: 2119–2130. [DOI] [PubMed] [Google Scholar]
- Orengo, D. J., and M. Aguadé, 2004. Detecting the footprint of selection in a European population of Drosophila melanogaster: multilocus pattern of variation and distance to coding regions. Genetics 167: 1759–1766. [DOI] [PMC free article] [PubMed] [Google Scholar]
- Orr, H. A., and A. J. Betancourt, 2001. Haldane's sieve and adaptation from the standing genetic variation. Genetics 157: 875–884. [DOI] [PMC free article] [PubMed] [Google Scholar]
- Pluzhnikov, A., A. Di Rienzo and R. R. Hudson, 2002. Inferences about human demography based on multilocus analyses of noncoding sequences. Genetics 161: 1209–1218. [DOI] [PMC free article] [PubMed] [Google Scholar]
- Przeworski, M., 2003. Estimating the time since the fixation of a beneficial allele. Genetics 164: 1667–1676. [DOI] [PMC free article] [PubMed] [Google Scholar]
- Rozas, J., and R. Rozas, 1999. DnaSP version 3: an integrated program for molecular population genetics and molecular evolution analysis. Bioinformatics 15: 174–175. [DOI] [PubMed] [Google Scholar]
- Schlötterer, C., 2002. A microsatellite-based multilocus screen for the identification of local selective sweeps. Genetics 160: 753–763. [DOI] [PMC free article] [PubMed] [Google Scholar]
- Schlötterer, C., and D. Dieringer, 2005. A novel test statistic for the identification of local selective sweeps based on microsatellite gene diversity, pp. 55–64 in Selective Sweep, edited by D. Nurminsky. Springer, Berlin.
- Simonsen, K. L., G. A. Churchill and C. F. Aquadro, 1995. Properties of statistical tests of neutrality for DNA polymorphism data. Genetics 141: 413–429. [DOI] [PMC free article] [PubMed] [Google Scholar]
- Slatkin, M., and R. R. Hudson, 1991. Pairwise comparisons of mitochondrial DNA sequences in stable and exponentially growing populations. Genetics 129: 555–562. [DOI] [PMC free article] [PubMed] [Google Scholar]
- Spencer, C., and G. Coop, 2004. SelSim: a program to simulate population genetic data with selection and recombination. Bioinformatics 20: 3673–3675. [DOI] [PubMed] [Google Scholar]
- Tajima, F., 1989. Statistical method for testing the neutral mutation hypothesis by DNA polymorphism. Genetics 123: 585–595. [DOI] [PMC free article] [PubMed] [Google Scholar]
- Tamura, K., S. Subramanian and S. Kumar, 2004. Temporal pattern of fruit fly (Drosophila) evolution revealed by mutation clocks. Mol. Biol. Evol. 21: 36–44. [DOI] [PubMed] [Google Scholar]
- Thornton, K., 2003. libsequence: a C++ class library for evolutionary genetic analysis. Bioinformatics 19: 2325–2327. [DOI] [PubMed] [Google Scholar]
- Thornton, K., and P. Andolfatto, 2006. Approximate Bayesian inference reveals evidence for a recent, severe, bottleneck in a Netherlands population of Drosophila melanogaster. Genetics 172 (in press). [DOI] [PMC free article] [PubMed]
- Zelhof, A. C., N. Ghbeish, C. Tsai, R. M. Evans and M. McKeown, 1997. A role for Ultraspiracle, the Drosophila RXR, in morphogenetic furrow movement and photoreceptor cluster formation. Development 124: 2499–2506. [DOI] [PubMed] [Google Scholar]