Abstract
Isochores are large DNA segments (≫300 kb on average) that are characterized by an internal variation in GC well below the full variation seen in the mammalian genome. Precisely defining in terms of size and composition as well as mapping the isochores on human chromosomes have, however, remained largely unsolved problems. Here we used a very simple approach to segment the human chromosomes de novo, based on assessments of GC and its variation within and between adjacent regions. We obtain a complete coverage of the human genome (neglecting the remaining gaps) by ∼3200 isochores, which may be visualized as the ultimate chromosomal bands. Isochores visibly belong to five families characterized by different GC levels, as expected from previous investigations. Since we previously showed that isochores are tightly linked to basic biological properties such as gene density, replication timing, and recombination, the new level of detail provided by the isochore map will help the understanding of genome structure, function, and evolution.
Well before genome sequencing, ultracentrifugation in Cs2SO4 density gradients in the presence of sequence-specific ligands (e.g., Ag+) was shown to lead to a high resolution of mammalian DNAs according to base composition (Corneo et al. 1968). These findings opened a new inroad in the study of the organization of eukaryotic genomes, superseding DNA reassociation kinetics (Britten and Kohne 1968), which was based on the separation of single- and double-stranded DNA on hydroxyapatite (Bernardi 1965). The new density gradient approach showed that, neglecting satellite DNAs, the genomes of warm-blooded vertebrates were characterized by a striking long-range compositional heterogeneity (Filipski et al. 1973; Macaya et al. 1976; Thiery et al. 1976). Indeed, these genomes are mosaics of isochores, long (≫300 kb), compositionally fairly homogeneous regions that belong to a small number of families characterized by different average GC levels (Macaya et al. 1976), and are associated with basic biological properties (for reviews, see Bernardi et al. 1985; Bernardi 1995, 2004).
A quarter of a century after the original studies that had defined the approximate sizes and compositions of isochores as well as the compositions and relative amounts of isochore families, it was reported that isochores could not be identified in the draft sequence of the human genome (Lander et al. 2001), starting a debate that is still ongoing. The different computational approaches used to disprove or redefine isochores (Eyre-Walker and Hurst 2001; Häring and Kypr 2001; Lander et al. 2001; Nekrutenko and Li 2001; Cohen et al. 2005) were, however, shown to be inadequate (Bernardi 2001; Clay and Bernardi 2001a, b, 2005; Li 2002; Oliver et al. 2002, 2004; Li et al. 2003; Melodelima et al. 2005), even if some of them led to a partial identification of isochores. This debate prompted us to map the isochores, as originally defined (Macaya et al. 1976), in the finished sequence of the human genome (International Human Genome Sequencing Consortium 2004). Average GC levels were, therefore, assessed over long DNA stretches (>200 kb), while GC variation was estimated by measuring standard deviations of GC over such stretches using a 100-kb moving window. The findings reported here are in agreement with previous results obtained by equilibrium sedimentation and confirm the existence of five isochore families (see below), but they go much farther in that they directly identify and map isochores on chromosomes, thus leading to a resolution of >3000 chromosomal bands.
Almost 50 years ago, calf thymus DNA, the standard eukaryotic DNA, was shown to be remarkably more heterogeneous in base composition than bacterial DNAs (Meselson et al. 1957). In fact, the very strong heterogeneity was largely, but not entirely, due to the presence of GC-rich satellites that represent 23% of the bovine genome (see Bernardi 2004). Interestingly, high-resolution ultracentrifugation of bovine DNA was not only able to separate the GC-rich satellites, but also showed a discontinuous compositional heterogeneity of the main band (Filipski et al. 1973), consisting of three families of DNA molecules. This was in contrast with the then predominant view (still defended by some authors) (Galtier et al. 2002) of a continuous heterogeneity of main-band DNA. The families of DNA molecules were then shown to be present in the other mammalian genomes explored and to derive from longer, fairly homogeneous DNA stretches (Macaya et al. 1976; Thiery et al. 1976) that were called isochores (Cuny et al. 1981) for (compositionally) equal landscapes. Later work resolved the first family into two families, L1 and L2, named the second and the third families H1 and H2, respectively, and identified another quantitatively small family, H3 (Zerial et al. 1986). Most mammalian genomes, including the human genome, are made up of five families of isochores—L1, L2, H1, H2, and H3—in order of increasing GC levels, if satellite DNAs (∼2% of the genome) and ribosomal DNAs (∼0.5% of the genome) are neglected. Incidentally, satellite and ribosomal DNAs may also be considered isochores, because of their compositional homogeneity (Bernardi 1995).
Isochores were shown to be tightly linked to basic biological properties, such as gene density, replication timing, and recombination (see Bernardi 2004), and have, therefore, been considered “a fundamental level of genome organization” (Eyre-Walker and Hurst 2001). In order to characterize isochores, the present work did not take into account their biological properties (as done by Melodelima et al. 2005) but only relied on two parameters, GC levels and their standard deviations.
Results
Scanning of GC profiles
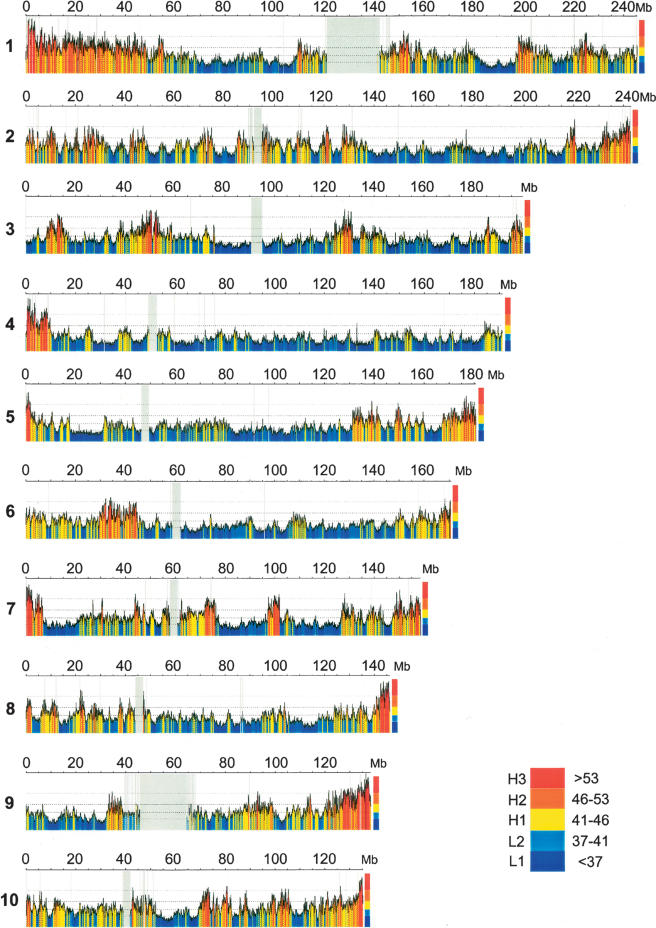
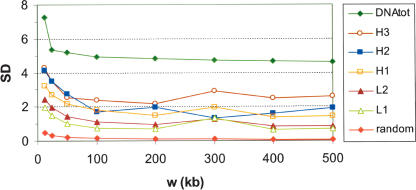
If one scans the GC profiles (Fig. 1, see gatefold) of human chromosomes from any starting point using a fixed window of 100 kb, one finds a mosaic of sequences ranging from 200 kb to several megabases that are characterized by different GC levels and by a remarkable compositional homogeneity. The critical 100-kb window size used in this work was chosen because plots of average standard deviations of GC against window size show the existence of a plateau that begins around 100 kb and extends to over 500 kb. This plateau has long been known (Macaya et al. 1976; Cuny et al. 1981) and is confirmed by the genome sequence (Fig. 2, top curve). Within each isochore family, these plateaus were characterized by standard deviations that increased, with increasing GC of families, from less than 1% to just under 3% (Fig. 2, lower curves).
Figure 1a.
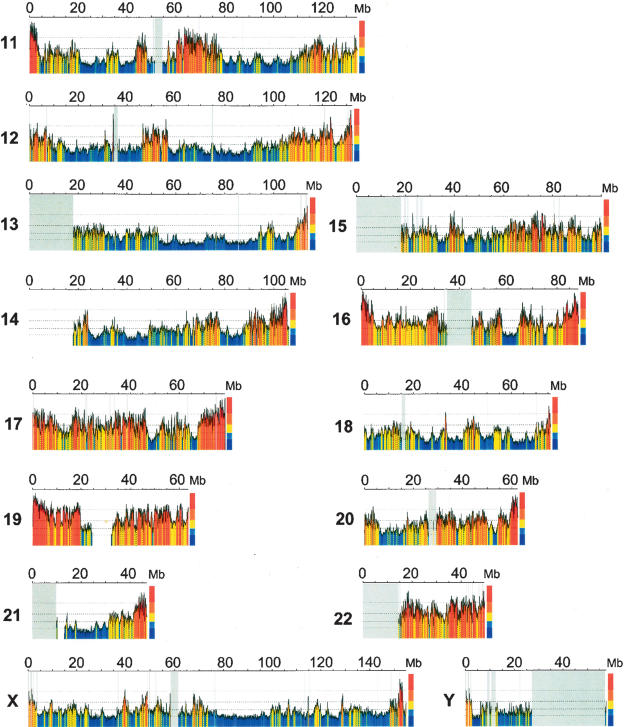
Compositional overview of human chromosomes and their GC levels. The color-coded map shows 100-kb moving window plots using the program draw_chromosome_gc.pl (Pačes et al. 2004) (http://genomat.img.cas.cz). The color code spans the spectrum of GC levels in five steps, indicated by broken horizontal lines, from ultramarine blue (GC-poorest L1 isochores) to scarlet red (GC-richest H3 isochores). Gray vertical lines correspond to the few gaps still present in the sequences, gray vertical regions to the centromeres. Figure 1 differs from a previous, similar figure (Pavliček et al. 2002) in that it is based on the May 2004 UCSC release (Kent et al. 2002) of the finished sequence (International Human Genome Sequencing Consortium 2004) (http://genome.ucsc.edu) and lacks the 5000 large gaps of the original draft sequence (Lander et al. 2001) that would not have allowed the present work. The isochore family borders as defined here (see color bar and main text) are slightly different from the previous ones in the case of the L2/H1 and the H2/H3 borders. Several characteristic features of isochores are already visible in this plot, such as the larger extent of the GC-poor compared to GC-rich regions, and the higher compositional heterogeneity of the GC-rich compared to the GC-poor regions.
Figure 2.
Plots of average standard deviations of GC within isochore families versus window size. Plots of standard deviation (SD) of GC versus fixed window sizes (w) ranging from 12.5 to 500 kb are shown for all isochores comprising at least four windows, after partitioning isochores into families according to GC level. The plots summarize the compositional variations within isochore families. At all scales, these are lower than that characterizing the whole genome, that is, all isochores (top curve), yet much higher than those of random sequences (bottom curve). The variations are consistently high for window sizes below 100 kb, and settle down to a plateau for larger window sizes. This fact justifies graining at 100 kb (see text). Marginally higher standard deviations around 300-kb windows may be due to a larger number of isochore borders seen through this window (Supplemental Fig. S2 shows a size peak of isochores around 500 kb).
Figure 1b.
Window sizes shorter than 100 kb showed standard deviations that were much higher than the plateaus, especially in GC-rich isochores, because of the contribution of different specific sequences (interspersed repeats, CpG islands, exons, introns, etc.). Indeed, this fact prevents the definition of isochores and isochore borders at sizes lower than 100 kb. When applied to randomly chosen fragments from the human genome, the same procedure yields much higher standard deviations, which reach a plateau around 4.5%–5% GC (Fig. 2, top curve; see also Macaya et al. 1976), whereas randomly generated sequences exhibit much lower standard deviations (Fig. 2, bottom curve; Bernardi 2001; Clay and Bernardi 2001a, b).
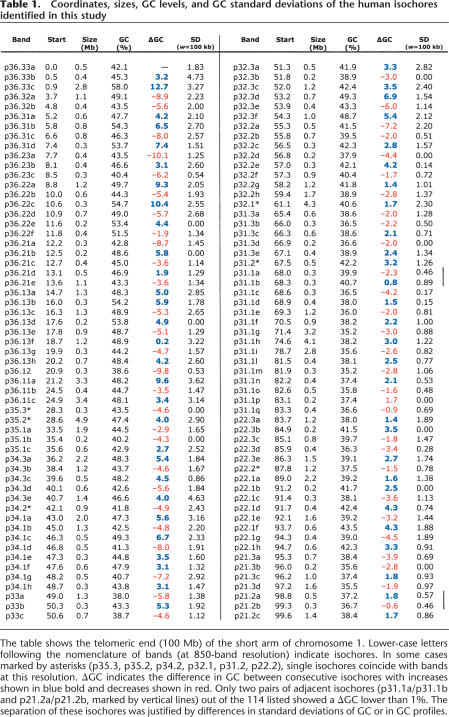
Using our approach, we found that 85% of the genome consists of isochores with an average standard deviation equal to ∼1% GC. The remaining 15% consists of GC-rich isochores characterized by an average standard deviation of ∼2% GC. These values were obtained from Supplemental Table S1, which provides the coordinates on the UCSC map (International Human Genome Sequencing Consortium 2004), the GC level, and the standard deviation for each isochore of the human genome. Table 1 displays a representative sample from Supplemental Table S1.
Table 1.
Coordinates, sizes, GC levels, and GC standard deviations of the human isochores identified in this study
The table shows the telomeric end (100 Mb) of the short arm of chromosome 1. Lower-case letters following the nomenclature of bands (at 850-band resolution) indicate isochores. In some cases marked by asterisks (p35.3, p35.2, p34.2, p32.1, p31.2, p22.2), single isochores coincide with bands at this resolution. ΔGC indicates the difference in GC between consecutive isochores with increases shown in blue bold and decreases shown in red. Only two pairs of adjacent isochores (p31.1a/p31.1b and p21.2a/p21.2b, marked by vertical lines) out of the 114 listed showed a ΔGC lower than 1%. The separation of these isochores was justified by differences in standard deviations of GC or in GC profiles.
Isochore borders
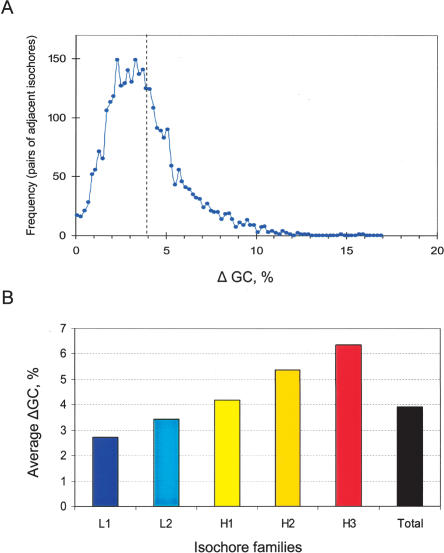
Isochore borders were identified on the basis of marked compositional differences that ranged from 2.7% to 6.3% GC for isochores belonging to different families, the average value being 3.9% GC (Fig. 3). As already mentioned, isochore borders were localized to within 100 kb and, indeed, a more precise definition is practically not possible.
Figure 3.
ΔGC distribution of adjacent isochores. (A) The frequency plot shows the jumps in GC between adjacent isochores identified, in intervals of 0.2% GC. The mean difference is 3.9% GC (dashed line), and 82% of the differences between neighboring isochores are above 2% GC. (B) The bar plot shows the average ΔGC concerning isochores from each of the five families.
H3 isochores were always flanked by GC-poorer isochores, and L1 isochores were always flanked by GC-richer isochores, as expected. These were also the predominant situations found in the cases of H2 or H1 isochores and of L2 isochores, respectively. However, these families also exhibited “transition isochores” in several cases, where one flanking isochore was higher, the other lower (see Supplemental Fig. S1). Very large GC differences at borders (such as L1/H3 borders) were rare, thus leading to the formation of blocks of isochores from closer families (e.g., L1/L2). These blocks correspond essentially to chromosomal bands at a 850-band resolution as defined at the cytogenetic level. In some cases, single isochores correspond to chromosomal bands at this resolution (see Table 1 for examples).
Number and size of isochores
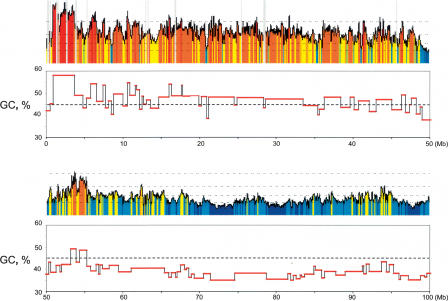
Figure 1 allows the construction of an isochore map as shown by an enlargement of the telomeric 100 Mb on the short arm of chromosome 1 (Fig. 4), which comprise both GC-rich and GC-poor isochores. According to our estimate, the total number of isochore bands in the human genome (neglecting the still existing gaps) is 3159, a number close to the maximum number, 3000, mentioned by Yunis et al. (1977) for chromosomal bands at the highest resolution in early prophase. The average size of an isochore is 0.9 Mb (number average) or 1.9 Mb (weight average) (see Supplemental Fig. S2). In this context, it should be noted (1) that the size distribution by weight shows a peak around 500 kb; (2) that GC-poorer isochores tend to cover the widest size range (see Figs. 1 and 4); and (3) that some isochores, amounting however to only 3.6% of the genome, were as short as 200 kb. Overall, there is a large variation in isochore size, with many smaller ones and a few very large ones.
Figure 4.
Overview of isochores on 100 Mb of chromosome 1. The isochores identified on the telomeric 100-Mb region of the short arm of chromosome 1 (as a representative region of human chromosomes) are shown. Broken horizontal guidelines in the top frames represent GC levels as in Figure 1. Horizontal red stretches in the bottom frames represent isochores. Our strategy was to identify boundaries on the basis of GC jumps between adjacent isochores (ΔGC) (see Fig. 3 and Supplemental Table S1). This strategy may occasionally lead to border misassignments, for instance, in the small number of cases (<3%) when ΔGC is lower than 1% (see Fig. 3). Several of the latter borders could be assigned, however, based on differences in the standard deviations of GC (see Table 1 for an example) or in the GC profiles.
Isochore families
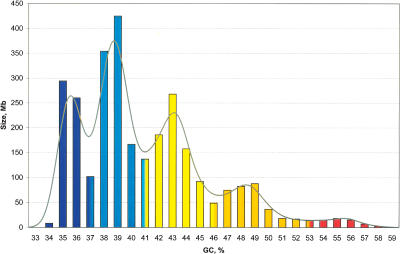
The isochore pattern is, expectedly, different from chromosome to chromosome (see Fig. 1). However, when isochores are pooled in bins of 1% GC (Fig. 5), isochore families stand out. This is evident for isochore families L1, L2, and H1, but also visible for the H2 and H3 families, which are present in small amounts in the genome. The relative amounts of DNA in isochore families were 19%, 37%, 31%, 11%, and 3% for L1, L2, H1, H2, and H3 isochores, respectively, again in fair agreement with previous results (Macaya et al. 1976; Cuny et al. 1981). Local maxima of isochore families as obtained from the peaks of Figure 5 (36%, 39%, 43%, 48%, and 55% GC, from L1 to H3) are only slightly different from those based on preparative and analytical ultracentrifugation (Macaya et al. 1976), yet families are more distinct because GC levels of isochores, not of random DNA fragments, were considered here. This fact also explains why GC distributions of fixed-length fragments of the human genome (Lander et al. 2001) do not show the local maxima observed here. Finally, the isochore families corresponded to peaks in “gene landscapes” (Cruvellier et al. 2004), formed by the distribution of coding sequences according to the GC levels of second and third codon positions (GC2 and GC3).
Figure 5.
Distribution of isochores according to GC levels. The histogram shows the distribution (by weight) of isochores as pooled in bins of 1% GC. Colors represent isochore families as in Figure 1. Values at minima (histogram bars with mixed colors) were split between the two neighboring families. The Gaussian profile shows the distribution of isochores as estimated directly by the “density” function in R (bandwidth 0.7% GC) (Silverman 1986).
Discussion
The present findings, while confirming the isochore features previously established, push our knowledge farther, by quantifying the size, GC levels, standard deviations, and coordinates of isochores on the human genome map. Moreover, these findings also indicate that isochores may be visualized as the ultimate banding patterns of the chromosomes in warm-blooded vertebrates, and that they are arranged in blocks, corresponding to chromosomal bands at the standard 850 band resolution.
It seems appropriate here to briefly summarize two major points of interest concerning isochores. From a practical viewpoint, isochores allowed us to gain an insight into the genome organization of warm-blooded vertebrates (and of other organisms) (Bernardi 2004). Localizing genes in separate isochores led to the discovery of an unexpected and strikingly nonrandom distribution of genes (Mouchiroud et al. 1991; Zoubak et al. 1996), which were found in two “gene spaces.” The “genome core,” composed of the isochore families H2 and H3, comprises more than half of the genes even though they represent only ∼15% of the genome, whereas the “genome desert” (the isochore families L1, L2, and H1) is made up of large expanses with low and often extremely low gene densities. These two gene spaces are characterized by several different properties (for review, see Bernardi 2004), the most remarkable ones being the correlations of isochore families not only with gene density but also with replication timing, recombination, and location and chromatin structure in interphase nuclei, chromatin being “open” in the genome core and “closed” in the genome desert (Saccone et al. 2002).
From a more general point of view, the present results raise one major question concerning the origin and maintenance of GC-rich isochores, which are a common, characteristic property of the genomes of warm-blooded vertebrates. We now know that the GC-rich (and gene-rich) isochores are the result of GC increases in the corresponding gene-rich regions of cold-blooded vertebrates, which are much less GC rich (see Bernardi 2004). We proposed that the increasing body temperature accompanying the emergence of homeothermy led to a need for a thermodynamic stabilization of DNA (Bernardi and Bernardi 1986). At the transition between cold- and warm-blooded vertebrates, GC-poor isochores did not undergo any significant compositional change because they were stabilized by their closed chromatin structures, whereas GC increases took place in the gene-rich genome regions that were characterized by an open chromatin structure (Federico et al. 2006). In fact, the stabilization also concerned RNA and proteins (GC-rich codons favoring amino acids that lead to a higher thermal stability) (Bernardi and Bernardi 1986; Nishio et al. 2003). Although several explanations have been proposed for the GC increases, which took place in spite of a strong AT bias of the mutation process (Gojobori et al. 1982; Smith and Eyre-Walker 2001; Alvarez-Valin et al. 2002; Santini and Bernardi 2005), the only one that was compatible with all known facts was natural selection, mainly negative selection (for review, see Bernardi 2004). How this can be reconciled with the fact that the vast majority of mutations are neutral was explained by the neo-selectionist theory, which posits that neutral GC→AT changes (the AT bias) are tolerated until they cause a regional compositional change in DNA. In turn, this can change chromatin structure and the interaction with regulatory proteins, thus impairing the correct gene expression and leading to negative selection (Bernardi 2004).
Methods
Isochore mapping
The entire chromosomal sequences of the finished human genome assembly (UCSC release hg17) (Kent et al. 2002; International Human Genome Sequencing Consortium 2004) were partitioned into non-overlapping 100-kb windows, and their GC levels were calculated using the program draw_chromosome_ gc.pl (http://genomat.img.cas.cz) (see Fig. 1; Pavliček et al. 2002; Pačes et al. 2004). The window size of 100 kb was motivated by the existence of a horizontal plateau in variance plots after ∼100 kb (see Results). This observation has a simple biological interpretation: The higher variances observed for smaller windows correspond to well-known intra-isochore, gene-scale mosaicisms that are created, for example, by individual exons, introns, CpG islands, 3′-untranslated regions, interspersed repeats, and scaffold/matrix attachment regions. The array of GC levels of the 100-kb windows in each chromosome was scanned for jumps that were detectable on the basis of mean GC differences, and/or of differences in fluctuation levels with respect to subsegments (≥100 kb). As a guideline, we focused on jumps of at least 1%–2% GC between adjacent candidate segments, although in rare cases smaller jumps were justified because of differences in variability between the two segments (see Fig. 3). The results obtained via this simple procedure, which involved only properties of bulk DNA and no annotated features, third codon positions, and so on, demonstrate the existence of a complete covering of the human genome sequence by isochores that fulfill the properties initially established by ultracentrifugation experiments.
Remarks on statistical inference
Since the number of subsegments (≥100 kb) in each candidate segment can be as low as two (200-kb isochores), statistical tests would not have been applicable using our approach (because of low power). Even for longer segments and/or shorter windows, the existing tests are inappropriate, since they assume independent and identically distributed (i.i.d.) windows, windows with Markov dependence, or windows with power-law correlations: No one of these three ideal assumptions is satisfied throughout the human genome (see, e.g., Clay and Bernardi 2001b, 2005 and references therein). For example, especially at window sizes <3 kb, standard i.i.d. tests found in textbooks or statistical recipe books seriously overestimate P-values, leading to oversegmentation.
Acknowledgments
We thank Gabriel Macaya and Giacomo Bernardi for helpful discussions, and David Haussler for comments.
Footnotes
[Supplemental material is available online at www.genome.org.]
Article and publication are at http://www.genome.org/cgi/doi/10.1101/gr.4910606
Freely available online through the Genome Research Open Access option.
References
- Alvarez-Valin F., Lamolle G., Bernardi G., Lamolle G., Bernardi G., Bernardi G. GC3 and mutation biases in the human genome. Gene. 2002;300:161–168. doi: 10.1016/s0378-1119(02)01043-0. [DOI] [PubMed] [Google Scholar]
- Bernardi G. Chromatography of nucleic acids on hydroxyapatite. Nature. 1965;206:779–783. doi: 10.1038/206779a0. [DOI] [PubMed] [Google Scholar]
- Bernardi G. The human genome: Organization and evolutionary history. Annu. Rev. Genet. 1995;29:445–476. doi: 10.1146/annurev.ge.29.120195.002305. [DOI] [PubMed] [Google Scholar]
- Bernardi G. Misunderstandings about isochores. Gene. 2001;276:3–13. doi: 10.1016/s0378-1119(01)00644-8. [DOI] [PubMed] [Google Scholar]
- Bernardi G. Structural and evolutionary genomics. Natural selection in genome evolution. Elsevier; Amsterdam.: 2004. [Google Scholar]
- Bernardi G., Bernardi G., Bernardi G. Compositional constraints and genome evolution. J. Mol. Evol. 1986;24:1–11. doi: 10.1007/BF02099946. [DOI] [PubMed] [Google Scholar]
- Bernardi G., Olofsson B., Filipski J., Zerial M., Salinas J., Cuny G., Meunier-Rotival M., Rodier F., Olofsson B., Filipski J., Zerial M., Salinas J., Cuny G., Meunier-Rotival M., Rodier F., Filipski J., Zerial M., Salinas J., Cuny G., Meunier-Rotival M., Rodier F., Zerial M., Salinas J., Cuny G., Meunier-Rotival M., Rodier F., Salinas J., Cuny G., Meunier-Rotival M., Rodier F., Cuny G., Meunier-Rotival M., Rodier F., Meunier-Rotival M., Rodier F., Rodier F. The mosaic genome of warm-blooded vertebrates. Science. 1985;228:953–958. doi: 10.1126/science.4001930. [DOI] [PubMed] [Google Scholar]
- Britten R.J., Kohne D.E., Kohne D.E. Repeated sequences in DNA. Science. 1968;161:529–540. doi: 10.1126/science.161.3841.529. [DOI] [PubMed] [Google Scholar]
- Clay O., Bernardi G., Bernardi G. The isochores in human chromosomes 21 and 22. Biochem. Biophys. Res. Commun. 2001a;285:855–856. doi: 10.1006/bbrc.2001.5176. [DOI] [PubMed] [Google Scholar]
- Clay O., Bernardi G., Bernardi G. Compositional heterogeneity within and among isochores in mammalian genomes. II. Some general comments. Gene. 2001b;276:25–31. doi: 10.1016/s0378-1119(01)00668-0. [DOI] [PubMed] [Google Scholar]
- Clay O., Bernardi G., Bernardi G. How not to search for isochores: A reply to Cohen et al. Mol. Biol. Evol. 2005;22:2315–2317. doi: 10.1093/molbev/msi231. [DOI] [PubMed] [Google Scholar]
- Cohen N.T., Dagan L., Graur D., Dagan L., Graur D., Graur D. GC composition of the human genome: In search of isochores. Mol. Biol. Evol. 2005;22:1260–1272. doi: 10.1093/molbev/msi115. [DOI] [PubMed] [Google Scholar]
- Corneo G., Ginelli E., Soave C., Bernardi G., Ginelli E., Soave C., Bernardi G., Soave C., Bernardi G., Bernardi G. Isolation and characterization of mouse and guinea pig satellite DNA’s. Biochemistry. 1968;7:4373–4379. doi: 10.1021/bi00852a033. [DOI] [PubMed] [Google Scholar]
- Cruvellier S., Jabbari K., Clay O., Bernardi G., Jabbari K., Clay O., Bernardi G., Clay O., Bernardi G., Bernardi G. Compositional gene landscapes in vertebrates. Genome Res. 2004;14:886–892. doi: 10.1101/gr.2246704. [DOI] [PMC free article] [PubMed] [Google Scholar]
- Cuny G., Soriano P., Macaya G., Bernardi G., Soriano P., Macaya G., Bernardi G., Macaya G., Bernardi G., Bernardi G. The major components of the mouse and human genomes: Preparation, basic properties and compositional heterogeneity. Eur. J. Biochem. 1981;111:227–233. doi: 10.1111/j.1432-1033.1981.tb05227.x. [DOI] [PubMed] [Google Scholar]
- Eyre-Walker A., Hurst L.D., Hurst L.D. The evolution of isochores. Nat. Rev. Genet. 2001;2:549–555. doi: 10.1038/35080577. [DOI] [PubMed] [Google Scholar]
- Federico C., Scavo C., Cantarella C.D., Motta S., Saccone S., Bernardi G., Scavo C., Cantarella C.D., Motta S., Saccone S., Bernardi G., Cantarella C.D., Motta S., Saccone S., Bernardi G., Motta S., Saccone S., Bernardi G., Saccone S., Bernardi G., Bernardi G.2006Gene-rich and gene-poor chromosomal regions have different locations in the interphase nuclei of cold-blooded vertebrates. Chromosoma (in press). [DOI] [PubMed] [Google Scholar]
- Filipski J., Thiery J.P., Bernardi G., Thiery J.P., Bernardi G., Bernardi G. An analysis of the bovine genome by Cs2SO4−Ag+ density gradient centrifugation. J. Mol. Biol. 1973;80:177–197. doi: 10.1016/0022-2836(73)90240-4. [DOI] [PubMed] [Google Scholar]
- Galtier N., Piganeau G., Mouchiroud D., Duret L., Piganeau G., Mouchiroud D., Duret L., Mouchiroud D., Duret L., Duret L. GC-content evolution in mammalian genomes: The biased gene conversion hypothesis. Genetics. 2002;159:907–911. doi: 10.1093/genetics/159.2.907. [DOI] [PMC free article] [PubMed] [Google Scholar]
- Gojobori T., Li W.H., Graur D., Li W.H., Graur D., Graur D. Patterns of nucleotide substitution in pseudogenes and functional genes. J. Mol. Evol. 1982;18:360–369. doi: 10.1007/BF01733904. [DOI] [PubMed] [Google Scholar]
- Häring D., Kypr J., Kypr J. No isochores in the human chromosomes 21 and 22? Biochem. Biophys. Res. Commun. 2001;280:567–573. doi: 10.1006/bbrc.2000.4162. [DOI] [PubMed] [Google Scholar]
- International Human Genome Sequencing Consortium Finishing the euchromatic sequence of the human genome. Nature. 2004;431:931–945. doi: 10.1038/nature03001. [DOI] [PubMed] [Google Scholar]
- Kent W.J., Sugnet C.W., Furey T.S., Roskin K.M., Pringle T.H., Zahler A.M., Haussler D.W.J., Sugnet C.W., Furey T.S., Roskin K.M., Pringle T.H., Zahler A.M., Haussler D.W.J., Furey T.S., Roskin K.M., Pringle T.H., Zahler A.M., Haussler D.W.J., Roskin K.M., Pringle T.H., Zahler A.M., Haussler D.W.J., Pringle T.H., Zahler A.M., Haussler D.W.J., Zahler A.M., Haussler D.W.J., Haussler D.W.J. The human genome browser at UCSC. Genome Res. 2002;12:996–1006. doi: 10.1101/gr.229102. [DOI] [PMC free article] [PubMed] [Google Scholar]
- Lander E.S., Linton L.M., Birren B., Nusbaum C., Zody M.C., Baldwin J., Devon K., Dewar K., Doyle M., FitzHugh W.E.S., Linton L.M., Birren B., Nusbaum C., Zody M.C., Baldwin J., Devon K., Dewar K., Doyle M., FitzHugh W.E.S., Birren B., Nusbaum C., Zody M.C., Baldwin J., Devon K., Dewar K., Doyle M., FitzHugh W.E.S., Nusbaum C., Zody M.C., Baldwin J., Devon K., Dewar K., Doyle M., FitzHugh W.E.S., Zody M.C., Baldwin J., Devon K., Dewar K., Doyle M., FitzHugh W.E.S., Baldwin J., Devon K., Dewar K., Doyle M., FitzHugh W.E.S., Devon K., Dewar K., Doyle M., FitzHugh W.E.S., Dewar K., Doyle M., FitzHugh W.E.S., Doyle M., FitzHugh W.E.S., FitzHugh W.E.S., et al. Initial sequencing and analysis of the human genome. Nature. 2001;409:860–921. doi: 10.1038/35057062. [DOI] [PubMed] [Google Scholar]
- Li W. Are isochore sequences homogeneous? Gene. 2002;300:129–139. doi: 10.1016/s0378-1119(02)00847-8. [DOI] [PubMed] [Google Scholar]
- Li W., Bernaola-Galván P., Carpena P., Oliver J.L., Bernaola-Galván P., Carpena P., Oliver J.L., Carpena P., Oliver J.L., Oliver J.L. Isochores merit the prefix ‘iso’. Comput. Biol. Chem. 2003;27:5–10. doi: 10.1016/s1476-9271(02)00090-7. [DOI] [PubMed] [Google Scholar]
- Macaya G., Thiery J.P., Bernardi G., Thiery J.P., Bernardi G., Bernardi G. An approach to the organization of eukaryotic genomes at a macromolecular level. J. Mol. Biol. 1976;108:237–254. doi: 10.1016/s0022-2836(76)80105-2. [DOI] [PubMed] [Google Scholar]
- Melodelima C., Gueguen L., Piau D., Gautier C., Gueguen L., Piau D., Gautier C., Piau D., Gautier C., Gautier C. Prediction of human isochores using a hidden Markov model. JOBIM. 2005;2005:427–434. [Google Scholar]
- Meselson M., Stahl F.W., Vinograd J., Stahl F.W., Vinograd J., Vinograd J. Equilibrium sedimentation of macromolecules in density gradients. Proc. Natl. Acad. Sci. 1957;43:581–588. doi: 10.1073/pnas.43.7.581. [DOI] [PMC free article] [PubMed] [Google Scholar]
- Mouchiroud D., D’Onofrio G., Aïssani B., Macaya G., Gautier C., Bernardi G., D’Onofrio G., Aïssani B., Macaya G., Gautier C., Bernardi G., Aïssani B., Macaya G., Gautier C., Bernardi G., Macaya G., Gautier C., Bernardi G., Gautier C., Bernardi G., Bernardi G. The distribution of genes in the human genome. Gene. 1991;100:181–187. doi: 10.1016/0378-1119(91)90364-h. [DOI] [PubMed] [Google Scholar]
- Nekrutenko A., Li W.H., Li W.H. Assessment of compositional heterogeneity within and between eukaryotic genomes. Genome Res. 2001;10:1986–1995. doi: 10.1101/gr.10.12.1986. [DOI] [PMC free article] [PubMed] [Google Scholar]
- Nishio Y., Nakamura Y., Kawarabayasi Y., Usuda Y., Kimura E., Sugimoto S., Matsui K., Yamagishi A., Kikuchi H., Ikeo K., Nakamura Y., Kawarabayasi Y., Usuda Y., Kimura E., Sugimoto S., Matsui K., Yamagishi A., Kikuchi H., Ikeo K., Kawarabayasi Y., Usuda Y., Kimura E., Sugimoto S., Matsui K., Yamagishi A., Kikuchi H., Ikeo K., Usuda Y., Kimura E., Sugimoto S., Matsui K., Yamagishi A., Kikuchi H., Ikeo K., Kimura E., Sugimoto S., Matsui K., Yamagishi A., Kikuchi H., Ikeo K., Sugimoto S., Matsui K., Yamagishi A., Kikuchi H., Ikeo K., Matsui K., Yamagishi A., Kikuchi H., Ikeo K., Yamagishi A., Kikuchi H., Ikeo K., Kikuchi H., Ikeo K., Ikeo K., et al. Comparative complete genome sequence analysis of the amino acid replacements responsible for the thermostability of Corynebacterium efficiens. Genome Res. 2003;13:1572–1579. doi: 10.1101/gr.1285603. [DOI] [PMC free article] [PubMed] [Google Scholar]
- Oliver J.L., Carpena P., Román-Roldán R., Mata-Balaguer T., Mejias-Romero A., Hackenberg M., Bernaola-Galván P., Carpena P., Román-Roldán R., Mata-Balaguer T., Mejias-Romero A., Hackenberg M., Bernaola-Galván P., Román-Roldán R., Mata-Balaguer T., Mejias-Romero A., Hackenberg M., Bernaola-Galván P., Mata-Balaguer T., Mejias-Romero A., Hackenberg M., Bernaola-Galván P., Mejias-Romero A., Hackenberg M., Bernaola-Galván P., Hackenberg M., Bernaola-Galván P., Bernaola-Galván P. Isochore chromosome maps of the human genome. Gene. 2002;300:117–127. doi: 10.1016/s0378-1119(02)01034-x. [DOI] [PubMed] [Google Scholar]
- Oliver J.L., Carpena P., Hackenberg M., Bernaola-Galván P., Carpena P., Hackenberg M., Bernaola-Galván P., Hackenberg M., Bernaola-Galván P., Bernaola-Galván P. IsoFinder: Computational prediction of isochores in genome sequences. Nucleic Acids Res. 2004;32:W287–W292. doi: 10.1093/nar/gkh399. [DOI] [PMC free article] [PubMed] [Google Scholar]
- Pačes J., Zika R., Pavliček A., Clay O., Bernardi G., Zika R., Pavliček A., Clay O., Bernardi G., Pavliček A., Clay O., Bernardi G., Clay O., Bernardi G., Bernardi G. Representing GC variation along eukaryotic chromosomes. Gene. 2004;333:135–141. doi: 10.1016/j.gene.2004.02.041. [DOI] [PubMed] [Google Scholar]
- Pavliček A., Pačes J., Clay O., Bernardi G., Pačes J., Clay O., Bernardi G., Clay O., Bernardi G., Bernardi G. A compact view of isochores in the draft human genome sequence. FEBS Lett. 2002;511:165–169. doi: 10.1016/s0014-5793(01)03283-5. [DOI] [PubMed] [Google Scholar]
- Saccone S., Federico C., Andreozzi L., D’Antoni S., Bernardi G., Federico C., Andreozzi L., D’Antoni S., Bernardi G., Andreozzi L., D’Antoni S., Bernardi G., D’Antoni S., Bernardi G., Bernardi G. Localization of the gene-richest and the gene-poorest isochores in the interphase nuclei of mammals and birds. Gene. 2002;300:169–178. doi: 10.1016/s0378-1119(02)01038-7. [DOI] [PubMed] [Google Scholar]
- Santini S., Bernardi G., Bernardi G. Organization and base composition of tilapia Hox genes: Implications for the evolution of Hox clusters in fish. Gene. 2005;346:51–61. doi: 10.1016/j.gene.2004.10.027. [DOI] [PubMed] [Google Scholar]
- Silverman B.W. Density estimation for statistics and data analysis. Chapman and Hall/CRC; Boca Raton, FL.: 1986. [Google Scholar]
- Smith N.G.C., Eyre-Walker A., Eyre-Walker A. Synonymous codon bias is not caused by mutation bias in G+C rich genes in human. Mol. Biol. Evol. 2001;18:982–986. doi: 10.1093/oxfordjournals.molbev.a003899. [DOI] [PubMed] [Google Scholar]
- Thiery J.P., Macaya G., Bernardi G., Macaya G., Bernardi G., Bernardi G. An analysis of eukaryotic genomes by density gradient centrifugation. J. Mol. Biol. 1976;108:219–235. doi: 10.1016/s0022-2836(76)80104-0. [DOI] [PubMed] [Google Scholar]
- Yunis J.J., Tsai M.Y., Willey A.M., Tsai M.Y., Willey A.M., Willey A.M.1977. Molecular organization and function of the human genome. In Molecular structure of human chromosomes (ed. J.J. Yunis). Academic Press; New York [Google Scholar]
- Zerial M., Salinas J., Filipski J., Bernardi G., Salinas J., Filipski J., Bernardi G., Filipski J., Bernardi G., Bernardi G. Gene distribution and nucleotide sequence organization in the human genome. Eur. J. Biochem. 1986;160:479–485. doi: 10.1111/j.1432-1033.1986.tb10064.x. [DOI] [PubMed] [Google Scholar]
- Zoubak S., Clay O., Bernardi G., Clay O., Bernardi G., Bernardi G. The gene distribution of the human genome. Gene. 1996;174:95–102. doi: 10.1016/0378-1119(96)00393-9. [DOI] [PubMed] [Google Scholar]


