Abstract
The ability to control the rate of adsorption and desorption of proteins from surfaces is studied by using a molecular theory. We show how changing the chemical structure and charge of short linear and branched grafted polymers to an electrode surface can be used to promote fast adsorption of charged proteins on a time scale of seconds and control the desorption in a time scale ranging from milliseconds to hours. The optimal controlled release is found from the interplay of electrostatic attractions at short distances from the surface and the proper electrostatic and steric repulsive barrier at distances from the surfaces larger than the proteins’ size. The implications of our results to the design of controlled-release devices is discussed.
Keywords: protein adsorption/desorption, surface modification, grafted polymers, kinetic theory
Control of protein adsorption is of primary importance in the design of biocompatible materials, biosensors, and bioactive surfaces (1–3). Furthermore, the process of protein adsorption is of great interest from a fundamental perspective because it encompasses very large, competing energy scales, and the process typically spans many time scales ranging from microseconds to hours (4, 5). Thus, a molecular understanding of the adsorption process and its control offers a great theoretical challenge in which energy, time, and length scales can be bridged. Furthermore, the ability to quantify how surface modifiers affect the adsorption/desorption process will help in the molecular design of materials interacting with biological fluids. The aim of the work presented here is to demonstrate that by the proper choice of polymers grafted to the surface one can take advantage of the interplay between electrostatic and steric interactions to control the time scale for adsorption and desorption. This surface modification can serve as the basis for the design of controlled-release devices (6, 7).
One of the most important, and still unresolved, problems in the design of biocompatible materials is the production of surfaces that can prevent nonspecific adsorption of blood proteins in vivo (8). There have been great advances in the understanding of how surface modification in vitro can reduce or prevent protein adsorption (9). There are two main ways of doing that. The first is by chemical modification of the surface exposed to the proteins (10). The second is by grafting polymer molecules on the surface exposed to the protein solution (11). The most commonly used polymer for this purpose is polyethylene glycol (PEG) (12); however, other polymers also have shown nonfouling capabilities (13). Grafted polymer layers have been shown to affect also the desorption of proteins. Experimental observations demonstrate that charged proteins may be trapped on poylelectrolyte grafted layers (14). Further, our recent theoretical predictions have shown that model PEG polymer layers can trap proteins adsorbed on hydrophobic surfaces, whenever the film thickness is larger than the protein size (15). Thus, the longer the molecular weight of the polymers forming the layer, at fixed surface coverage, the larger the desorption time. The question that arises is whether the desorption can be controlled by tuning experimentally accessible variables and the properties of the polymer layer.
Theory and Models
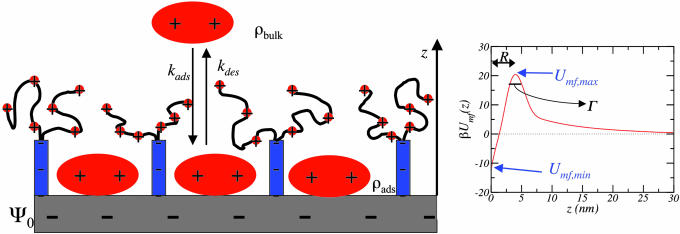
Consider a surface with grafted polymers that at time t = 0 is put into contact with a protein solution (Fig. 1). Typically, the presence of the polymers imposes a high potential barrier that the proteins need to cross to reach the surface (16–18). For these cases the amount of protein adsorbed as a function of time, ρpro,ads(t), can be described with an equation of the form
where ρbulk is the bulk solution protein concentration, and kads(des)(t) represents the rate coefficient for proteins to adsorb (desorb). The range of validity of this description of the kinetics of adsorption has been discussed elsewhere (15, 19), and it is valid for all of the cases of interest in here. The most important information that describes the time-dependent adsorption is in the rate coefficients. They show a very strong dependence on time because of the changes in the effective surface–protein potential arising from the deformation of the polymer–protein layer as proteins adsorb. Each of the two rate coefficients is the product of the Boltzmann factor for the free energy difference between the initial state and the barrier maximum and a preexponential factor that depends on the curvature of the potential at the barrier and the length that the proteins need to travel to reach the transition state (15, 18) (see Fig. 1).
Fig. 1.
Description of adsorption and desorption process. (Left) Schematic representation of an electrode surface with grafted polymers and adsorbed proteins. The salt and solvent molecules are not shown for simplicity. The processes of adsorption and desorption are denoted as well as other quantities explained in the text. The specific polymer modification schematically shown is described in the text and corresponds to the calculation presented in Figs. 3 and 4. (Right) The curve shows the potential of mean–force calculated with the molecular theory for the polymers drawn on Left, and model lysozyme, Dprot = 3 nm, for ρpro,ads = 10 ng/cm2 and Ψ0 = −200 mV. The characteristics of the potentials of mean–force necessary for the calculation of the rate constants are marked in the potential (see Fig. 2 and discussion thereafter).
Once the adsorption reaches equilibrium, we are interested in controlling the desorption of the proteins as a function of time. The process of interest is one in which, after the proteins have adsorbed, the solution in contact with the surface is changed by one with salted water. The lack of proteins on the bulk solution implies that there is an entropic driving force for the proteins to desorb. The time-dependent process will depend on the rate coefficient for desorption. From Eq. 1 we obtain
where we have defined the (time-dependent) characteristic desorption time by τ(t) = 1/kdes(t). The design of a given protocol for the controlled release of the proteins from the surface is given completely in τ(t). For example, an exponential release of the proteins implies τ(t) = constant, and the value of the constant will determine the time scale for the desorption process. Another interesting example is that of constant release rate: in that case, one has τ(t) = Kρpro,ads(t), where K is the value of the constant release rate. The next question is what determines the value of τ(t) and how can we control its value and time variation through experimentally tunable variables.
τ(t) is determined by the effective potential of interaction between the proteins and the surface. The time-dependent potential depends on the nature of the surface, the type of surface modifier (grafted polymers), and the amount of proteins adsorbed on the surface. We consider the case in which the surface is an electrode whose surface potential Ψ0(t) is an experimentally controllable variable (20, 21). Thus, the driving force for the adsorption that we consider here is the electrostatic attractions between the electrode surface and the proteins. The basic physical assumption in describing the kinetics of adsorption and desorption using Eqs. 1 and 2 is a separation of time scales between the slow motion of the proteins and the fast response from local polymer motion and the rearrangement of solvent and ions. Thus, for a given configuration of the proteins, all other degrees of freedom equilibrate. Under these conditions, we can determine the surface–protein effective potential, or, more appropriately, the potential of mean–force, by calculating the constrained free energy minimum of a system of polymer, solvent, ions for a fixed distribution of proteins (Fig. 1). The relevant molecular organization of the modified surface contains proteins in the bulk and adsorbed in a monolayer, whereas in between them there is a depletion of proteins due to the large repulsions imposed by the grafted polymers (15, 17).
The free energy is obtained from a molecular approach that we have developed in which the size, shape, conformations, and charge distribution of each molecular species are explicitly accounted for (17, 22, 23). The predictions of the theory are in excellent quantitative agreement with experimental observations for the adsorption isotherms of lysozyme and fibrinogen on surfaces with grafted PEG for a large variety of polymer molecular weights, in all ranges of polymer surface coverage (19, 24). Thus, we are confident that the application of the theory for the systems of interest here is reliable. According to this molecular approach the free energy (W) density, per unit area (A), of a system composed by a surface with grafted polymers at surface coverage σpol in equilibrium with a solution containing dissociated monovalent salt at concentration csalt with ρpro,ads proteins adsorbed on the surface is given by
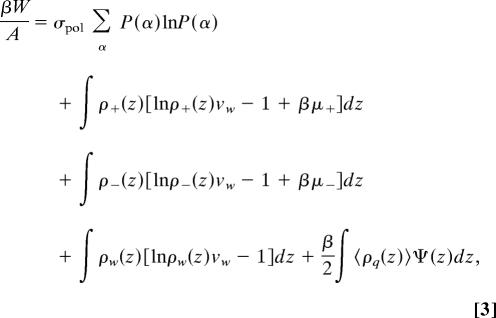 |
where β = 1/kBT is the inverse temperature. The first term represents the conformational entropy of the polymer chains, with P(α) being the probability distribution function (pdf) of finding the polymer in conformation α. The following three integrals represent the z dependent translational (mixing) entropy contribution of the cations, anions, and solvent, respectively, with ρi(z), i = +, −, or w representing the distance dependent density of i, and vw is the volume of a water molecule, which is used as the unit of volume. For the cations and anions there is also a chemical potential term that ensures equilibrium with the bulk. The last integral is the electrostatic contribution, with 〈ρq(z)〉 representing the total average charge density at z which is given by
 |
with the first term representing the average over all polymer conformations of the charge that the polymers contribute to z, the second term is the charge that the adsorbed proteins have at z, and the last two terms represent the cations and anions contributions, respectively. The last two terms assume that the ions are spherical, and their charge is found at the center of the ion.
The intermolecular (hard-core) repulsive interactions are accounted for through packing constraints. At each distance z from the surface the total volume available is filled by polymers, protein, cations, anions, and solvent. Namely,
 |
The pdf of chain conformations and the solvent, cations, and anions density profiles are determined by minimization of the free energy (Eq. 3) subject to the packing constraints (Eq. 5). This minimization is done by introducing Lagrange multipliers, βπ(z). For example, the pdf of chain conformations is given by
 |
where q is the normalization factor. The numerical values of the lateral pressures, π(z), and the electrostatic potential, Ψ(z), are determined by introducing the explicit form of the pdf (Eq. 6), and the density profiles (data not shown), into the constraint equations (Eq. 5), and the set of equations obtained is solved together with the Poisson equation, as required from electrostatics
where the average charge is given by Eq. 4. The set of coupled equations requires as input the set of polymer conformations, from which the conformational dependent volume and charge distributions are obtained; the size, shape, and charge distribution of the proteins, cation, and anion; the bulk salt concentration, csalt; and the fixed amount of proteins on the surface, ρpro,ads. A change in the polymer chemical architecture implies a different set of input conformations. For more details and the numerical methodology see refs. 17, 22, and 23.
The knowledge of the interaction and electrostatic fields, π(z) and Ψ(z), respectively, for each value of the applied surface potential and the number of adsorbed proteins enables us to determine the potential of mean–force between the proteins and the surface using
 |
where Dprot is the size of the protein. From the knowledge of Umf(z) we can determine the rate coefficients, because kdes = 1/τ = C((e−βΔU)/(RΓ)), where ΔU = Umf,max − Umf,min, R is the distance between the positions of Umf,max and Umf,min, Γ is the width of the potential of mean–force kBT below the maximum (see Fig. 1 and ref. 15), and C is a constant.
The range of externally applied surface potentials that we chose is Ψ(0) = 0, −350 mV. These values represent a reasonable experimentally accessible range of surface potentials, as has been used in switchable surfaces (20) and in the controlled release of DNA from gold electrodes (21). For the amount of proteins adsorbed, the range goes from no protein to the equilibrium amount that can adsorb at each different Ψ(0). Therefore, we obtain a three-dimensional surface with τ as a function of surface potential and amount of proteins adsorbed.
We present results for four different types of surface modifiers. In all cases, the surface density of polymers is the same, but their chemical structure is different. The four different grafted layers are as follows. (i) The first case is linear PEG 3300, i.e., 75 segments. (ii) The next case is three-branched PEG, where each branch has 25 segments, with one branch end-grafted to the surface. (iii) The third case is linear chains with charged groups distributed in the following way. In the first 25 segments, counting from the grafting point, every other segment is functionalized with a negatively charged group, with a total of 12 negative charges. The next 50 segments have a functionalized, positively charged group, every five units. (iv) In the final case, the polymer chains are composed of three branches. The grafted branch is a rigid rod with 12 charges. This block is aimed at mimicking grafted-DNA oligomers similar to the type that has been studied experimentally (25). The two free branches, each of 25 segments, are flexible and have one positive charge every five segments (see Fig. 1).†
The reasoning behind each of the choices for the molecular architecture is the following. First, linear PEG is the most widely used grafted polymer for nonfouling purposes. Furthermore, our earlier work on PEG grafted on hydrophobic surfaces shows that for lysozyme, PEG 3300 can trap the adsorbed proteins, resulting in slow desorption (15). The branched polymers were chosen because our earlier work (26) showed that branched polymers have the potential to present a larger barrier for adsorption/desorption as compared with the linear chains. These larger barriers could enable better control of the release rate. The charged polymers combine the advantages of the flexible, neutral, PEG with the addition of the negative charges close to the surface that provide for a better attraction to the positively charged adsorbed proteins (14). The positively charged segments of the polymers, away from the surface, present a combined steric and electrostatic barrier for the desorbing proteins. Finally, the DNA-like branch is used to provide better possibility of surface packing to the adsorbed proteins because the rigid branch is expected to accommodate perpendicular to the surface, serving as a charged template for further protein attraction, whereas its rigid structure does not result in too much entropic repulsion of the proteins.
Results and Discussion
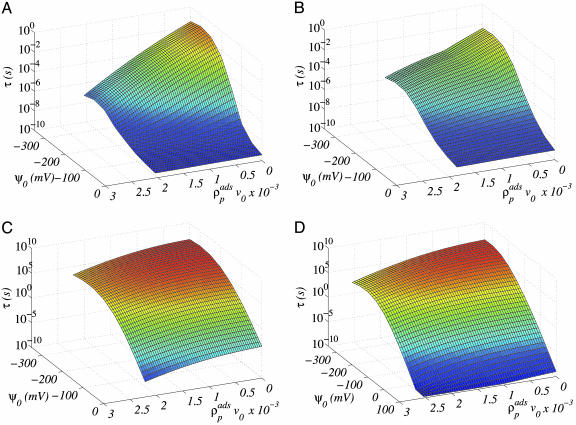
The characteristic protein desorption time as a function of applied potential and density of adsorbed protein for four surfaces modified with the different types of grafted molecules are shown in Fig. 2 for model lysozyme. For all molecular architectures the desorption time is an increasing function of the surface potential and a decreasing function of the amount of proteins adsorbed. The surface potential is the driving force for adsorption, and therefore the larger the absolute value of the applied potential, the stronger the attraction of the protein to the surface. Protein–protein interactions are mostly repulsive. Thus, the effect of increasing the local concentration of proteins is to increase the repulsive component of the potential of mean–force, resulting in shorter desorption time.
Fig. 2.
The desorption time (in seconds), in logarithmic scale, as a function of the amount of adsorbed proteins and the potential applied on the surface for four different molecular architectures of the grafted polymers. The calculations are for lysozyme with the model used in ref. 19. The total charge on the protein is 8e. The bulk salt concentration is csalt = 0.001 M. The polymer surface coverage in all cases is σpol = 0.11 nm−2. All other molecular parameters are as presented in ref. 19 for the polymers and ref. 23 for the ions. The protein density is converted into ng/cm2 by multiplying by 7,920. The four graphs correspond to linear model PEG (A), branched PEG (B), linear charged (C), and branched charged (D).
An interesting aspect of Fig. 2 is the magnitude of the desorption times for the different polymer architectures. The maximal desorption time for linear and branched PEG are ≈10−1 and 1 s, respectively, for the charged polymers the time increases by several orders of magnitude. Both charged polymers, the linear and the DNA with two flexible branches, show almost identical desorption characteristic times. The reason is that under the conditions studied here the dominant conformations of both types of chains upon adsorption of the proteins are very similar. Note that for the DNA-branched chains we have calculated τ including positive values of the potential. Even under these conditions there is a finite amount of proteins adsorbed because of the DNA–protein attraction.
The combination of positively and negatively charged segments along the polymers is very important for two purposes. First, it enhances the amount of proteins adsorbed through the negatively charged block. Second, the positively charged segments present a steric and electrostatic barrier for desorption, at the appropriate distance form the surface, that is very large. An estimate of the role of the electrostatic contribution to the barrier for desorption can be obtained by comparing the branched (uncharged) PEG with the charged case. There are 8 orders of magnitude difference between them, showing the very important role played by the charges. It should be mentioned that the polymeric character of the molecules is what enables the proper distribution of both positively and negatively charged groups to obtain optimal adsorption/desorption control. A specific example of the total potential of mean–force felt by the proteins in the presence of adsorbed proteins is shown in Fig. 1. Note the position of the maximal repulsion because of the positively charged branches at a distance from the surface larger than the protein size and the large attractive interaction at contact with the surface.
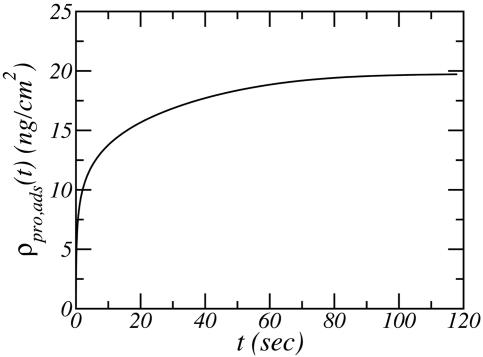
We are now in position to design the conditions for a controlled-release device by using the results presented in Fig. 2. We concentrate our attention only on the charged polymer modifiers. The reason is that for the PEG chains at the conditions studied, the slowest desorption time that can be achieved is such that in milliseconds to <1 second all of the proteins desorb. Only for the two charged polymers can the desorption be controlled in an experimental relevant time scale. Further, the two charged systems show kinetics of desorption and adsorption that are very similar, and thus we choose to present the ones for the DNA-grafted with two positively charged branches. The first step is to determine that the adsorption time is reasonable. To this end, Fig. 3 shows the adsorption of model lysozyme as a function of time for a constant potential on the electrode of Ψ0 = −300 mV. The adsorption reaches its equilibrium value in a time scale of 2 min, which is fast and reasonable. We could increase the desired amount of adsorbed proteins by increasing the surface potential applied. However, the example shown in Fig. 3 is enough for illustrative purposes.
Fig. 3.
Amount of adsorbed lysozyme as a function of time for a surface modified with branched charged molecules. The surface potential is Ψ0 = −300 mV. All other conditions are as in Fig. 2.
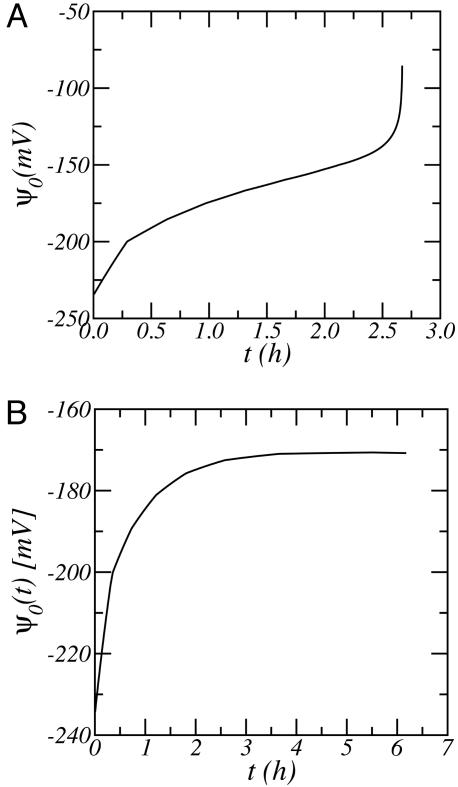
The release of the proteins from the surface can be controlled by the proper choice of time-dependent potential applied to the surface. The two examples that we show consider very different release mechanisms. One case is that of constant release rate. This case may be an important one for drug delivery devices. Using Eq. 2, this mechanism implies that the time-dependent amount of proteins adsorbed decreases linearly with time. Namely, ρpro,ads(t) = ρpro,ads(0) − Rt, where R is the desired constant release rate, and it is related to the desorption time by R = ρpro,ads(t)/τ(t). The potential on the surface is determined at each time step by finding, from Fig. 2, the value of Ψ0(t) that corresponds to the pair of values ρpro,ads(t), τ(t) such that τ(t) = Rρpro,ads(t). The second case is an exponential desorption of the proteins from the surface. In this case τ(t) is constant, and its value depends on the desired rate of decay of the protein population. The necessary potential to apply on the surface is obtained by following a contour of constant rate, from Fig. 2, with the desired value.
An example of each of these cases are shown in Fig. 4. The protocols of applied surface potential as a function of time to be used for the desired desorption mechanisms are presented. In both cases, the time scale for the process is measured in hours, and the rate of change of the potential is not very large and therefore is suitable for the design of experimental systems. Furthermore, the very different variation of the surface potential with time for the two mechanisms demonstrates the feasibility of designing well defined desorption processes.
Fig. 4.
The electrostatic potential necessary on the electrode as a function of time for the following. (A) Constant release rate, i.e., linear decrease of the adsorbed proteins as a function of time. The calculations correspond to τ(t) = 5 × 10⁶ s × ρpro,ads(t). (B) Exponential decay of the amount of proteins adsorbed, i.e., τ(t) = constant = 104 s. All other conditions for both graphs are as in Fig. 2.
Conclusions
To summarize, we have shown that modification of electrode surfaces with tethered polymers is a very versatile way to control the amount and time scale for adsorption and desorption of proteins to the surface. Most of the early work in the field concentrated on the ability of grafted polymers to prevent nonspecific adsorption of proteins. Here we take advantage of what we have learned from those systems to design surfaces that can be used for the controlled release of proteins on time scales that can be varied over many orders of magnitude. The surfaces considered are electrodes where the bare protein–surface interactions can be controlled by the application of an electrostatic potential. The specific type of polymer molecular architecture that shows optimal behavior combines the effects of steric and electrostatic interactions with optimal distance dependence for the protein studied. The total interactions can be optimized to make the surfaces overall attractive or repulsive by changing the state of charge through the potential applied. The cases presented above show specific examples with time scales that are attractive for the design of controlled-release devices (6, 7). Furthermore, variation of the polymer surface coverage, solution ionic strength, and pH are other variables that can be used to further tune the conditions, enabling a rational design of switchable surfaces with a very wide range of adsorption/desorption capabilities. The study cases presented here are aimed at showing the feasibility of the approach, and the combination of these type of theoretical studies with experimental observations will enable the systematic build up of controllable, switchable surfaces for interactions with biological environments. Moreover, the same ideas can be applied to control the adsorption/desorption behavior of charged nanoparticles.
Acknowledgments
This work was supported by National Science Foundation Grant CTS-0338377.
Abbreviations
- PEG
polyethylene glycol
probability distribution function.
Footnotes
Conflict of interest statement: No conflicts declared.
This paper was submitted directly (Track II) to the PNAS office.
We have also studied other five different molecular architectures that combine elements of the four cases presented. However, their behavior is in between the ones shown here, and therefore we do not discuss them.
References
- 1.Ratner B., Hoffman A., Schoen F., Lemons J., editors. Biomaterials Science: An Introduction to Materials in Medicine. London: Elsevier Academic; 2004. [Google Scholar]
- 2.Nakamura H., Karube I. Anal. Bioanal. Chem. 2003;377:446–468. doi: 10.1007/s00216-003-1947-5. [DOI] [PubMed] [Google Scholar]
- 3.Wisniewski N., Reichert M. Colloids Surf. B. 2000;18:197–219. doi: 10.1016/s0927-7765(99)00148-4. [DOI] [PubMed] [Google Scholar]
- 4.Andrade J., Hlady V. Adv. Polymer Sci. 1986;79:1–63. [Google Scholar]
- 5.Malmsten M., editor. Biopolymers at Interfaces. New York: Marcel Dekker; 2003. [Google Scholar]
- 6.Murdan S. J. Controlled Release. 2003;92:1–17. doi: 10.1016/s0168-3659(03)00303-1. [DOI] [PubMed] [Google Scholar]
- 7.Haider M., Megeeda Z., Ghandehari H. J. Controlled Release. 2004;95:1–26. doi: 10.1016/j.jconrel.2003.11.011. [DOI] [PubMed] [Google Scholar]
- 8.Leonard E., Turitto V., Vincent T., Vroman L., editors. Blood in Contact with Natural and Artificial Surfaces. New York: N.Y. Acad. Sci.; 1987. [PubMed] [Google Scholar]
- 9.Nath N., Hyun J., Ma H., Chilkoti A. Surface Sci. 2004;570:98–110. [Google Scholar]
- 10.Ostuni E., Chapman R. G., Holmlin R. E., Takayama S., Whitesides G. M. Langmuir. 2001;17:5605–5620. doi: 10.1021/la0015258. [DOI] [PubMed] [Google Scholar]
- 11.Golander C.-G., Herron J. N., Lim K., Claesson P., Stenius P., Andrade J. In: Properties of Immobilized PEG Films and the Interaction with Proteins: Experiments and Modeling. Harris J., editor. New York: Plenum; 1992. pp. 221–246. [Google Scholar]
- 12.Harris J. M., Zalipsky S., editors. Poly(Ethylene Glycol): Chemistry and Biological Applications, American Chemical Society Symposium Series. Washington, DC: Am. Chem. Soc.; 1997. No. 680. [Google Scholar]
- 13.Szleifer I. Curr. Opin. Solid State Mater. Sci. 1997;2:337–344. [Google Scholar]
- 14.Sukhishvili S., Granick S. J. Chem. Phys. 1999;110:10153–10161. [Google Scholar]
- 15.Fang F., Satulovsky J., Szleifer I. Biophys. J. 2005;89:1516–1533. doi: 10.1529/biophysj.104.055079. [DOI] [PMC free article] [PubMed] [Google Scholar]
- 16.Jeon S. I., Lee J. H., Andrade J. D., de Gennes P. G. J. Colloid. Interface Sci. 1991;142:149–158. [Google Scholar]
- 17.Szleifer I. Biophys. J. 1997;72:595–612. doi: 10.1016/s0006-3495(97)78698-3. [DOI] [PMC free article] [PubMed] [Google Scholar]
- 18.Halperin A. Langmuir. 1999;15:2525–2533. [Google Scholar]
- 19.Satulovsky J., Carignano M. A., Szleifer I. Proc. Natl. Acad. Sci. USA. 2000;97:9037–9041. doi: 10.1073/pnas.150236197. [DOI] [PMC free article] [PubMed] [Google Scholar]
- 20.Lahann J., Mitragotri S., Tran T., Kaido H., Sundaram J., Choi I. S., Hoffer S., Somorjai G. A., Langer R. Science. 2003;299:371–374. doi: 10.1126/science.1078933. [DOI] [PubMed] [Google Scholar]
- 21.Takeishi S., Rant U., Fujiwara T., Buchholz K., Usuki T., Arinaga K., Takemoto K., Yamaguchi Y., Tornow M., Fujita S., et al. J. Chem. Phys. 2004;120:5501–5504. doi: 10.1063/1.1643729. [DOI] [PubMed] [Google Scholar]
- 22.Carignano M. A., Szleifer I. Mol. Phys. 2002;100:2993–3003. [Google Scholar]
- 23.Fang F., Szleifer I. J. Chem. Phys. 2003;119:1053–1065. [Google Scholar]
- 24.McPherson T., Kidane A., Szleifer I., Park K. Langmuir. 1998;14:176–186. [Google Scholar]
- 25.Steel A. B., Levicky R., Herne T. M., Tarlov M. Biophys. J. 2000;79:975–981. doi: 10.1016/S0006-3495(00)76351-X. [DOI] [PMC free article] [PubMed] [Google Scholar]
- 26.Szleifer I. Physica A. 1997;244:370–388. [Google Scholar]


