Abstract
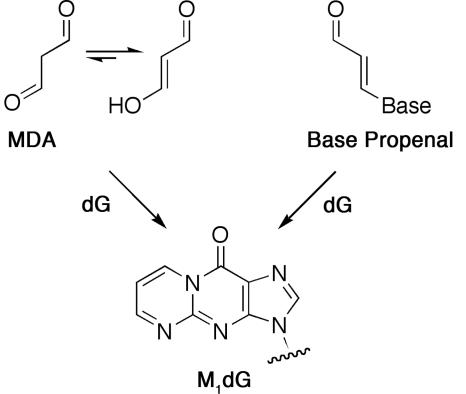
3-(2-Deoxy-β-d-erythro-pentofuranosyl)pyrimido[1,2-α]purin-10(3H)-one (M1dG) is a DNA adduct arising from the reaction of 2-deoxyguanosine with the lipid peroxidation product, malondialdehyde, or the DNA peroxidation product, base propenal. M1dG is mutagenic in bacteria and mammalian cells and is present in the genomic DNA of healthy human beings. It is also detectable, albeit at low levels, in the urine of healthy individuals, which may make it a useful biomarker of DNA damage linked to oxidative stress. We investigated the possibility that the low urinary levels of M1dG reflect metabolic conversion to derivatives. M1dG was rapidly removed from plasma (t1/2 = 10 min) after i.v. administration to rats. A single urinary metabolite was detected that was identified as 6-oxo-M1dG by MS, NMR spectroscopy, and independent chemical synthesis. 6-Oxo-M1dG was generated in vitro by incubation of M1dG with rat liver cytosols, and studies with inhibitors suggested that xanthine oxidase and aldehyde oxidase are involved in the oxidative metabolism. M1dG also was metabolized by three separate human liver cytosol preparations, indicating 6-oxo-M1dG is a likely metabolite in humans. This represents a report of the oxidative metabolism of an endogenous DNA adduct and raises the possibility that other endogenous DNA adducts are metabolized by oxidative pathways. 6-Oxo-M1dG may be a useful biomarker of endogenous DNA damage associated with inflammation, oxidative stress, and certain types of cancer chemotherapy.
Keywords: excretion, inflammation, DNA damage, oxidation, metabolite
DNA damage from endogenous sources is believed to contribute significantly to human genetic diseases, including cancer (1, 2). A major cause of endogenous DNA damage is oxidation (3, 4). Agents such as hydroxyl radical or peroxynitrous acid oxidize nucleic acid bases or the deoxyribose backbone to form miscoding lesions or induce strand breaks (5). In addition, oxidation of other cellular constituents (i.e., lipid, protein) generates reactive derivatives that form adducts with nucleic acid bases (1). In the absence of repair, this panoply of damage results in mutations, triggers signaling to arrest cell division, or induces apoptosis.
3-(2-Deoxy-β-d-erythro-pentofuranosyl)pyrimido[1,2-α]purin-10(3H)-one (M1dG) is an adduct found at varying levels in genomic DNA of rodents and humans (6–8). It is derived from the lipid oxidation product, malondialdehyde, or the DNA oxidation product, base propenal (Scheme 1) (9–11). M1dG is miscoding when assayed by in vitro DNA replication and is mutagenic in bacterial and mammalian cells (12–14). It induces base pair substitutions (M1dG→T and M1dG→A) and frameshift mutations in reiterated sequences (e.g., CGn) when shuttle vectors containing a site-specific lesion are replicated in COS-7 cells (14). Genetic and biochemical experiments indicate that M1dG is removed by nucleotide excision repair in both bacterial and mammalian cells (13–15).
Scheme 1.
As a prerequisite for preclinical, clinical, and population-based studies of the factors that contribute to the production of M1dG, we are developing assays to quantify the adduct in urine. We recently described a highly sensitive and specific method based on immunoaffinity purification and liquid chromatography (LC)-MS (16, 17). Application of this technique reveals that M1dG is detectable in the urine of healthy human volunteers in amounts corresponding to 10–20 fmol/kg per 24 h (17). These values are several orders of magnitude lower than the levels reported for another oxidative DNA lesion, 8-oxo-dG (≈400 pmol/kg per 24 h) (18). The lower levels of M1dG may reflect lower levels in genomic DNA, less efficient repair, or differential processing before excretion. Previous studies have established that DNA adducts from xenobiotics (ethylene dibromide) or drugs that are based on nucleobases (O6-benzylguanine, allopurinol) are metabolized by hydrolytic processing to mercapturic acids or by oxidation, respectively (19–21). However, no reports suggest that endogenous DNA lesions are metabolized after repair. We report here that M1dG is oxidized in rats to a 6-oxo derivative, and that enzymes of the purine salvage pathway appear to play a role. This suggests the possibility that other endogenous DNA lesions may be metabolized after they are repaired, and that an additional, as yet unaccounted for, population of adducts may exist in urine that could serve as biomarkers of endogenous DNA damage.
Results
Sprague–Dawley rats, cannulated in the femoral and jugular veins, were obtained commercially and housed in metabolic cages during the course of the experiment. M1dG (2 mg/kg) was administered i.v. in the jugular vein, and whole blood was drawn at intervals from the femoral vein. Additionally, urine was collected over the time course of the study to monitor the excretion of M1dG. Plasma and urine extracts were separated by reversed-phase HPLC, and eluting peaks were detected by either UV absorbance or positive ion electrospray ionization LC tandem MS. M1dG in plasma samples was analyzed by selective reaction monitoring after the neutral loss of deoxyribose from M1dG (m/z 304.3 → 188.3) and quantified against a standard curve.
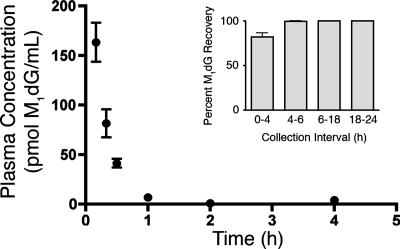
Fig. 1 displays the time course of M1dG disappearance from plasma after i.v. administration. M1dG was rapidly removed from plasma with a half-life of approximately 10 min. Parallel analysis of urine samples revealed that the disappearance of M1dG was not solely accounted for by rapid elimination of M1dG in the urine. Approximately 80% of the total excreted M1dG was recovered during the first 4 h of urine collection (Fig. 1 Inset), and M1dG was detectable as long as 24 h after administration (data not shown).
Fig. 1.
Time course of M1dG disappearance from plasma after i.v. administration. M1dG (2 mg/kg) was administered to male Sprague–Dawley rats (n = 3). Quantification was performed by LC–tandem MS with selected reaction monitoring of M1dG after the MH+ transition of 304.3 → 188.3. (Inset) Time course for appearance of M1dG in urine after i.v. administration of M1dG (n = 3).
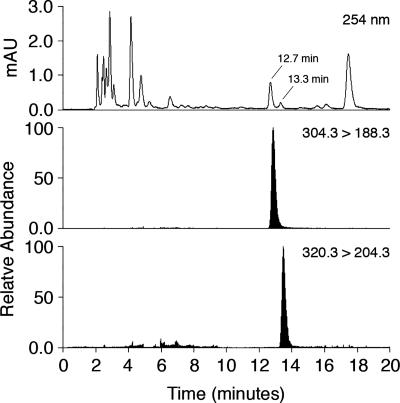
The rapid disappearance of M1dG from plasma suggested it was rapidly distributed to tissue, which increased the likelihood of its biotransformation. Urine and plasma samples were probed for the presence of metabolites containing an additional oxygen atom by performing HPLC with selected reaction monitoring of m/z = 320.3 → 204.3. Fig. 2 displays a representative profile from a urine extract collected 0–4 h after administration of M1dG. A single peak that eluted shortly after M1dG was detected. UV profiles from predose urine showed nearly identical background traces to those from the dosed samples, with the exception of peaks eluting at 12.8 and 13.5 min (corresponding to M1dG and the putative metabolite, respectively). The putative metabolite also was observed in plasma 1 h after administration. M1dG was stable in urine and did not exhibit conversion to the putative metabolite on standing at room temperature for up to 24 h. Attempts to discover additional metabolites in the urine samples were unsuccessful. For example, treatment with β-glucuronidase yielded neither M1dG nor the later eluting product, suggesting neither of these compounds is a substrate for glucuronidation in vivo.
Fig. 2.
LC-UV and LC–tandem MS analysis of urine from rats treated with M1dG. M1dG (2 mg/kg) was administered to Sprague–Dawley and urine collected from 0 to 4 h. M1dG was monitored by the transition 304.3 → 188.3 and the putative oxidized metabolite by the transition 320.3 → 204.3.
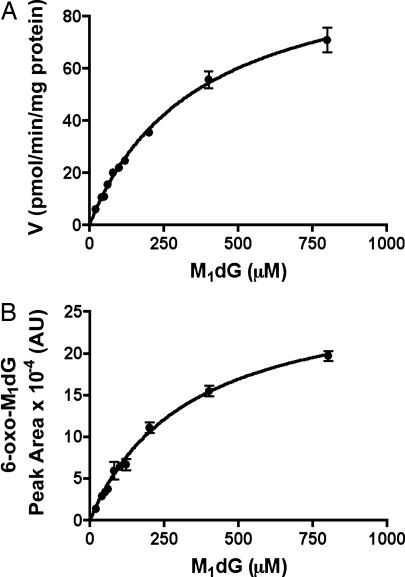
These in vivo studies suggested M1dG is subject to oxidation before excretion. In an attempt to characterize the pathway(s) responsible for metabolism, M1dG was incubated with liver microsomal and cytosol fractions prepared from Sprague–Dawley rats. Microsomal fractions failed to metabolize M1dG either in the absence or presence of NADPH. However, cytosolic fractions rapidly converted M1dG to a single product that exhibited an HPLC retention time and mass spectrum identical to the product detected in urine. Metabolite formation depended on substrate concentration, protein concentration, and time of incubation (data not shown). Oxidation of M1dG by rat liver cytosol exhibited a Km of 370 μM and a Vmax of 104 pmol/min per mg protein (Fig. 3A). Fig. 3B displays the M1dG concentration dependence of product formation. There was a close correspondence between the concentration dependence of M1dG consumption and that for product formation. The latter demonstrated a Km of 330 μM.
Fig. 3.
Concentration dependence of M1dG oxidation by rat liver cytosol. (A) M1dG consumption; (B) metabolite formation. Incubations were conducted for 60 min with rat liver cytosol (5 mg protein/ml) prepared from male Sprague–Dawley rats. M1dG consumption was calculated by reference to a standard curve (Km = 370 μM and Vmax = 104 pmol/min per mg of protein), whereas product formation was based on peak area production (Km of 330 μM).
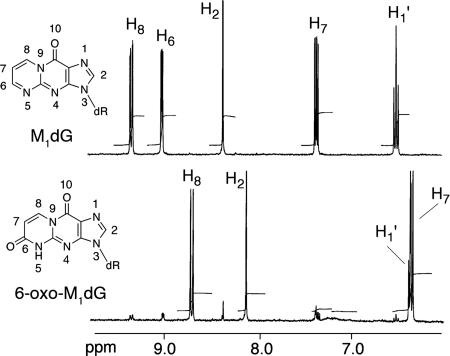
To identify the product of in vitro enzymatic oxidation, 20 ml of concentrated rat liver cytosol (20 mg/ml) was incubated with 10 mg of M1dG, and oxidation was allowed to proceed to completion. The metabolite was purified and dissolved in D2O for NMR analysis (Fig. 4). A small amount of unreacted M1dG was apparent in the 1H-NMR spectrum of the purified product. Detection of the singlet at 8.13 ppm in the product spectrum, corresponding to the H2 proton, indicated that oxidation had not occurred on the imidazole ring. By comparison with the M1dG spectrum, it was apparent that only two of the three pyrimidopurinone ring protons (H6, H7, H8) remained in the product spectrum, indicating that oxidation had occurred in this ring. The doublets at 8.71 and 6.35 ppm were coupled (confirmed by a correlation spectroscopy experiment), indicating the presence of a double bond conjugated to a carbonyl group. This implied oxidation at either the 6 or 8 position of the pyrimidopurinone ring. 13C-NMR revealed a shift of the peak corresponding to C6 (162 ppm) in the M1dG spectrum and appearance of a new peak at 149.8 ppm in the product spectrum. A heteronuclear multiple bond correlation–NMR experiment identified strong three-bond proton–carbon correlations between the proton assigned as H8 and carbons C4a, C6, and C10. This enabled the assignment of the structure as 6-oxo-M1dG (Fig. 4 and Fig. 6, which is published as supporting information on the PNAS web site).
Fig. 4.
1H-NMR spectrum of M1dG (Upper) and the M1dG metabolite prepared using rat liver cytosol (Lower).
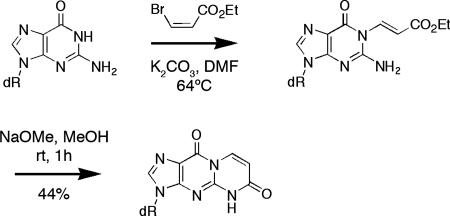
To confirm the assigned structure of the metabolite, a synthesis of 6-oxo-M1dG was designed and executed (Scheme 2). 3-Bromo-ethylacrylate was reacted with dG under basic conditions producing 1,N-ethyl-3-carboxyethenyl-dG. The exocyclic N2 nitrogen was activated by the addition of sodium methoxide to promote lactam formation by intramolecular acylation. The synthesized product displayed identical mass and UV and NMR spectra to the biochemically produced metabolite and the two cochromatographed by reversed-phase HPLC. This unambiguously identified the major in vitro metabolite of M1dG as 6-oxo-M1dG. The mass spectrum and chromatographic behavior of synthetic 6-oxo-M1dG were identical to those of the in vivo M1dG metabolite.
Scheme 2.
In an attempt to provide a preliminary characterization of the enzymes responsible for M1dG oxidation, incubations with rat liver cytosol were conducted in the presence of allopurinol (160 μM) or menadione (160 μM) to inhibit xanthine oxidase or aldehyde oxidase, respectively. In reference to the vehicle control, M1dG metabolism was inhibited by allopurinol (7%) and stimulated by menadione (195%). Menadione and other quinones can be reduced by flavoproteins such as xanthine oxidase during the oxidation of reducing substrates (22), thereby stimulating oxidation (23, 24). Thus, preliminary in vitro data implicate xanthine oxidase in the oxidation of M1dG in rat liver cytosol.
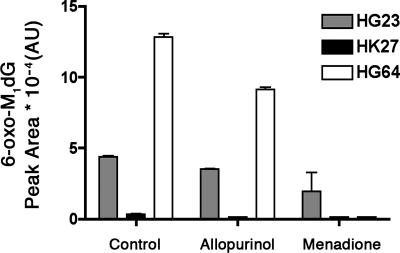
Three separate human liver cytosol preparations (HG23, HK27, and HG64) were obtained from commercial sources and evaluated for their ability to oxidize M1dG in the presence or absence of allopurinol or menadione (Fig. 5). All three preparations oxidized M1dG to 6-oxo-M1dG, but the variation in individual activities was significant. Some inhibition of oxidation was observed in the presence of allopurinol, but greater inhibition was observed with menadione. This suggests that aldehyde oxidase as well as xanthine oxidase plays a significant role in the metabolism of M1dG in humans. Further experiments are necessary to more completely characterize the enzymology of metabolism of M1dG in humans and in rats, but our results indicate that human liver cytosols are capable of catalyzing M1dG oxidation in a fashion qualitatively similar to rat liver cytosols.
Fig. 5.
Oxidation of M1dG by human liver cytosols (HLC). M1dG (370 μM) was incubated with three separate preparations of HLC (5 mg/ml, 60 min): HG23 (gray), HK27 (black), and HG64 (white).
Our in vitro data on the metabolism of M1dG suggest the involvement of aldehyde oxidase and xanthine oxidase. Based on our inhibition data, aldehyde oxidase appears to play a more significant role in the metabolism of M1dG in human liver cytosol than in rat liver cytosol, whereas xanthine oxidase appears to be involved in both species. The precise role of aldehyde oxidase in the production of 6-oxo-M1dG in rat liver cytosol is less clear due to the stimulatory effect of menadione. The concentration used in the incubations (160 μM) is quite sufficient to inhibit aldehyde oxidase (23) but may act to stimulate the metabolism of another enzyme, thereby masking the inhibition of aldehyde oxidase.
Discussion
Considerable effort has been expended to develop biomarkers of DNA damage for use in human clinical and population-based studies as well as in animal investigations. Quantification of repaired adducts in urine represents a particularly attractive approach. Various methodologies have been described for quantification of alkylated deoxynucleosides and nucleobases, oxidized deoxynucleosides and nucleobases, polycyclic aromatic hydrocarbon-derived adducts, aflatoxin-derived adducts, and cis-Pt-derived adducts (25). The oxidized guanine adducts, 8-oxo-G and 8-oxo-dG, have been reported to be present in the urine of healthy human donors at levels of ≈2 nmol/kg per 24 h and 0.4 nmol/kg per 24 h, respectively (18). Attempts to quantify M1dG indicated that it is present at much lower concentrations in human urine, raising the possibility that it is metabolized before excretion (17).
In the present study, we report that M1dG is rapidly oxidized after i.v. administration to rats. The sole product was 6-oxo-M1dG; no evidence for multiple oxidations was observed nor was there any evidence for the production of glucuronide conjugates. However, we cannot definitively rule out the possibility of other metabolites or pathways of excretion (e.g., bile). The structure of 6-oxo-M1dG was elucidated by MS and NMR spectroscopy (proton and carbon) and confirmed by independent chemical synthesis. Oxidation of M1dG to 6-oxo-M1dG was catalyzed by cytosolic preparations of both rat and human liver, indicating that this is a metabolic pathway common to both species. Preliminary characterization suggests that xanthine oxidase and aldehyde oxidase are responsible for oxidation of M1dG in cytosolic preparations. There is no evidence for oxidation of M1dG by cytochromes P450 in liver microsomal preparations.
The extent of metabolism could not be rigorously determined, but it is estimated that ≈20–30% of the exogenously administered M1dG was converted to the metabolite, 6-oxo-M1dG. The incomplete conversion of M1dG to 6-oxo-M1dG in vivo implies that oxidative metabolism is not the sole cause of the low levels of M1dG in human urine. However, such a conclusion may be premature, because the levels of M1dG administered in the present study are likely to be higher than the steady-state levels released from DNA after repair. Thus, the percentage conversion of M1dG to 6-oxo-M1dG may be greater under physiological conditions than the percentage conversion observed in the present experiments. One must also consider the possibility that other unknown factors besides oxidative metabolism (e.g., recycling of M1dG or alternate pathways of DNA repair) are responsible for the low endogenous levels of M1dG in urine.
Prior studies have demonstrated that alkylated, polycyclic hydrocarbon, and aflatoxin adducts are stable in vivo, whereas the chemotherapeutic agent O6-benzylguanine is oxidized (21, 26–28). The site of oxidation on O6-benzylguanine is the 8 position of the imidazole ring, which is different from the site of oxidation on M1dG. The pyrimido ring of M1dG has been previously demonstrated to be highly reactive to nucleophiles and hydride-reducing agents, so the present observations indicate it is also subject to oxidation (29–31). It will be interesting to elucidate the mechanism of enzyme-catalyzed oxidation.
Our findings raise the possibility that other DNA adducts from endogenous sources are oxidized or otherwise metabolized after repair-dependent removal from the genome or from mitochondrial DNA. 8-Oxo-dG appears to be stable, and recent reports have demonstrated the presence of another endogenous adduct, ethenodeoxyadenosine, and its nucleobase in urine (32). However, a growing number of endogenous adducts have been formed in in vitro experiments that contain an exocyclic ring that blocks the Watson–Crick base-pairing region (33–36). It will be important to determine the metabolic fate of these lesions as part of any attempt to develop convenient biomarkers suitable for clinical or population-based studies.
Materials and Methods
Materials.
All chemicals were obtained from commercial sources and used as received. Solvents were of HPLC grade purity or higher. M1dG was synthesized as described (37). Human liver cytosol preparations were purchased from BD Biosciences (Woburn, MA). Rat liver cytosol preparations were prepared by established methods (38). HPLC separations were performed on a Waters 2695 autosampler and binary pump with a Waters 2487 dual-wavelength UV detector. LC–tandem MS spectra were obtained on a Finnigan TSQ 7000 instrument (Finnigan-MAT, San Jose, CA).
M1dG Treatment of Rats.
Animal protocols were performed under approval of Vanderbilt University and in accordance with the Institutional Animal Care and Use Committee policies. Male Sprague–Dawley rats (225–250 g) unaltered or cannulated in the femoral and jugular veins were obtained from Charles River Laboratories and housed in shoebox cages. Animals were transferred to metabolism cages before dosing and allowed to feed ad libitum throughout the experiment. The dosing solution was prepared in sterile saline and administered in the jugular vein of cannulated rats at 2 mg/kg in ≈0.5 ml of total volume. The dose was delivered over 45 sec and the cannula flushed with 0.4 ml of sterile heparinized saline. A portion of whole blood (0.5 ml) was removed at intervals (0.17, 0.33, 0.5, 1, 2, 4, 6, and 24 h) after the dose and placed on ice. To maintain constant circulatory volume, 0.5 ml of heparinized saline was injected after blood draws. Plasma was separated by centrifugation and removed. Urine was collected over intervals (predose, 0–4, 4–6, 6–16, and 16–24 h). A standard curve was prepared by spiking known concentrations of M1dG into whole blood obtained from unaltered male Sprague–Dawley rats and processed as above. All samples were stored at −80°C until sample workup.
Sample Workup and Analysis.
A sample of urine (0.4 ml) was extracted by adding 0.8 ml of ethanol followed by 0.8 ml of chloroform. After vigorous mixing, the phases were separated by centrifugation. The organic layer was removed, and the remaining aqueous layer was extracted with an additional 0.8 ml of chloroform. The organic layers were pooled, dried under nitrogen, and reconstituted in potassium phosphate (0.2 M, pH 7.4). Plasma (0.15 ml) was diluted to 0.25 ml with 0.2 M potassium phosphate and processed as above. Samples (10 μl) were loaded onto a Phenomenex Luna C18 (2) column (2.0 × 250 mm, 5 μm) (Torrance, CA) equilibrated with 90% solvent A (0.5% formic acid in H2O) and 10% solvent B (0.5% formic acid in MeOH) at a flow rate of 0.3 ml/min. The solvent was programmed as follows: a linear gradient from the starting solvent to 20% B in 10 min, holding at 20% B for 10 min, increasing to 80% B in 0.1 min, holding for 5 min, decreasing to 10% B in 0.1 min, and reequilibrating at initial conditions for 5 min. Eluting compounds were detected by UV absorbance at 254 nm or by LC/MS. Positive ion electrospray ionization was used with the following parameters: spray voltage = 4.5 kV, capillary temperature = 200°C, sheath gas = 60 psi, collision-induced dissociation pressure = 2.3 mTorr (nitrogen gas; 1 torr = 133 Pa), and 15 eV collision energy. Samples were analyzed by selected reaction monitoring, which followed the neutral loss of deoxyribose from M1dG (m/z = 304.3 → 188.3). The method was adapted to scan for the presence of an additional oxygen atom in the pyrimidopurinone ring by scanning eluting peaks for the transition m/z 320.3 → 204.3).
Liver Cytosol Incubations.
All sample preparation was performed at 4°C. The final incubation conditions for the kinetic determinations contained 5 mg/ml rat liver cytosol, varied concentrations of M1dG (20, 40, 50, 60, 80, 100, 120, 200, 400, or 800 μM), and 0.4% DMSO in 0.2 M potassium phosphate, pH 7.4. The final incubation conditions for the inhibition studies were performed with 5 mg/ml rat liver cytosol or human liver cytosol/370 μM M1dG/160 μM inhibitor (allopurinol or menadione)/0.4% DMSO in 0.2 M potassium phosphate, pH 7.4. The inhibitors were diluted in DMSO. Reagents were equilibrated to 37°C for 5 min and initiated by the addition of substrate. Reactions were terminated after 60 min by adding two volumes of ice-cold ethanol, then extracted twice with two volumes of chloroform. The extracts were evaporated under nitrogen; reconstituted in 0.2 M potassium phosphate, pH 7.4; and analyzed by HPLC as described above. Samples from the kinetic determinations were analyzed for M1dG content by comparison to a standard curve prepared by spiking known concentrations of M1dG into 5 mg/ml rat liver cytosol solutions followed immediately by termination, extraction, and analysis. All incubations and standards were performed in triplicate.
Biochemical Synthesis of M1dG Metabolite.
Rat liver cytosol (20 ml of a solution of 20 mg of protein/ml) was incubated with 10 mg of M1dG and allowed to react to completion. The reaction was monitored by HPLC (conditions described above) and terminated by the addition of one volume of acetonitrile to precipitate the protein. The resulting mixture was centrifuged, and the supernatant was lyophilized overnight. The residue was reconstituted in water and applied to a preconditioned C18 solid phase extraction column (Waters Oasis HLB), which was washed twice with water and eluted with methanol. The purified sample was evaporated to dryness and analyzed by NMR. 1H-NMR (300 MHz, D2O): δ 8.71 (d, 1H J = 8 Hz, H8), 8.13 (s, 1H, H2), 6.4–6.3 (m, 2H, H7 and H1′), 4.61 (m, 1H, H3′), 4.05 (m, 1H, H4′), 3.73 (m, 2H, H5′, H5″), 2.85–2.51 (m, 2H, H2′, H2″). 13C-NMR (500.13 MHz, D2O): δ 84.3 (C1′), 109.5 (C7), 116.6 (C10a), 135.4 (C8), 140.1 (C2), 149.8 (C6), 150.4 (C3a), 154.5 (C10), and 168.8 (C5a).
Chemical Synthesis of 3-(2-Deoxy-β-d-erythropentofuranosyl)-pyrimido[1,2-f]purine-6,10(3H,5H)-dione (6-Oxo-M1dG).
Ethyl 2-amino-9-(2-deoxy-β-d-erythropentofuranosyl)-6,9-dihydro-6-oxo-1H-purine-1-acrylate.
2′-Deoxyguanosine hydrate was dried in an Abderhalden apparatus overnight at 78°C under vacuum. A mixture of anhydrous 2′-deoxyguanosine [134 mg (0.5 mmol)/K2CO3 (104 mg, 0.75 mmol)/ethyl cis-3-bromoacrylate (135 mg, 0.75 mmol)] in anhydrous dimethylformamide (10 ml) was added to a flame-dried round-bottom flask and stirred overnight at 64°C. HPLC analysis of the reaction mixture showed that nearly all of the deoxyguanosine had been consumed. The mixture was cooled to room temperature, filtered, and the filtrate concentrated under high vacuum. In general, the crude product was used in the next step without further purification. A portion of the product was purified by C18 reversed-phase HPLC for characterization. 1H NMR (CD3OD): d 8.00 (s, 1H), 7.56 (d, J = 14.4 Hz, 1H), 6.61 (d, J = 14.4 Hz, 1H), 6.27 (t, J = 6.9 Hz, 1H), 4.52 (m, 1H), 4.19 (q, J = 7.2 Hz, 2H), 4.00 (m, 1H), 3.75 (m, 2H), 2.68 (m, 1H), 2.35 (m, 1H), 1.27 (t, J = 7.2 Hz, 3H).
3-(2-Deoxy-β-d-erythropentofuranosyl)-pyrimido[1,2-f]purine-6,10(3H,5H)-dione (6-Oxo-M1dG).
The crude acrylate was suspended in anhydrous methanol (4 ml). Sodium methoxide (0.5 mmol, 1 ml of a 0.5 M solution in methanol) was added dropwise to the stirred suspension, resulting in a clear solution. HPLC analysis showed the completed conversion of the starting material after stirring at room temperature for 1 h. The reaction mixture was neutralized by the addition of acetic acid (30 ml, 0.5 mmol) and evaporated under reduced pressure. The residue was dissolved in a 1:1 mixture of methanol and water (0.5–1 ml) and purified on a Biotage (Uppsala, Sweden) system using a C18 reversed-phase column (C18HS 12+M) with a linear gradient from 0% to 20% acetonitrile in water to give the desired product (71 mg, 44% yield from 2′-deoxyguanosine). The proton NMR spectrum was identical to that of the biosynthesized material described above.
Supplementary Material
Acknowledgments
We thank the Mouse Metabolic Phenotyping Center for providing the metabolic cages used for these studies. This work was supported by a research grant from the National Institutes of Health (CA87819). C.G.K. was supported by U. S. Public Health Services Grant T32 ES007028.
Abbreviations
- M1dG
3-(2-Deoxy-β-d-erythro-pentofuranosyl)pyrimido[1,2-α]purin-10(3H)-one
- LC
liquid chromatography.
References
- 1.Marnett L. J., Riggins J. N., West J. D. J. Clin. Invest. 2003;111:583–593. doi: 10.1172/JCI18022. [DOI] [PMC free article] [PubMed] [Google Scholar]
- 2.Klaunig J. E., Kamendulis L. M. Annu. Rev. Pharmacol. Toxicol. 2004;44:239–267. doi: 10.1146/annurev.pharmtox.44.101802.121851. [DOI] [PubMed] [Google Scholar]
- 3.Marnett L. J. Carcinogenesis. 2000;21:361–370. doi: 10.1093/carcin/21.3.361. [DOI] [PubMed] [Google Scholar]
- 4.Beckman K. B., Ames B. N. J. Biol. Chem. 1997;272:19633–19636. doi: 10.1074/jbc.272.32.19633. [DOI] [PubMed] [Google Scholar]
- 5.Dedon P. C., Tannenbaum S. R. Arch. Biochem. Biophys. 2004;423:12–22. doi: 10.1016/j.abb.2003.12.017. [DOI] [PubMed] [Google Scholar]
- 6.Rouzer C. A., Chaudhary A. K., Nokubo M., Ferguson D. M., Reddy G. R., Blair I. A., Marnett L. J. Chem. Res. Toxicol. 1997;10:181–188. doi: 10.1021/tx9601216. [DOI] [PubMed] [Google Scholar]
- 7.Churchwell M. I., Beland F. A., Doerge D. R. Chem. Res. Toxicol. 2002;15:1295–1301. doi: 10.1021/tx0101595. [DOI] [PubMed] [Google Scholar]
- 8.Jeong Y. C., Nakamura J., Upton P. B., Swenberg J. A. Nucleic Acids Res. 2005;33:6426–6434. doi: 10.1093/nar/gki944. [DOI] [PMC free article] [PubMed] [Google Scholar]
- 9.Seto H., Okuda T., Takesue T., Ikemura T. Bull. Chem. Soc. Jpn. 1983;56:1799–1802. [Google Scholar]
- 10.Dedon P. C., Plastaras J. P., Rouzer C. A., Marnett L. J. Proc. Natl. Acad. Sci. USA. 1998;95:11113–11116. doi: 10.1073/pnas.95.19.11113. [DOI] [PMC free article] [PubMed] [Google Scholar]
- 11.Zhou X., Taghizadeh K., Dedon P. C. J. Biol. Chem. 2005;280:25377–25382. doi: 10.1074/jbc.M503079200. [DOI] [PubMed] [Google Scholar]
- 12.Hashim M. F., Riggins J. N., Schnetz-Boutaud N., Voehler M., Stone M. P., Marnett L. J. Biochemistry. 2004;43:11828–11835. doi: 10.1021/bi049360f. [DOI] [PubMed] [Google Scholar]
- 13.Fink S. P., Reddy G. R., Marnett L. J. Proc. Natl. Acad. Sci. USA. 1997;94:8652–8657. doi: 10.1073/pnas.94.16.8652. [DOI] [PMC free article] [PubMed] [Google Scholar]
- 14.VanderVeen L. A., Hashim M. F., Shyr Y., Marnett L. J. Proc. Natl. Acad. Sci. USA. 2003;100:14247–14252. doi: 10.1073/pnas.2332176100. [DOI] [PMC free article] [PubMed] [Google Scholar]
- 15.Johnson K. A., Fink S. P., Marnett L. J. J. Biol. Chem. 1997;272:11434–11438. doi: 10.1074/jbc.272.17.11434. [DOI] [PubMed] [Google Scholar]
- 16.Otteneder M., Scott Daniels J., Voehler M., Marnett L. J. Anal. Biochem. 2003;315:147–151. doi: 10.1016/s0003-2697(02)00697-8. [DOI] [PubMed] [Google Scholar]
- 17.Hoberg A. M., Otteneder M., Marnett L. J., Poulsen H. E. J. Mass Spectrom. 2004;39:38–42. doi: 10.1002/jms.547. [DOI] [PubMed] [Google Scholar]
- 18.Weimann A., Belling D., Poulsen H. E. Nucleic Acids Res. 2002;30:E71–E78. doi: 10.1093/nar/30.2.e7. [DOI] [PMC free article] [PubMed] [Google Scholar]
- 19.Kim D. H., Guengerich F. P. Cancer Res. 1989;49:5843–5847. [PubMed] [Google Scholar]
- 20.Elion G. B., Kovensky A., Hitchings G. H. Biochem. Pharmacol. 1966;15:863–880. doi: 10.1016/0006-2952(66)90163-8. [DOI] [PubMed] [Google Scholar]
- 21.Roy S. K., Korzekwa K. R., Gonzalez F. J., Moschel R. C., Dolan M. E. Biochem. Pharmacol. 1995;50:1385–1389. doi: 10.1016/0006-2952(95)02019-5. [DOI] [PubMed] [Google Scholar]
- 22.Mahler H. R., Fairhurst A. S., Mackler B. J. Am. Chem. Soc. 1955;77:1514–1521. [Google Scholar]
- 23.Osada Y., Tsuchimoto M., Fukushima H., Takahashi K., Kondo S., Hasegawa M., Komoriya K. Eur. J. Pharmacol. 1993;241:183–188. doi: 10.1016/0014-2999(93)90201-r. [DOI] [PubMed] [Google Scholar]
- 24.Obach R. S. Drug Metab. Dispos. 2004;32:89–97. doi: 10.1124/dmd.32.1.89. [DOI] [PubMed] [Google Scholar]
- 25.Shuker D. E. G., Farmer P. B. Chem. Res. Toxicol. 1992;5:450–460. doi: 10.1021/tx00028a001. [DOI] [PubMed] [Google Scholar]
- 26.Friesen M. D., Garren L., Prevost V., Shuker D. E. Chem. Res. Toxicol. 1991;4:102–106. doi: 10.1021/tx00019a014. [DOI] [PubMed] [Google Scholar]
- 27.Autrup H., Seremet T. Chem. Biol. Interact. 1986;60:217–226. doi: 10.1016/0009-2797(86)90030-x. [DOI] [PubMed] [Google Scholar]
- 28.Bennett R. A., Essigmann J. M., Wogan G. N. Cancer Res. 1981;41:650–654. [PubMed] [Google Scholar]
- 29.Schnetz-Boutaud N., Daniels J. S., Hashim M. F., Scholl P., Burrus T., Marnett L. J. Chem. Res. Toxicol. 2000;13:967–970. doi: 10.1021/tx000135i. [DOI] [PubMed] [Google Scholar]
- 30.Otteneder M., Plastaras J. P., Marnett L. J. Chem. Res. Toxicol. 2002;15:312–318. doi: 10.1021/tx010105v. [DOI] [PubMed] [Google Scholar]
- 31.Riggins J. N., Daniels J. S., Rouzer C. A., Marnett L. J. J. Am. Chem. Soc. 2004;126:8237–8243. doi: 10.1021/ja040009r. [DOI] [PubMed] [Google Scholar]
- 32.Bartsch H., Nair J. Cancer Detect. Prev. 2004;28:385–391. doi: 10.1016/j.cdp.2004.07.004. [DOI] [PubMed] [Google Scholar]
- 33.Pollack M., Oe T., Lee S. H., Silva Elipe M. V., Arison B. H., Blair I. A. Chem. Res. Toxicol. 2003;16:893–900. doi: 10.1021/tx030009p. [DOI] [PubMed] [Google Scholar]
- 34.Lee S. H., Oe T., Blair I. A. Chem. Res. Toxicol. 2002;15:300–304. doi: 10.1021/tx010147j. [DOI] [PubMed] [Google Scholar]
- 35.Chung F.-L., Hecht S. S. Cancer Res. 1983;43:1230–1235. [PubMed] [Google Scholar]
- 36.Wang H., Rizzo C. J. Org. Lett. 2001;3:3603–3605. doi: 10.1021/ol016810c. [DOI] [PubMed] [Google Scholar]
- 37.Schnetz-Boutaud N., Mao H., Stone M. P., Marnett L. J. Chem. Res. Toxicol. 2000;13:90–95. doi: 10.1021/tx990141i. [DOI] [PubMed] [Google Scholar]
- 38.Guengerich F. P. In: Principles and Methods of Toxicology. Hayes A. W., editor. New York: Raven; 1994. pp. 1259–1313. [Google Scholar]
Associated Data
This section collects any data citations, data availability statements, or supplementary materials included in this article.


