

Abstract
Restricion endonuclease Ecl18kI is specific for the sequence /CCNGG and cleaves it before the outer C to generate 5 nt 5′-overhangs. It has been suggested that Ecl18kI is evolutionarily related to NgoMIV, a 6-bp cutter that cleaves the sequence G/CCGGC and leaves 4 nt 5′-overhangs. Here, we report the crystal structure of the Ecl18kI–DNA complex at 1.7 Å resolution and compare it with the known structure of the NgoMIV–DNA complex. We find that Ecl18kI flips both central nucleotides within the CCNGG sequence and buries the extruded bases in pockets within the protein. Nucleotide flipping disrupts Watson–Crick base pairing, induces a kink in the DNA and shifts the DNA register by 1 bp, making the distances between scissile phosphates in the Ecl18kI and NgoMIV cocrystal structures nearly identical. Therefore, the two enzymes can use a conserved DNA recognition module, yet recognize different sequences, and form superimposable dimers, yet generate different cleavage patterns. Hence, Ecl18kI is the first example of a restriction endonuclease that flips nucleotides to achieve specificity for its recognition site.
Keywords: crystal structure, nucleotide flipping, protein–DNA interactions, restriction endonuclease
Introduction
Type II restriction endonucleases recognize short nucleotide sequences usually 4–8 bp in length and cleave DNA leaving blunt ends or 5′- or 3′-overhangs. Most Type IIP enzymes are active as dimers and many recognize target sequences in DNA that match the two-fold symmetry of the enzymes (Pingoud et al, 2005a). Strict matches require palindromic DNA sequences with an even number of base pairs, which are cleaved to generate either blunt ends or overhangs with an even number of nucleotides. Target sequences with an odd number of base pairs in the recognition sequence are necessarily pseudopalindromic, break the two-fold symmetry at the central base pair, and yield overhangs with an odd number of nucleotides upon cleavage (Figure 1).
Figure 1.
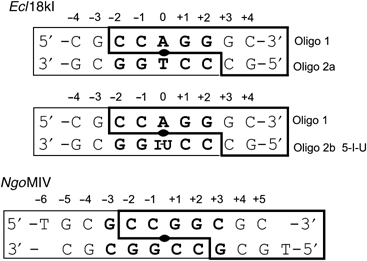
Oligonucleotides used for cocrystallization of Ecl18kI (this work) and NgoMIV (Deibert et al, 2000). The recognition sequence is shown in bold letters, boxes indicate the cleavage patterns with 5 nt and 4 nt 5′ overhangs, respectively.
Most Type IIP enzymes cut within the boundaries of the recognition sequence. Among those, palindrome cutters predominate over pseudopalindrome cutters, and 4 nt 5′-overhangs or blunt ends are the most common cleavage products (Roberts et al, 2005). Not surprisingly, a vast majority of mechanistic and structural studies of restriction endonucleases have focused on such enzymes (Pingoud et al, 2005a). Comparative structural analysis reveals that Type IIP restriction enzymes share a conserved core that harbors active site residues (Venclovas et al, 1994; Aggarwal, 1995; Kovall and Matthews, 1998). Different DNA cleavage patterns result from changes in the dimerization mode that alter the distance between active sites and hence the number of base pairs interspaced between scissile phosphates, as shown by a comparison of the EcoRI (G/AATTC) and EcoRV (GAT/ATC) crystal structures (Venclovas et al, 1994). Much less is known about pseudopalindrome sequence cutters, in part because very few enzymes in this group have been structurally characterized. Structures are available for apo-EcoRII(/CCWGG, W=A or T) (Zhou et al, 2004) and for EcoO109I (RG/GNCCY, R=A or G; Y=T or C) (Hashimoto et al, 2005), BglI (GCCNNNN/NGGC) and SfiI (GGCCNNNN/NGGCC) complexes with DNA (Newman et al, 1998; Vanamee et al, 2005). BglI and SfiI are very similar to the blunt end-cutter EcoRV in terms of monomer structure, but generate 3 nt 3′-overhangs rather than blunt ends, because the enzymes dimerize in very different ways (Newman et al, 1998; Vanamee et al, 2005). In contrast, EcoO109I (RG/GNCCY) and BsoBI (C/YCGRG) (van der Woerd et al, 2001) generate different cleavage patterns despite strikingly similar dimerization modes. In fact, EcoO109I partially unstacks the DNA within its recognition sequence due to the interaction between an indole ring of a tryptophan residue and cytosine, resulting in DNA stretching and a register shift in the cleavage pattern with respect to BsoBI (Hashimoto et al, 2005). Thus, local changes of DNA structure and not alterations of the dimerization mode explain the different cleavage patterns of EcoO109I and BsoBI.
It is unlikely that the DNA ‘stretching mechanism' employed by EcoO109I can account for the cleavage patterns of Ecl18kI (/CCNGG) (Den'mukhametov et al, 1997), EcoRII(/CCWGG) (Bigger et al, 1973; Boyer et al, 1973) and PspGI (/CCWGG) (Morgan et al, 1998), because it would require 6 nt 5′-overhang cutters as ‘precursors', which are currently unknown. Instead, amino-acid sequence similarities and extensive mutagenesis data (Pingoud et al, 2002, 2005b; Tamulaitis et al, 2002) argue for a close evolutionary link between Ecl18kI (/CCNGG) and the crystallographically characterized palindrome cutters NgoMIV (G/CCGGC) (Deibert et al, 2000), Cfr10I (R/CCGGY) (Bozic et al, 1996) and Bse634I (R/CCGGY) (Grazulis et al, 2002), which all generate 4 nt 5′-overhangs. How Ecl18kI, EcoRII and PspGI accommodate the extra base pair within their recognition sites and generate 5 nt overhangs is unclear.
To address these questions, we have determined the crystal structure of Ecl18kI restriction endonuclease from Enterobacter cloaceae in complex with a 9 bp oligonucleotide duplex containing the recognition site. The amino-acid sequence of Ecl18kI is over 99% identical to the isoschizomeric restriction endonucleases SsoII (Karyagina et al, 1993), SenPI (Ibanez et al, 1997) and StyD4I (Miyahara et al, 1997).
Results
Ecl18kI crystals
Ecl18kI was crystallized in complex with two different 9-mer oligodeoxynucleotide duplexes (Figure 1, oligos 1/2a and oligos 1/2b, respectively) in space group P212121. The best crystal was grown in a drop with Ecl18kI and the 5-iodo-deoxyuridine containing oligonucleotide duplex 1/2b more than a year prior to data collection and diffracted to 1.7 Å resolution. Surprisingly, we did not find a strong electron density peak for the iodine atom, and also no significant anomalous peak for iodine, although anomalous signal equivalent to about three electrons should have been present at the data collection wavelength 1.05 Å (see Materials and methods). Owing to this uncertainty, we crystallized Ecl18kI with the unmodified oligonucleotide duplex 1/2a, but the best diffraction data extended only to 2.0 Å resolution and suffered from high mosaicity and weak ice rings. The structure was solved by the multiple anomalous diffraction (MAD) technique using the selenomethionine variant of the protein and a potassium bromide soak (Supplementary Table SI). The refined structures of the Ecl18kI–DNA complexes with modified and unmodified DNA duplexes were almost identical.
Protomer structure
The Ecl18kI protomer is built around the typical folding motif of Type II restriction endonucleases, which consists of a mixed β-sheet and connecting helices (Venclovas et al, 1994; Aggarwal, 1995; Kovall and Matthews, 1998). In Ecl18kI, the core motif comprises residues 140–247, if region boundaries are chosen to coincide with the ends of secondary structure elements, and includes strands β1–β6, and the connecting helices (Figure 2A and B; Supplementary Figure S1). As expected, the core motif anchors almost all residues that were previously implicated either in catalysis or in sequence recognition (Tamulaitis et al, 2002) (Figure 2B and Supplementary Figure S2). On the N-terminal side, the core region is flanked by an almost entirely helical region (residues 1–139). On the C-terminal side, the nuclease core is followed by three extra helices.
Figure 2.
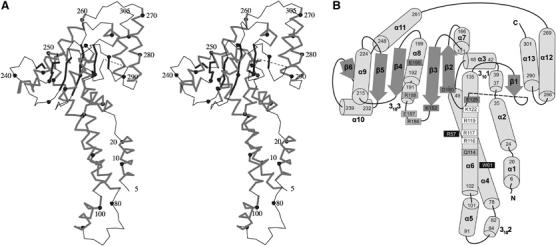
Ecl18kI protomer structure. (A) Stereoview of a Cα-trace of an Ecl18kI protomer. Every 10th residue is marked with a closed circle and labeled where possible to avoid undue crowding. β-Strands are shown as black thick lines, α-helices as gray lines. The dashed line represents the regions (residues 145–155) in the crystal structure that are poorly ordered in all four protomers in the asymmetric unit. (B) Schematic diagram of the protomer fold, shown in the same orientation as in (A). Secondary structure elements are numbered. Residues that are involved in DNA-backbone contacts are shown in white boxes, residues that form hydrogen bonds with the bases of the recognition sequence are shown in light gray boxes, residues that are involved in catalysis are in dark gray boxes, and residues that sandwich the flipped bases are shown on black background.
The core region of Ecl18kI (Figure 3A) is structurally similar to the equivalent regions of EcoRII (Figure 3B) and NgoMIV (Figure 3C); however, the so-called dimerization and tetramerization loops of NgoMIV have no equivalents in Ecl18kI. On the other hand, NgoMIV lacks most of the N-terminal α-helical region of Ecl18kI (Figure 3A and C). Interestingly, a structurally similar region is present in the EcoRII restriction endonuclease between the effector and core domains (Figure 3A and B).
Figure 3.
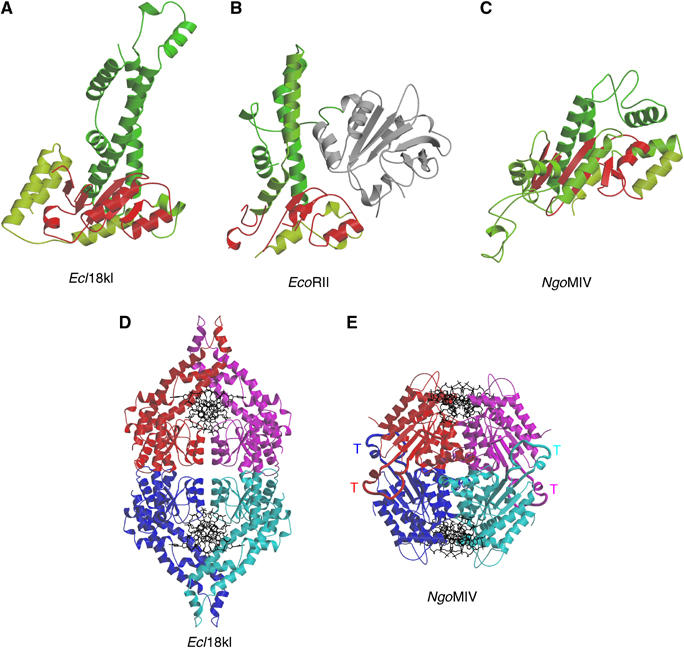
Structural comparisons of Ecl18kI. (A–C) Comparison of the protomer folds of Ecl18kI (A), EcoRII (B) and NgoMIV (C). The polypeptide chains have been colour-ramped from dark to light green from the N- to the C-terminus, except for the catalytic cores in red and the effector domain of EcoRII in grey (A). The equivalent regions in EcoRII and NgoMIV are colored analogously. In (B), the effector domain, which is unique to EcoRII (Zhou et al, 2004), is shown in gray. (D, E) Overall view of the Ecl18kI–DNA and NgoMIV–DNA (Deibert et al, 2000) complexes in the asymmetric units of the crystals. The protein is shown in ribbon- and DNA in wireframe-representation. Protein chains A, B, C, D of Ecl18kI are shown in red, magenta, blue and cyan, respectively. In the structure shown in (D), the DNA chains E and F are at the top and chains G and H are at the bottom. In NgoMIV (E), the so-called tetramerization loops are shown by bold lines and are labeled by the letter ‘T'.
Oligomer structure
The asymmetric unit of the Ecl18kI crystals contains four protein monomers and two DNA duplexes. Protein subunits AB and CD (Figure 3D) form primary dimers, which completely encircle double-stranded DNA molecules. Using the program SURFACE (Collaborative Computational Project Number 4 (CCP4), 1994), we calculated that the formation of the dimer buries ∼3400 Å2 of solvent accessible surface. The interface is bipartite with contributions from the N-terminal region and from the nuclease core. The latter contacts are mediated by helices and are similar to the contacts in NgoMIV and in many EcoRI-like orthodox restriction enzymes (Pingoud and Jeltsch, 2001). Therefore, the primary dimers AB and CD are likely to represent the minimal functional units of Ecl18kI.
In the asymmetric unit of the Ecl18kI crystals, two Ecl18kI dimers (subunits AB and CD) associate to form tetramers of 222 point symmetry, which differ significantly from the tetramers of the NgoMIV restriction enzyme (Figure 3E). First, the angle between the long axes of two bound DNA molecules is only ∼30° in the Ecl18kI–DNA complex, but ∼60° in the NgoMIV–DNA complex. Second, the dimer–dimer interface of Ecl18kI in the crystals is far less extensive than the equivalent dimer–dimer interface of NgoMIV (buried surface area 3400 Å2 in Ecl18kI versus 12 800 Å2 in NgoMIV). Moreover, the tetramerization loops of NgoMIV (Figure 3E) are missing in Ecl18kI. It remains to be determined if Ecl18kI tetramers are functionally relevant or a crystal packing artifact.
DNA binding and sequence recognition
As anticipated, the pseudo-two-fold axis of the DNA coincides with the two-fold axis of Ecl18kI. Therefore, there are two ways for the DNA duplex to bind to the enzyme, which are equivalent in solution, but not in the crystal. Crystallographic quality parameters indicate that both binding modes are possible, and therefore both DNA duplexes were modeled in two conformations. The electron density for the sugar-phosphate backbone and for the specifically recognized G:C bases, which obey the two-fold symmetry, is unaffected by this ambiguity, but the electron density for the bases of the central nucleotides and the flanking sequences is an average and therefore more difficult to interpret.
The specifically bound DNA is almost entirely wrapped by Ecl18kI. Positively charged residues cluster around the DNA backbone (Supplementary Figure S2). The crystallographic results are in excellent agreement with prior biochemical data, which have implicated R-box arginines Arg116, Arg117 and Arg119 in DNA backbone contacts (Pingoud et al, 2002). Due to the symmetry of the Ecl18kI dimer, all specific protein–DNA contacts occur in duplicate, and therefore only one half-site of Ecl18kI needs to be described.
Ecl18kI contacts the bases of the recognition sequence primarily from the major groove side (Figure 4A). Major groove contacts are exclusively mediated by Arg186, Glu187 and Arg188. The three consecutive residues are localized at the N-terminal end of the 3/10 helix-3, which is known as the ‘recognition helix' in related Type II enzymes (Figure 2B). Arginines 186 and 188 donate bidentate hydrogen bonds to the outer (±2 according to Figure 1) and inner (±1 according to Figure 1) guanines, respectively. The side chain oxygen atoms of Glu187 accept one hydrogen bond each from the two neighboring cytosines of the recognition sequence. Sequence-specific minor groove contacts are mediated exclusively by glutamine 114. The main chain oxygen atom of this residue accepts a hydrogen bond from the outer guanine (±2), and the side chain forms two hydrogen bonds with the inner guanine (±1). There are no direct specific contacts between the protein and the cytosines in the minor groove, but the guanidino groups of Arg117 form water-mediated hydrogen bonds with the O2 atoms of the inner cytosines. The recognition pattern of the CC:GG nucleotides in Ecl18kI is strikingly similar to that of NgoMIV (Figure 4B), confirming an earlier prediction that was based on a mutational and biochemical analysis (Tamulaitis et al, 2002).
Figure 4.
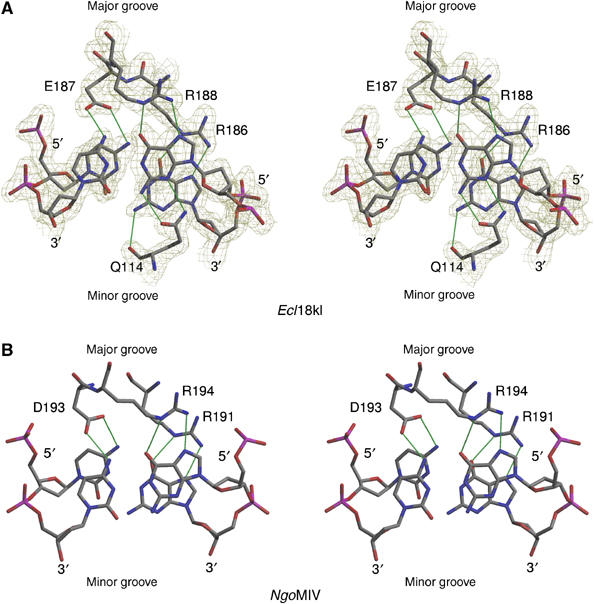
Sequence recognition by Ecl18kI and NgoMIV (Deibert et al, 2000). (A) Stereoview of Ecl18kI interactions with one half-site of the CCNGG sequence. Only direct interactions with base pairs +1 and +2 according to Figure 1 are shown. The electron density in (A) was calculated from the MAD phases after solvent-flattening and four-fold averaging and contoured at 1.3σ. Except for the model-dependent averaging masks, no information from the final model was used. (B) Stereoview of NgoMIV interactions with one half-site of GCCGGC sequence. Only interactions with the central base pairs (+1, +2 according to Figure 1) are shown.
Active site
Based on very weak sequence similarity between Ecl18kI and NgoMIV and mutational studies, Tamulaitis et al (2002) suggested that the sequence motif 159-VDX21KX12E represents an active site of Ecl18kI. Structural comparison between Ecl18kI and NgoMIV reveals that the predicted residues indeed correspond to the active site residues of NgoMIV (Figure 5A). In NgoMIV, Asp140 bridges two Mg2+ ions in the active site, and we presume that Asp160 in the Ecl18kI has the same role. However, Mg2+ ions are absent from the Ecl18kI crystals, which could only be grown in the presence of the metal-chelator ethylenediaminetetraacetic acid (EDTA). Attempts to diffuse divalent metal ions into the crystals resulted in a loss of crystal diffraction. Other catalytic/metal chelating residues of NgoMIV are also conserved in Ecl18kI (Figure 5A). The Cα atom of Glu201 in NgoMIV coincides with the Cα atom of Glu195 in Ecl18kI, but the side chain is in a different rotamer conformation. It is possible that the conformation of Glu195 may change in the presence of metal ions. Mutational data of Ecl18kI residues Glu125, Asp160, Lys182 and Glu195 are consistent with their active site function (Tamulaitis et al, 2002). Hence, Ecl18kI possesses an NgoMIV-like active site as predicted.
Figure 5.
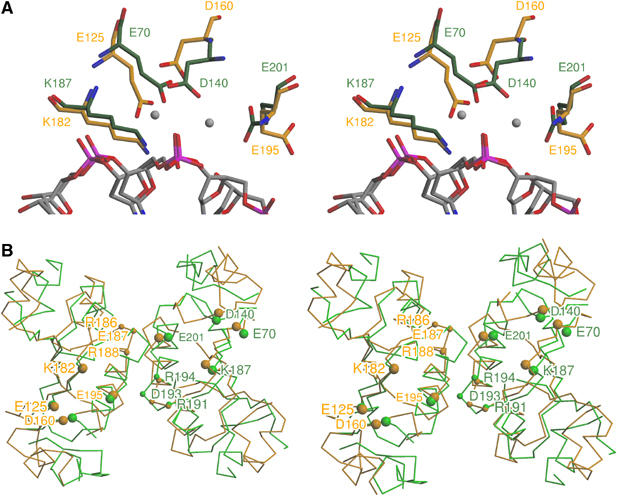
Comparison between Ecl18kI and NgoMIV. (A) Stereoview of the superimposed active sites of Ecl18kI and NgoMIV (shown in orange and green colors, respectively). Active site residues of NgoMIV Glu70, Asp140, Lys187 and Glu201 superimpose with Ecl18kI residues Glu125, Asp160, Lys182 and Glu195 demonstrated to be important in catalysis (Tamulaitis et al, 2002). Two Mg2+-ions present in NgoMIV–DNA complex are shown as gray spheres, water molecules are not shown. (B) Stereoview of the conserved dimer interface between Ecl18kI and NgoMIV. The Ecl18kI dimer (orange) was superimposed with an equivalent pair of NgoMIV protomers (green). Large spheres indicate Cα-atoms of residues implicated in catalysis. Small spheres indicate Cα-atoms of residues that form hydrogen bonds with bases of the target sequence. The yellow labels on the left side indicate residues in Ecl18kI, the green labels on the right side mark the corresponding residues in NgoMIV.
Conserved Ecl18kI dimer arrangement
Ecl18kI and NgoMIV (Tamulaitis et al, 2002) share the fold, catalytic mechanism and recognize common bases in their target sequences similarly, yet have different specificities and generate overhangs of different length, prompting the question how the different cleavage patterns are generated. An obvious possibility could be that protomers in Ecl18kI dimerize in a different way, matching the distance between catalytic sites to the distance between the scissile phosphates. To check this possibility, we superimposed the Ecl18kI dimer with an equivalent pair of NgoMIV protomers. The superposition was based on an identification of structurally equivalent regions with STRUPRO (Kleywegt and Jones, 1998), and a subsequent optimal alignment of these regions with LSQKAB (CCP4, 1994). No special weight was attached to residues that are involved in catalysis or sequence recognition, but after the superposition was calculated, the Cα-atoms of these residues were found to almost coincide (Figure 5B). Therefore, the different cleavage patterns generated by Ecl18kI and NgoMIV are not due to differences of the dimerization modes. Instead, the Ecl18kI structure reveals a novel mechanism that provides an elegant explanation of the different specificities and cleavage patterns of Ecl18kI and NgoMIV.
DNA conformation: the central nucleotides of the CCNGG recognition sequence are flipped out
The DNA-duplex in complex with Ecl18kI is dramatically deformed. The hydrogen bonds of the central base pair are broken, and the nucleotides are flipped out, which places their bases outside the sugar-phosphate backbone (Figure 6A and C). Each extruded base is accommodated into a ‘pocket' of Ecl18kI made by the side chain atoms of Arg57 on one face and the indole ring of Trp61 on the other face (Figure 7A, B and E). Nucleotide flips seen in the crystal structure are in excellent agreement with the photocrosslinking results for SsoII in solution, which indicated that 5-iodo-deoxyuridine in the central position of the recognition sequence forms a covalent bond with Trp61 of the enzyme upon irradiation (Kubareva et al, 2000).
Figure 6.
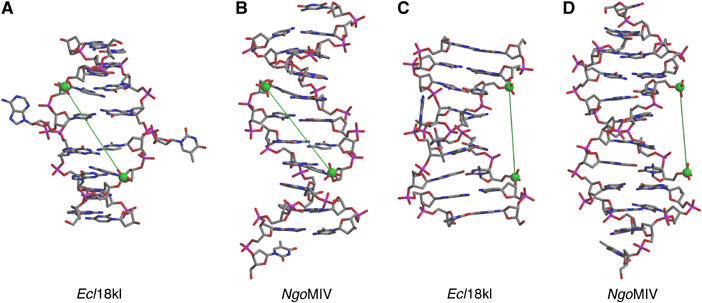
DNA conformation. DNA in complexes with Ecl18kI (A, C) and NgoMIV (B, D) is shown in stick representation. Views in (C) and (D) differ from (A) and (B) by a 90° rotation around the vertical axis. The central nucleotide pair is flipped out of the DNA helix in Ecl18kI–DNA complex (A, C). The electron density for the central bases is averaged due to the two possible binding modes. The flipped out nucleotide is shown in one of the possible conformations, since there is still an uncertainty whether the flipped nucleotides have syn- or anti-conformation. Phosphorous atoms at scissile phosphates are shown as green spheres. The distance between these phosphorous atoms is 17.2 Å in both Ecl18kI–DNA and NgoMIV–DNA complexes.
Figure 7.
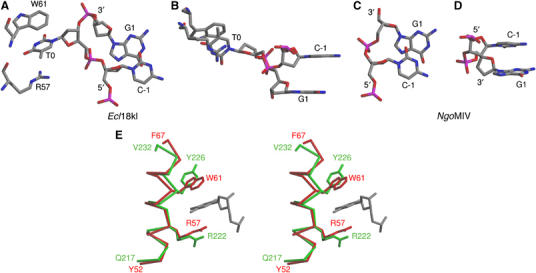
Close-up view of the central nucleotides in the Ecl18kI–DNA and NgoMIV–DNA complexes. (A, B) Three central nucleotides (−1, 0, +1 according to Figure 1) of one strand in the recognition sequence of Ecl18kI are shown in stick representation and CPK colors. Note that there is still uncertainty whether the extruded bases have syn- or anti-conformation. Arg57 and Trp61 residues of Ecl18kI that sandwich the extruded base are shown in stick representation. (C, D) Two central nucleotides (−1, +1 according to Figure 1) in one strand of the NgoMIV recognition sequence are shown in stick representation and CPK colors. (B) and (D) differ from (A) and (C) by 90°-rotations about the horizontal axis. (E) Structural conservation of the binding pocket for the flipped nucleotide in Ecl18kI and EcoRII (shown in red and green colors, respectively). Superposition between the Ecl18kI and EcoRII protomers reveals that Arg57 and Trp61 residues sandwiching the extruded base spatially coincide with Arg222 and Tyr226 of EcoRII. A flipped out base in the Ecl18kI–DNA complex is shown in gray, for one of the two possible binding modes of the DNA.
The nucleotide flips shift the DNA register
Due to the backbone rearrangements that accompany the base extrusions, the values for the rise between the inner G:C base pairs within the recognition site are intermediate between the values characteristic for canonical single and two base pair steps (compare Figure 7B and D). The DNA is strongly kinked at the side of the nucleotide flips (Figure 6C). This deformation opens the minor groove and bends the DNA towards the major groove. Together, the register shift and the kink reduce the distance between scissile DNA phosphates to 17.2 Å, which is within 0.1 Å identical to the distance between scissile phosphates in the complex of NgoMIV with cleaved DNA. Thus, Ecl18kI generates longer overhangs than NgoMIV simply because the enzyme makes the central 5 bp duplex in its recognition sequence mimic a 4 bp duplex (Figure 6).
Discussion
In the crystal structure, there are four Ecl18kI protomers in the asymmetric unit, which form primary dimers AB and CD, respectively, which in turn interact to assemble tetramers (Figure 3D). Analytical ultracentrifugation indicates that Ecl18kI is a dimer in solution in the absence of DNA (Tamulaitis et al, 2002), but Denjmukhametov et al (1998) reported that Ecl18kI migrates as a tetramer in sizing chromatography experiments. The isoschizomeric SsoII enzyme (sharing >99% of identical amino acids with Ecl18kI) is a homodimer in solution both in the absence and presence of DNA, according to the analytical ultracentrifugation and gel filtration experiments (Pingoud et al, 2002), but may bind two copies of its recognition sequence according to electron microscopy, which again suggests the possibility of tetramer formation (Pingoud et al, 2003). At present, one cannot exclude that Ecl18kI exists in solution in the apo-form as a dimer and tetramerizes in the presence of DNA similarly to the restriction enzyme SgrAI (Wood et al, 2005).
Is nucleotide flipping relevant in solution?
The flipped nucleotides are a hallmark of the Ecl18kI–DNA structure. In the case of the Ecl18kI crystals with the modified oligonucleotide duplex (oligo 1/2b), we cannot exclude that the flips could be due to the chemical reactivity of the iodine atom or the minor base-pair mismatch. These explanations for base-flipping, however, can be ruled out, because the crystal structure of Ecl18kI in complex with unmodified DNA shows essentially identical nucleotide flips, albeit at somewhat lower resolution.
The strongest argument for the relevance of the nucleotide flips comes from photocrosslinking studies in solution. Kubareva et al (2000) used a modified oligodeoxynucleotide duplex with 5-iodo-uracil in the central position of the SsoII recognition sequence and identified a specific crosslink between Trp61 and the central modified base, suggesting close proximity between the indole ring of Trp61 and the base. The formation of such a zero-length crosslink product is difficult to explain in the case of regular B-DNA, but it makes perfect sense if nucleotide flipping is occurring in solution because the central bases become extruded and buried in the pockets made by the Trp61 and Arg57 residues (Figure 7A, B and E).
The promiscuity of SsoII with respect to the nucleotide or its analogues in the central position of the target sequence is also consistent with the crystallographic data for Ecl18kI. Experimentally, SsoII was found to accept all four naturally occurring nucleotides and various analogues, including 1,2-dideoxy-D-ribofuranose (an analogue without base), 9-[1′-hydroxy-2′-(hydroxymethyl)eth oxy]methylguanine (an analogue with a substitute for the sugar) and 1,3-propanediol (a simple spacer). In some cases, the incorporation of the nonstandard building blocks led to cleavages at noncanonical sites (Kubareva et al, 1992).
2-Aminopurine (2-AP) is often used as a fluorescence probe to detect base flipping in solution (Holz et al, 1998). Preliminary studies indicate ∼3-fold increase of the 2-AP fluorescence upon Ecl18kI binding to a 25 bp oligonucleotide duplex containing 2-AP at the central position of the Ecl18kI recognition sequence (unpublished data). The observed increase of the 2-AP fluorescence may reflect the extrusion of bases occurring in solution upon Ecl18kI binding, but could also result from base unstacking due to DNA distortion without nucleotide flipping. To unambiguously demonstrate nucleotide flipping in solution, 2-AP fluorescence lifetime experiments should be performed (Neely et al, 2005).
Do other Type II restriction endonucleases flip nucleotides?
Nucleotides are flipped in the Ecl18kI–DNA complex (Figure 7A and B), but not in the NgoMIV–DNA complex (Figure 7C and D). The structure explains the difference. The pocket for the extruded base, which is formed by Arg57 and Trp61, has no counterpart in NgoMIV, where the spatially equivalent region is occluded by Ile21 and Leu22 (data not shown). The evolutionary link between Ecl18kI, PspGI and EcoRII (Pingoud et al, 2002, 2003; Tamulaitis et al, 2002) prompts the question whether nucleotide flipping occurs in PspGI and EcoRII restriction enzymes that recognize CCWGG sequence. The R-box residues of Ecl18kI and SsoII including Arg116, Arg119 and Lys122, which mediate contacts to the DNA backbone, have direct equivalents in PspGI and EcoRII (Pingoud et al, 2003). The RxR motif including Arg186 and Arg188 at the N-terminus of the recognition helix of Ecl18kI is conserved in PspGI, and slightly altered to KxR in EcoRII, and is likely to mediate the base-specific contacts to the major groove in all three enzymes (Pingoud et al, 2003). Gln114, which mediates base-specific contacts in the minor groove in Ecl18kI, is conserved in PspGI, but changed to asparagine in EcoRII (Pingoud et al, 2005b). In summary, the DNA recognition appears to be similar in Ecl18kI, PspGI and EcoRII, which would argue for a conserved nucleotide flipping mechanism. Moreover, Arg57 and Trp61, which sandwich the flipped bases in the Ecl18kI–DNA cocrystal structure, spatially coincide with the Arg222 and Tyr226 of EcoRII (Figure 7E). However, in contrast to Ecl18kI, which shows no specificity for the central base pair, EcoRII and PspGI prefer A:T at the central position of their recognition sequences. Structural comparison between EcoRII and Ecl18kI suggests that a different set of amino-acid residues will be involved in direct contacts with bases if the central A:T pair is flipped out in EcoRII. The importance of these contacts for EcoRII specificity should be tested experimentally.
Nucleotide flipping in other enzyme–DNA complexes
As far as we know, Ecl18kI is the first example of a Type II restriction endonuclease that flips nucleotides and extrudes bases, but nucleotide flipping and base extrusion have been observed before in many other contexts. The DNA-repair endonuclease IV, which has a TIM-barrel fold and is structurally unrelated to Type II restriction enzymes, recognizes apurinic/apyrimidinic sites in DNA and is known to flip the nucleotide of one strand and the deoxyribose of the other strand (Hosfield et al, 1999). In contrast to Ecl18kI and endonuclease IV, which flip the sugars (and attached bases) of both DNA strands, DNA methyltransferases and DNA N-glycosylases extrude a base from one strand, but leave the complementary base in place (Klimasauskas et al, 1994; Slupphaug et al, 1996; Lau et al, 1998).
Base extrusion in one strand has also been observed in the absence of protein in complementary DNA duplexes that contained an inserted, nonmatching base pair in one strand (Joshua-Tor et al, 1992). Very recently, the flipping of both nucleotides at a protein-stabilized B-DNA/Z-DNA junction has been reported (Ha et al, 2005). Together, the findings suggest that nucleotide flipping is sufficiently facile to occur in many contexts, probably also in other restriction endonuclease–DNA complexes.
Nucleotide flipping as a mechanism to adjust cleavage pattern
In most protein DNA–complexes, nucleotide flips and base extrusions occur because enzymes need access to a DNA base to perform chemistry on it. In Ecl18kI, nucleotide flipping plays a very different role: the flip of the central bases reduces the length of a 5 bp stretch to the length of a canonical 4 bp stretch, which accounts for the differences in the cleavage positions of Ecl18kI (5 nt 5′-overhang CCNGG) and NgoMIV (4 nt 5′-overhang CCGG). This is a novel mechanism since similar alterations of the cleavage pattern are usually achieved by the changes of the restriction enzyme dimerization mode (Newman et al, 1998). It will be interesting to see whether other restriction endonucleases flip nucleotides to interact with their target sites.
Materials and methods
Ecl18kI purification
Expression in Escherichia coli and purification of wild-type Ecl18kI have been described previously (Tamulaitis et al, 2002). For the production of SeMet variant, the ecl18kIR gene was cloned in the pET21b(+) vector and expressed in the BL21 (DE3) strain carrying the plasmid pVH1[KnR] (with lacIq (Kupper et al, 1995)) and plasmid pHSG415ts (CmR) bearing the ecl18kIM gene (Tamulaitis et al, 2002). Recombinant SeMet variant of Ecl18kI was prepared by inhibiting the methionine synthesis pathway and expressing the protein in the presence of D,L-selenomethionine (Sigma) following the published procedure (Van Duyne et al, 1993). SeMet variant of Ecl18kI was purified as described (Tamulaitis et al, 2002). The purified wild type and SeMet proteins were stored in 10 mM Tris–HCl (pH 7.4, 25°C), 0.2 M KCl, 1 mM DTT, 1 mM EDTA, 50% glycerol. The protein concentration was determined by measuring the absorbance at 280 nm and using an extinction coefficient of 77 660 M−1 cm−1 calculated for the dimer by the ProtParam tool at http://www.expasy.ch/.
Sample preparation
Lyophilized oligodeoxynucleotides 5′-CGCCAGGGC-3′ (oligo 1) and 5′-GCCCTGGCG-3′ (oligo 2a) or 5′-CGCCAGGGC-3′ (oligo 1) and 5′-GCCCXGGCG-3′ (oligo 2b) (Metabion, HPLC grade, X is 5-iododeoxyuridine) were dissolved in water, heated to 95°C, annealed by overnight cooling to 4°C, and titrated to pH 7.5 with KOH. Ecl18kI was dialyzed against buffer A (5 mM Tris–HCl, pH 7.5, 0.2 M KCl, 1 mM EDTA, 1 mM DTT), concentrated, and mixed with an equimolar amount of oligoduplex per Ecl18kI dimer. The final concentration of Ecl18kI was 25 mg/ml.
Crystallization
Crystals were grown by the vapor diffusion technique in sitting drops, by mixing 2 μl of protein-DNA solution with 2 μl of buffer B (0.4 M (NH4)H2PO4), which served as the reservoir buffer. Crystallization was most reproducible if the pH was titrated to 4.1–4.2 if necessary. Crystals appeared after ∼1 month from thick precipitate. Prior to flash-cryocooling, crystals were transferred to a 17:3 mixture of buffer B and (2R,3R)-(−)-2,3-butandiol. Quick halide soaking was carried out according to Dauter's protocol (Dauter et al, 2000). Crystals of the SeMet variant of Ecl18kI could be obtained under identical crystallization conditions, but diffracted poorly. Many better-diffracting and nearly isomorphous crystals were obtained by mixing the protein solution 1:1 with buffer C (0.07 M sodium acetate, pH 4.6, 5.6% PEG 4000, 30% glycerol), which served also as the reservoir buffer. Crystals appeared overnight and could be flash-cryocooled without extra cryoprotection.
Data collection
Ecl18kI crystallized in space group P212121 with four protomers and two cognate double-stranded oligonucleotides in the asymmetric unit. All diffraction data were collected at 100 K at beamlines BW6 and X13 of the ‘Deutsches Elektronensynchrotron' in Hamburg, Germany, processed with DENZO (Otwinowski and Minor, 1997) and scaled with SCALEPACK (Otwinowski and Minor, 1997). The best data set, to 1.7 Å resolution, was obtained for a crystal that was grown in the presence of oligo 1 and the iodinated oligo 2b. This crystal was harvested more than a year after crystallization from an almost dry drop. The best native data set with oligonucleotides 1 and 2a extended only to 2.0 Å resolution.
Phasing
MAD data were collected for the SeMet variant at the selenium K-edge (two wavelengths, high redundancy, 3.3 Å resolution) and for a potassium bromide soak (Dauter et al, 2000) at the bromide K-edge (four wavelengths, lower redundancy, 2.3 Å resolution) (Supplementary Table SI). Analysis by the SHELXD software (Uson and Sheldrick, 1999) indicated that the signed anomalous differences of the selenomethionine data at the two wavelengths were over 90% correlated at low resolution and approximately 50% correlated at 3.3 Å resolution. The selenium substructure was solved with SHELXD. A total of 45 sites stood out with occupancies above 0.42 against noise sites with occupancies below 0.26, in good agreement with the 48 selenium sites that were chemically present in the four Ecl18kI protomers in the asymmetric unit. Phasing and electron density modification with the SHELXE program (Sheldrick, 2002) indicated a clear preference of one hand over the enantiomorphic alternative. The contrast, an SHELXE measure of map quality related to the Terwilliger and Berendzen (1999a, 1999b) criterion was 0.54 for the correct hand and 0.12 for the incorrect hand. The selenium sites were then used for an MLPHARE (CCP4, 1994) phasing run, which resulted in an overall figure of merit (FOM) of 0.58 for the resolution range from 20.0 to 3.5 Å.
After some phase improvement by electron density modification with the program DM (CCP4, 1994), the selenium phases were used to interpret the anomalous differences in the bromide data measured at 0.9185 Å, where bromide absorption is maximal. The top 40 peaks in the map (the detailed cutoff was arbitrary) were chosen to represent the bromide heavy atom substructure for phasing by the MLPHARE program (CCP4, 1994), and resulted in phases that extended to significantly higher resolution than the selenomethionine phases. Both phase sets were combined by the SIGMAA program (CCP4, 1994) and had a joint FOM of 0.39 for the resolution range from 20 to 2.3 Å. Phases were further improved by averaging and automasking with DM (CCP4, 1994). Details of the phasing procedure are collected in Supplementary Table SI.
Phase improvement and extension
The phases were improved and extended by solvent flattening, histogram matching and averaging. In the early stages, averaging was carried out with automasking. The orientations of the local two-fold rotation axes were deduced from the self-rotation function with the MOLREP program (Vagin and Teplyakov, 1997), and axis locations were deduced with the GETAX program (Vonrhein and Schulz, 1999). In later stages, the NCS-operators and averaging masks were based on the preliminary models.
Model building and refinement
With the combined and extended phases and the amplitudes to 1.7 Å, the ARP/WARP program (Lamzin and Wilson, 1993) built almost 900 of the expected 1220 residues that are chemically present in the four Ecl18kI protomers. After manual sequence assignment, which was checked for consistency with the known selenium positions, side chain building was mostly carried out automatically with the ARP/WARP program (Lamzin and Wilson, 1993). The protein model was completed manually by mapping the best parts from different protomers onto all other protomers, and by manual model improvement with the program O (Jones et al, 1991). DNA was built manually, using B-DNA nucleotides as building blocks. Eventually, all base pairs of the DNA, but not all amino acids of Ecl18kI could be built. The final models for all four protomers lack a few residues at the N-terminus and around residue 150, which are disordered in all four protomers. In all but one subunit, the residues at the very C-terminus are also poorly ordered. Refinement was carried out with the REFMAC program (Murshudov et al, 1997), without noncrystallographic symmetry (NCS)-restraints. The quality indicators of the final model are summarized in Table I and appear satisfactory for the 1.7 Å resolution data. The free R-factor for the 2.0 Å resolution data set is high, probably due to problems at the data collection stage, which included weak ice rings, very high mosaicity and an unfortunate orientation of the long crystallographic axis. At some of the DNA ends, weak, but regularly spaced electron density was present in the 2fo−fc maps calculated with the final model and with the structure factors of several different crystals. This density was too weak and too short for a 9-mer oligonucleotide to be interpreted as additional DNA and was left unexplained.
Table 1.
Summary of data collection and refinement statistics
| Ecl18kI crystallized with 5′-CGCCAGGGC-3′, 3′-GCGGTCCCG-5′ | Ecl18kI crystallized with 5′-CGCCAGGGC-3′, 3′-GCGGXCCCG-5′ | |
|---|---|---|
| Data collection statistics | ||
| Space group | P212121 | P212121 |
| A (Å) | 77.37 | 77.70 |
| B (Å) | 95.52 | 96.74 |
| C (Å) | 190.17 | 192.01 |
| Wavelength | 0.8019 | 1.0500 |
| Total reflections | 334 113 | 525 139 |
| Unique reflections | 93 417 | 158 490 |
| Resolution range (Å) | 20.0–2.0 | 40.0–1.7 |
| Completeness (%) (last shell) | 93.4 (97.5) | 97.7 (92.6) |
| I/σ | 40.8 (5.1) | 31.2 (3.9) |
| R(sym) (%) (last shell) | 3.4 (24.1) | 4.3 (33.7) |
| B(iso) from Wilson (Å2) | 35 | 31 |
| Refinement statistics | ||
| Resolution range (Å) | 20.0–2.0 | 20.0–1.7 |
| Reflections work/test | 86 277/4608 | 149 900/7898 |
| Protein atoms (excluding H) | 9638 | 9695 |
| DNA atoms (excluding H) | 726 | 726 |
| Solvent molecules | 555 | 602 |
| R-factor (%) | 21.2 | 20.7 |
| R-free (%) | 25.8 | 23.6 |
| R.m.s.d. bond lengths (Å) | 0.01 | 0.01 |
| R.m.s.d. angles (deg) | 1.3 | 1.5 |
| R.m.s. NCS difference (Å) | 0.80 | 0.79 |
| Average NCS difference (Å) | 0.54 | 0.47 |
| Ramachandran core region (%) | 94.0 | 95.4 |
| Ramachandran allowed region (%) | 5.6 | 4.3 |
| Ramachandran additionally allowed region (%) | 0.4 | 0.4 |
| Ramachandran disallowed region | 0.0 | 0.0 |
Lack of an iodine signal
Unexpectedly, we found no electron density peak for the iodine atom in 5-iodo-deoxyuridine in the 1.7 Å resolution data, which were collected for a crystal that was grown with the iodinated oligonucleotide. Therefore, a retrospective mass spectrometry analysis of the drops with Ecl18kI and the modified oligonucleotide duplex was performed. It confirmed that the expected molecular masses were present (oligo 1, predicted 2724.9 Da, measured 2725.0 Da; oligo 2b, predicted 2827.7, measured 2828.0 Da), but also identified an additional species of similar abundance with a molecular mass of 2715.5±0.3 Da, identical within the error limit to the expected mass of the unmodified oligo 2a (2715.8 Da). 5-Iodo-deoxyuridine is photolabile; therefore, the degradation of the oligonucleotide during the 1-year growth period of the crystal or during X-ray data collection would not be unexpected, but the mass of the additional oligonucleotide species in the drop points more to a contamination. As this uncertainty could not be resolved, the 2.0 Å resolution data set, which was collected for a crystal grown with the unmodified DNA, was also refined and confirms the conclusions for the 1.7 Å resolution data. In particular, the 2.0 Å resolution data confirm that nucleotide flipping occurs also with chemically unmodified DNA-duplexes.
Coordinates
Coordinates and structure factors have been submitted to the RCSB Protein Data Bank with Accession Codes 2FQZ (2.0 Å resolution data) and 2GB7 (1.7 Å resolution data).
Supplementary Material
Supplementary Table SI
Supplementary Figures S1 and S2
Acknowledgments
We thank Professor Hans Bartunik and Dr Gleb Bourenkov for generous allocation of beamtime on BW6 (DESY, Hamburg), and Dr Paul Tucker for assistance with data collection at beamline X13. VS is a recipient of a Lithuania State Scholarship. HC acknowledges the support from the Foundation for Polish Science. MB thanks the European Molecular Biology Organization (EMBO) and HHMI for a Young Investigator award. This work was supported by the Polish Ministry of Scientific Research and Information Technology Grant to MB (MNiI, decision KO89/PO4/2004) and Howard Hughes Medical Institute grant #55000336 to VS.
References
- Aggarwal AK (1995) Structure and function of restriction endonucleases. Curr Opin Struct Biol 5: 11–19 [DOI] [PubMed] [Google Scholar]
- Bigger CH, Murray K, Murray NE (1973) Recognition sequence of a restriction enzyme. Nat New Biol 244: 7–10 [DOI] [PubMed] [Google Scholar]
- Boyer HW, Chow LT, Dugaiczyk A, Hedgpeth J, Goodman HM (1973) DNA substrate site for the EcoRII restriction endonuclease and modification methylase. Nat New Biol 244: 40–43 [DOI] [PubMed] [Google Scholar]
- Bozic D, Grazulis S, Siksnys V, Huber R (1996) Crystal structure of Citrobacter freundii restriction endonuclease Cfr10I at 2.15 A resolution. J Mol Biol 255: 176–186 [DOI] [PubMed] [Google Scholar]
- Collaborative Computational Project Number 4 (1994) The CCP4 suite: programs for protein crystallography. Acta Crystallogr D 50: 760–763 [DOI] [PubMed] [Google Scholar]
- Dauter Z, Dauter M, Rajashankar KR (2000) Novel approach to phasing proteins: derivatization by short cryo-soaking with halides. Acta Crystallogr D 56 (Part 2): 232–237 [DOI] [PubMed] [Google Scholar]
- Deibert M, Grazulis S, Sasnauskas G, Siksnys V, Huber R (2000) Structure of the tetrameric restriction endonuclease NgoMIV in complex with cleaved DNA. Nat Struct Biol 7: 792–799 [DOI] [PubMed] [Google Scholar]
- Den'mukhametov MM, Zakharova MV, Kravets AN, Pertsev AV, Sineva EV, Repik AV, Beletskaia IV, Gromova ES, Solonin AS (1997) Characteristics of a plasmid bearing a gene of a restriction modification type II system—the SsoII isoschizomer. Mol Biol (Mosk) 31: 831–838 [PubMed] [Google Scholar]
- Denjmukhametov MM, Brevnov MG, Zakharova MV, Repyk AV, Solonin AS, Petrauskene OV, Gromova ES (1998) The Ecl18kI restriction-modification system: cloning, expression, properties of the purified enzymes. FEBS Lett 433: 233–236 [DOI] [PubMed] [Google Scholar]
- Grazulis S, Deibert M, Rimseliene R, Skirgaila R, Sasnauskas G, Lagunavicius A, Repin V, Urbanke C, Huber R, Siksnys V (2002) Crystal structure of the Bse634I restriction endonuclease: comparison of two enzymes recognizing the same DNA sequence. Nucleic Acids Res 30: 876–885 [DOI] [PMC free article] [PubMed] [Google Scholar]
- Ha SC, Lowenhaupt K, Rich A, Kim YG, Kim KK (2005) Crystal structure of a junction between B-DNA and Z-DNA reveals two extruded bases. Nature 437: 1183–1186 [DOI] [PubMed] [Google Scholar]
- Hashimoto H, Shimizu T, Imasaki T, Kato M, Shichijo N, Kita K, Sato M (2005) Crystal structures of type II restriction endonuclease EcoO109I and its complex with cognate DNA. J Biol Chem 280: 5605–5610 [DOI] [PubMed] [Google Scholar]
- Holz B, Klimasauskas S, Serva S, Weinhold E (1998) 2-Aminopurine as a fluorescent probe for DNA base flipping by methyltransferases. Nucleic Acids Res 26: 1076–1083 [DOI] [PMC free article] [PubMed] [Google Scholar]
- Hosfield DJ, Guan Y, Haas BJ, Cunningham RP, Tainer JA (1999) Structure of the DNA repair enzyme endonuclease IV and its DNA complex: double-nucleotide flipping at abasic sites and three-metal-ion catalysis. Cell 98: 397–408 [DOI] [PubMed] [Google Scholar]
- Ibanez M, Alvarez I, Rodriguez-Pena JM, Rotger R (1997) A ColE1-type plasmid from Salmonella enteritidis encodes a DNA cytosine methyltransferase. Gene 196: 145–158 [DOI] [PubMed] [Google Scholar]
- Jones TA, Zou JY, Cowan SW, Kjeldgaard M (1991) Improved methods for building protein models in electron density maps and the location of errors in these models. Acta Crystallogr A 47 (Part 2): 110–119 [DOI] [PubMed] [Google Scholar]
- Joshua-Tor L, Frolow F, Appella E, Hope H, Rabinovich D, Sussman JL (1992) Three-dimensional structures of bulge-containing DNA fragments. J Mol Biol 225: 397–431 [DOI] [PubMed] [Google Scholar]
- Karyagina AS, Lunin VG, Degtyarenko KN, Uvarov VY, Nikolskaya II (1993) Analysis of the nucleotide and derived amino acid sequences of the SsoII restriction endonuclease and methyltransferase. Gene 124: 13–19 [DOI] [PubMed] [Google Scholar]
- Kleywegt GJ, Jones TA (1998) Databases in protein crystallography. Acta Crystallogr D 54: 1119–1131 [DOI] [PubMed] [Google Scholar]
- Klimasauskas S, Kumar S, Roberts RJ, Cheng X (1994) HhaI methyltransferase flips its target base out of the DNA helix. Cell 76: 357–369 [DOI] [PubMed] [Google Scholar]
- Kovall RA, Matthews BW (1998) Structural, functional, and evolutionary relationships between lambda-exonuclease and the type II restriction endonucleases. Proc Natl Acad Sci USA 95: 7893–7897 [DOI] [PMC free article] [PubMed] [Google Scholar]
- Kubareva EA, Petrauskene OV, Karyagina AS, Tashlitsky VN, Nikolskaya II, Gromova ES (1992) Cleavage of synthetic substrates containing non-nucleotide inserts by restriction endonucleases. Change in the cleavage specificity of endonuclease SsoII. Nucleic Acids Res 20: 4533–4538 [DOI] [PMC free article] [PubMed] [Google Scholar]
- Kubareva EA, Thole H, Karyagina AS, Oretskaya TS, Pingoud A, Pingoud V (2000) Identification of a base-specific contact between the restriction endonuclease SsoII and its recognition sequence by photocross-linking. Nucleic Acids Res 28: 1085–1091 [DOI] [PMC free article] [PubMed] [Google Scholar]
- Kupper D, Reuter M, Mackeldanz P, Meisel A, Alves J, Schroeder C, Kruger DH (1995) Hyperexpressed EcoRII renatured from inclusion bodies and native enzyme both exhibit essential cooperativity with two DNA sites. Protein Exp Purif 6: 1–9 [DOI] [PubMed] [Google Scholar]
- Lamzin VS, Wilson KS (1993) Automated refinement of protein models. Acta Crystallogr D 49: 129–147 [DOI] [PubMed] [Google Scholar]
- Lau AY, Scharer OD, Samson L, Verdine GL, Ellenberger T (1998) Crystal structure of a human alkylbase-DNA repair enzyme complexed to DNA: mechanisms for nucleotide flipping and base excision. Cell 95: 249–258 [DOI] [PubMed] [Google Scholar]
- Miyahara M, Ishiwata N, Yoshida Y (1997) StyD4I restriction-modification system of Salmonella typhi D4: cloning and sequence analysis. Biol Pharm Bull 20: 201–203 [DOI] [PubMed] [Google Scholar]
- Morgan R, Xiao J, Xu S (1998) Characterization of an extremely thermostable restriction enzyme, PspGI, from a Pyrococcus strain and cloning of the PspGI restriction-modification system in Escherichia coli. Appl Environ Microbiol 64: 3669–3673 [DOI] [PMC free article] [PubMed] [Google Scholar]
- Murshudov GN, Vagin AA, Dodson EJ (1997) Refinement of macromolecular structures by the maximum-likelihood method. Acta Crystallogr D 53: 240–255 [DOI] [PubMed] [Google Scholar]
- Neely RK, Daujotyte D, Grazulis S, Magennis SW, Dryden DT, Klimasauskas S, Jones AC (2005) Time-resolved fluorescence of 2-aminopurine as a probe of base flipping in M.HhaI–DNA complexes. Nucleic Acids Res 33: 6953–6960 [DOI] [PMC free article] [PubMed] [Google Scholar]
- Newman M, Lunnen K, Wilson G, Greci J, Schildkraut I, Phillips SE (1998) Crystal structure of restriction endonuclease BglI bound to its interrupted DNA recognition sequence. EMBO J 17: 5466–5476 [DOI] [PMC free article] [PubMed] [Google Scholar]
- Otwinowski Z, Minor W (1997) Processing of X-ray diffraction data collected in oscillation mode. Methods Enzymol 276: 307–326 [DOI] [PubMed] [Google Scholar]
- Pingoud A, Fuxreiter M, Pingoud V, Wende W (2005a) Type II restriction endonucleases: structure and mechanism. Cell Mol Life Sci 62: 685–707 [DOI] [PMC free article] [PubMed] [Google Scholar]
- Pingoud A, Jeltsch A (2001) Structure and function of type II restriction endonucleases. Nucleic Acids Res 29: 3705–3727 [DOI] [PMC free article] [PubMed] [Google Scholar]
- Pingoud V, Conzelmann C, Kinzebach S, Sudina A, Metelev V, Kubareva E, Bujnicki JM, Lurz R, Luder G, Xu SY, Pingoud A (2003) PspGI, a type II restriction endonuclease from the extreme thermophile Pyrococcus sp.: structural and functional studies to investigate an evolutionary relationship with several mesophilic restriction enzymes. J Mol Biol 329: 913–929 [DOI] [PubMed] [Google Scholar]
- Pingoud V, Kubareva E, Stengel G, Friedhoff P, Bujnicki JM, Urbanke C, Sudina A, Pingoud A (2002) Evolutionary relationship between different subgroups of restriction endonucleases. J Biol Chem 277: 14306–14314 [DOI] [PubMed] [Google Scholar]
- Pingoud V, Sudina A, Geyer H, Bujnicki JM, Lurz R, Luder G, Morgan R, Kubareva E, Pingoud A (2005b) Specificity changes in the evolution of type II restriction endonucleases: a biochemical and bioinformatic analysis of restriction enzymes that recognize unrelated sequences. J Biol Chem 280: 4289–4298 [DOI] [PubMed] [Google Scholar]
- Roberts RJ, Vincze T, Posfai J, Macelis D (2005) REBASE—restriction enzymes and DNA methyltransferases. Nucleic Acids Res 33: D230–D232 [DOI] [PMC free article] [PubMed] [Google Scholar]
- Sheldrick GM (2002) Macromolecular phasing with SHELXE. Z Kristallogr 217: 644–650 [Google Scholar]
- Slupphaug G, Mol CD, Kavli B, Arvai AS, Krokan HE, Tainer JA (1996) A nucleotide-flipping mechanism from the structure of human uracil-DNA glycosylase bound to DNA. Nature 384: 87–92 [DOI] [PubMed] [Google Scholar]
- Tamulaitis G, Solonin AS, Siksnys V (2002) Alternative arrangements of catalytic residues at the active sites of restriction enzymes. FEBS Lett 518: 17–22 [DOI] [PubMed] [Google Scholar]
- Terwilliger TC, Berendzen J (1999a) Discrimination of solvent from protein regions in native Fouriers as a means of evaluating heavy-atom solutions in the MIR and MAD methods. Acta Crystallogr D 55 (Part 2): 501–505 [DOI] [PMC free article] [PubMed] [Google Scholar]
- Terwilliger TC, Berendzen J (1999b) Evaluation of macromolecular electron-density map quality using the correlation of local r.m.s. density. Acta Crystallogr D 55: 1872–1877 [DOI] [PMC free article] [PubMed] [Google Scholar]
- Uson I, Sheldrick GM (1999) Advances in direct methods for protein crystallography. Curr Opin Struct Biol 9: 643–648 [DOI] [PubMed] [Google Scholar]
- Vagin A, Teplyakov A (1997) MOLREP: an automated program for molecular replacement. J Appl Cryst 30: 1022–1025 [Google Scholar]
- van der Woerd MJ, Pelletier JJ, Xu S, Friedman AM (2001) Restriction enzyme BsoBI–DNA complex: a tunnel for recognition of degenerate DNA sequences and potential histidine catalysis. Structure (Camb) 9: 133–144 [DOI] [PubMed] [Google Scholar]
- Van Duyne GD, Standaert RF, Karplus PA, Schreiber SL, Clardy J (1993) Atomic structures of the human immunophilin FKBP-12 complexes with FK506 and rapamycin. J Mol Biol 229: 105–124 [DOI] [PubMed] [Google Scholar]
- Vanamee ES, Viadiu H, Kucera R, Dorner L, Picone S, Schildkraut I, Aggarwal AK (2005) A view of consecutive binding events from structures of tetrameric endonuclease SfiI bound to DNA. EMBO J 24: 4198–4208 [DOI] [PMC free article] [PubMed] [Google Scholar]
- Venclovas C, Timinskas A, Siksnys V (1994) Five-stranded beta-sheet sandwiched with two alpha-helices: a structural link between restriction endonucleases EcoRI and EcoRV. Proteins 20: 279–282 [DOI] [PubMed] [Google Scholar]
- Vonrhein C, Schulz GE (1999) Locating proper non-crystallographic symmetry in low-resolution electron-density maps with the program GETAX. Acta Crystallogr D 55 (Part 1): 225–229 [DOI] [PubMed] [Google Scholar]
- Wood KM, Daniels LE, Halford SE (2005) Long-range communications between DNA sites by the dimeric restriction endonuclease SgrAI. J Mol Biol 350: 240–253 [DOI] [PubMed] [Google Scholar]
- Zhou XE, Wang Y, Reuter M, Mucke M, Kruger DH, Meehan EJ, Chen L (2004) Crystal structure of type IIE restriction endonuclease EcoRII reveals an autoinhibition mechanism by a novel effector-binding fold. J Mol Biol 335: 307–319 [DOI] [PubMed] [Google Scholar]
Associated Data
This section collects any data citations, data availability statements, or supplementary materials included in this article.
Supplementary Materials
Supplementary Table SI
Supplementary Figures S1 and S2