Abstract
The ability to mix liquids in microchannel networks is fundamentally important in the design of nearly every miniaturized chemical and biochemical analysis system. Here, we show that enhanced micromixing can be achieved in topologically simple and easily fabricated planar 2D microchannels by simply introducing curvature and changes in width in a prescribed manner. This goal is accomplished by harnessing a synergistic combination of (i) Dean vortices that arise in the vertical plane of curved channels as a consequence of an interplay between inertial, centrifugal, and viscous effects, and (ii) expansion vortices that arise in the horizontal plane due to an abrupt increase in a conduit's cross-sectional area. We characterize these effects by using confocal microscopy of aqueous fluorescent dye streams and by observing binding interactions between an intercalating dye and double-stranded DNA. These mixing approaches are versatile and scalable and can be straightforwardly integrated as generic components in a variety of lab-on-a-chip systems.
Keywords: Dean flow, expansion vortex, microfluidics, lab on a chip
Although microfluidic mixing is a key process in a host of miniaturized analysis systems (1–7), it continues to pose challenges owing to constraints associated with operating in an unfavorable laminar flow regime dominated by molecular diffusion and characterized by a combination of low Reynolds numbers (Re = Vd/v ≪ 100, where V is the flow velocity, d is a length scale associated with the channel diameter, and v is the fluid kinematic viscosity) and high Péclet numbers (Pe = Vd/D > 100, where D is the molecular diffusivity). The relatively large discrepancy between convective and diffusive timescales implies that in a straight smooth-walled microchannel, the downstream distances over which liquids must travel to become fully intermixed (Δym ∼ Vd2/D = Pe × d) can be on the order of several centimeters. These mixing lengths are generally prohibitively long and often negate many of the benefits of miniaturization.
A wide variety of micromixing approaches have been explored (8, 9), most of which can be broadly classified as either “active” (involving input of external energy) or “passive” (harnessing the inherent hydrodynamic structure of specific flow fields to mix fluids in the absence of external forces). Passive designs are often desirable in applications involving sensitive species (e.g., biological samples) because they do not impose strong mechanical, electrical, or thermal agitation. Examples of passive micromixing approaches that have been widely investigated include the following: (i) “split-and-recombine” strategies where the streams to be mixed are divided or split into multiple channels and redirected along trajectories that allow them to be subsequently reassembled as alternating lamellae yielding exponential reductions in interspecies diffusion length and time scales (4, 10–12); and (ii) “chaotic” strategies where transverse flows are passively generated that continuously expand interfacial area between species through stretching, folding, and breakup processes (13–20). The microchannel structures associated with these mixing elements range from relatively simple topological features on one or more channel walls (ridges, grooves, or other protrusions that can, for example, be constructed by means of multiple soft lithography, alignment, and bonding steps) to intricate 3D flow networks requiring timescales on the order of days to fabricate. Ultimately, it would be desirable to achieve gentle passive micromixing in the shortest possible downstream distance by using simplified microchannel geometries (ideally, planar 2D smooth-walled) that can be easily constructed (ideally, in a single lithography step).
Manipulating the action of transverse vortex phenomena that naturally arise in specific flows offers a promising approach to address these needs. For example, fluids traveling through curvilinear channels experience an interplay between inertial forces acting to direct axial motion and centrifugal effects acting along the conduit's radius of curvature. Under appropriate conditions, these effects establish a radial pressure gradient whose magnitude can become sufficient to generate a transverse flow field. These so-called Dean flows occur widely in nature and play an important role in a variety of applications ranging from chemical and mechanical engineering (e.g., heat exchangers, piping systems) to biomedical science (e.g., arterial blood flow, dialysis instruments) (21). The concept of Dean mixing has been explored extensively on the macroscale (22–26), where the use of helical tubes or pipes that extend out of a 2D plane allows curved flow trajectories to be maintained far downstream. A further adaptation of Dean effects are so-called “twisted pipe” designs (constructed by joining a series of planar curved segments such that each subsequent segment is oriented at a nonzero pitch angle relative to the previous one) where the inherent symmetry of the secondary flow streamlines is disrupted yielding chaotic particle trajectories (27). Variations of helical and twisted pipe arrangements have been investigated to enhance mixing in microfluidic systems; however, the corresponding nonplanar flow geometries often require multilevel or specialized fabrication processes that can introduce added complexity (17, 19, 28, 29). Conversely, the design of planar curved microchannels capable of sustaining transverse circulation over a sufficient downstream distance to compensate for the incompatibility between flow and diffusion timescales also has proven challenging (30–37).
In this work, we show how these limitations can be overcome so that transverse Dean flows can be readily harnessed at the microscale to enable efficient micromixing in topologically simple and easily fabricated planar smooth-walled 2D microchannels. Two unique micromixer designs are described as follows: (i) a planar split-and-recombine (P-SAR) arrangement capable of generating multiple alternating lamellae of individual fluid species, and (ii) an asymmetric serpentine micromixer (ASM) configuration coupling vertical transverse Dean flow effects with the action of expansion vortices in the horizontal plane. Mixing and flow characterization studies are performed by using a combination of direct visualization of colored dye tracers and cross-sectional confocal imaging. Practical applications are illustrated through the use of micromixing to enhance binding interactions between double-stranded DNA (dsDNA) and an intercalating dye.
Results and Discussion
P-SAR Micromixer.
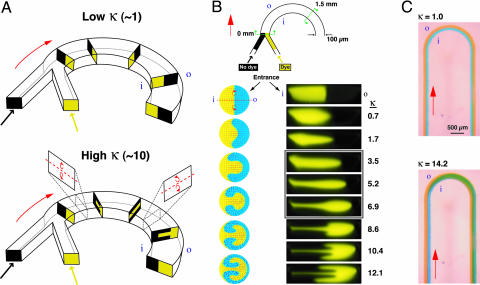
The transverse secondary flow associated with Dean effects can be characterized in terms of a dimensionless “Dean number” κ that expresses the relative magnitudes of inertial and centrifugal forces to viscous forces [κ = δ0.5Re, where δ = d/R and R is the flow path radius of curvature (21)]. Here, we compute Re = Vd/v by taking d as the channel hydraulic diameter d = 4AC/P, where AC is the cross-sectional area and P is the wetted perimeter (the trapezoidal microchannel cross-sections were approximated as rectangular). Microchannel Dean flows generally fall in the regime κ ≪ 100, where the secondary flow consists of a pair of counterrotating vortices positioned symmetrically above and below the channel midplane. At very low flow rates (κ ∼ 1) centrifugal effects are not strong enough to significantly perturb the axial laminar flow profile. As the flow rate is increased (κ ∼ 10) the transverse flow component acts to transport fluid from the inner wall of the channel radially toward the outer wall (Fig. 1A). Under these conditions [low curvature limit (δ < 1), Re ≲ 100], the essential features of the secondary flow field are well described by Dean's solution to a perturbation analysis of the equations of motion (38–40). Centrifugal effects are greatest along the centerline where the axial velocity is maximum, resulting in outward flow along the midplane while slower-moving fluid near the walls is simultaneously swept inward (Fig. 1B). Ultimately, a nearly complete 180° rotation can be induced, causing two parallel fluid streams to almost entirely switch positions (Fig. 1C).
Fig. 1.
Dean flow phenomena in curved microchannels. (A) Idealized Dean flow mediated rotation sequence (i and o denote the inner and outer channel walls). At low κ (Upper), two parallel streams of different species (yellow and black) entering a curved microchannel segment experience minimal perturbation to the laminar flow. At κ ∼ 10 (Lower), the transverse flow generated by the counterrotating Dean vortices in the upper and lower halves of the channel transport the inner (yellow) stream toward the outer wall while the outer (black) stream is pulled inward, causing the positions of each species to be transposed. (B Upper) Schematic of the curved microchannel geometry investigated (100 μm wide; 29 μm tall; 630 μm radius of curvature). The transverse flow field was examined at the entrance to the curved segment and at a location 1.5 mm downstream. Analytically computed velocity and concentration profiles are shown (Left Lower) beside confocal cross-sectional images of the transverse flow in the microchannel (Right Lower) at flow rates ranging from 2.6 < Re < 45.1 (0.7 < κ < 12.1). The boxed area represents conditions under which the transverse flow induces ≈90° rotation in the upper and lower halves of the channel. (C) Top-view images of aqueous streams labeled with blue and yellow dye in a curved microchannel segment (200 μm wide; 29 μm tall; 630 μm radius of curvature). At κ = 1.0 (Upper) the streams flow in parallel along the entire length, whereas at κ = 14.2 (Lower) the blue stream is transported from the inner to the outer wall.
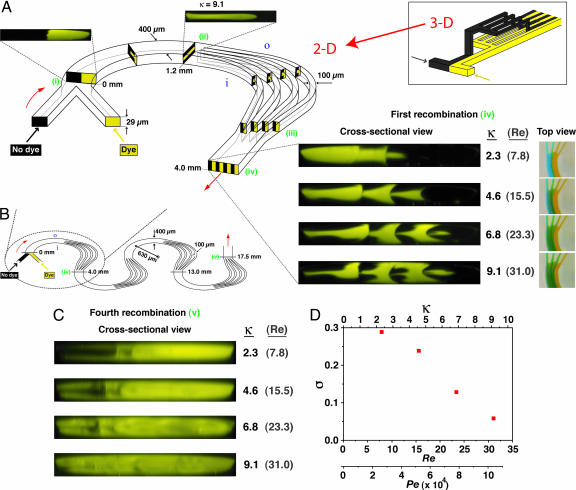
The intrinsic rotational character of Dean flows can be harnessed in combination with a simple 2D microchannel design to increase interfacial area between species without the need to construct intricate 3D geometries (e.g., Fig. 2A Inset). In this P-SAR design, parallel liquid streams first travel through a curved segment that induces simultaneous ≈90° rotations in the upper and lower halves of the channel (e.g., the boxed images in Fig. 1B), at which point the flow is split into multiple streams that continue along curved trajectories such that each individual split stream experiences a second pair of ≈90° rotations. These successive rotation steps transpose the position of each species such that alternating lamellae are formed when the streams are rejoined.
Fig. 2.
P-SAR micromixer incorporating four split streams. (A) Planar 2D microchannel geometry capable of generating alternating lamellae of individual fluid species in a split-and-recombine arrangement (400 μm wide; 29 μm tall; 630 μm radius of curvature; Re and κ computed based on the 400-μm wide segment; i and o denote the inner and outer channel walls, respectively). Flow schematics are shown inside the channel; corresponding confocal images are shown outside. Parallel streams of different species enter the curved microchannel (i) and experience a transverse flow generated by the counterrotating vortices above and below the channel midplane that induce a corresponding pair of 90° rotations in the fluid (ii). At this point (1.2 mm downstream from entrance), the flow is split into four parallel streams that proceed along curved trajectories inducing a second pair of 90° fluid rotations in each stream (between ii and iii). Alternating lamellae of the two species are generated when the streams are rejoined 4 mm downstream from the entrance (iv). Cross-sectional confocal images and the corresponding top-view images taken after the first recombination are shown. (Inset) Conventional 3D microchannel design required to achieve an equivalent lamination effect. (B) Schematic of a microchannel incorporating a series of successive P-SAR mixing elements. (C) Confocal cross-sectional images taken after the fourth recombination (position v in B). As κ is increased, the two species become almost completely intermixed, as indicated by uniform fluorescence over the channel cross-section. (D) Plot of σ computed from the confocal image sequence in C as a function of the Dean, Reynolds, and Péclet numbers (Pe was computed using D = 3 × 10⁻⁶ cm2/s for Rhodamine 6G).
We visualized this process by performing confocal cross-sectional imaging experiments in a microchannel that is split into four streams at a distance of 1.2 mm from the entrance and subsequently rejoined at a downstream distance of 4 mm (Fig. 2). At low flow rates, the secondary flow is not strong enough to induce sufficient rotation. At higher flow rates, however, the fluid species undergo a sequence of rotations such that upon rejoining, alternating lamellae of each species appear accompanied by a corresponding increase in interfacial area (see confocal exit image sequence in Fig. 2A). By employing a channel incorporating a series of four successive P-SAR elements (Fig. 2B), a level of 90% mixing is achieved at the 17.5-mm downstream position at κ = 9.1 (Fig. 2 C and D). The evolution of this lamellar structure is further illustrated by confocal imaging of the flow within individual split streams (see Fig. 6, which is published as supporting information on the PNAS web site).
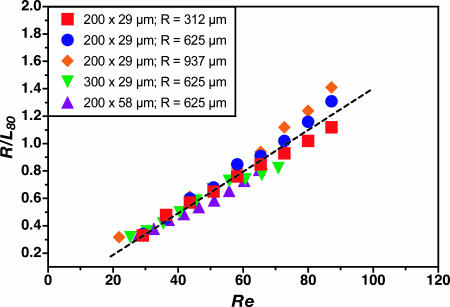
Optimal P-SAR design involves splitting the microchannel into multiple streams at a downstream location where the transverse flow has induced simultaneous ≈90° counterrotations in the upper and lower halves of the cross-section. The manner in which this location depends on channel geometry and flow conditions can be inferred by considering the relative timescales associated with the axial and transverse components of fluid motion. Axial transport can be approximated as laminar Poiseuille flow with characteristic velocity uA ∼ U0 (the maximum centerline velocity), whereas the transverse (Dean flow) velocity scales as uD ∼ Re(d/R)U0 (26, 41). A ratio of corresponding timescales is then τA/τD ∼ (LA/uA)/(LD/uD) = (LA/R)Re, where LA and LD are characteristic axial and transverse length scales, respectively, and LD is taken to be the hydraulic diameter d. The downstream location at which a fluid element is transported across the width of the microchannel can then be estimated by setting τA/τD ∼ 1, suggesting a linear scaling (R/LA) ∼ Re. This relationship is consistent with analysis of flow in macroscale helical pipes (26) and is experimentally confirmed by visualization of colored dye streams (see Fig. 7, which is published as supporting information on the PNAS web site). Arbitrarily assigning LA as the downstream location where transverse rotation effects pull the inner dye stream outward to occupy 80% of the channel width (L80), image analysis of data from nearly 50 experiments performed by using various combinations of R, Re, and cross-sectional dimensions superimpose and exhibit behavior consistent with a linear Re dependence (Fig. 3; deviations from the linear trend at high Re may be a consequence of slight but visible bulging deformations induced in the channel due to the increased pressure required to impose high-flow-rate conditions).
Fig. 3.
Influence of flow and microchannel geometry on transverse rotation as reflected in the evolution of the parameter R/L80 with Re in microchannel geometries incorporating multiple combinations of cross-sectional area and radius of curvature. The dashed line depicts a linear regression fit to the ensemble of nearly 50 data points.
Conventional split-and-recombine micromixers employ 3D microchannel networks to divide, redirect, and reassemble liquid streams (e.g., Fig. 2A Inset). In these configurations, the reduction in mixing time that accompanies lamellar formation is offset by a corresponding increase in flow time associated with splitting and redirecting an increasing number of individual streams before reassembly. The P-SAR design does not suffer from this limitation because the length of the curved flow trajectory is independent of the number of splits, resulting in significantly faster overall mixing times (see Supporting Text and Fig. 8, which are published as supporting information on the PNAS web site). Finally, we note that analogous flow phenomena can arise in conduits subjected to spanwise rotation [e.g., in microchannels constructed on a rotating platform (42, 43)] where transverse flows are generated by Coriolis effects and the Rossby number plays a comparable role to the Dean number (44, 45).
ASM.
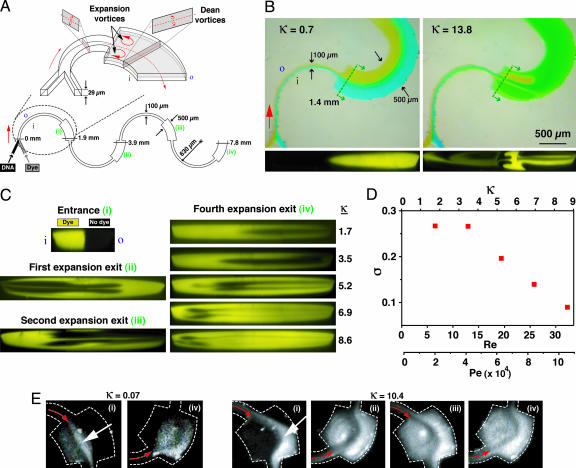
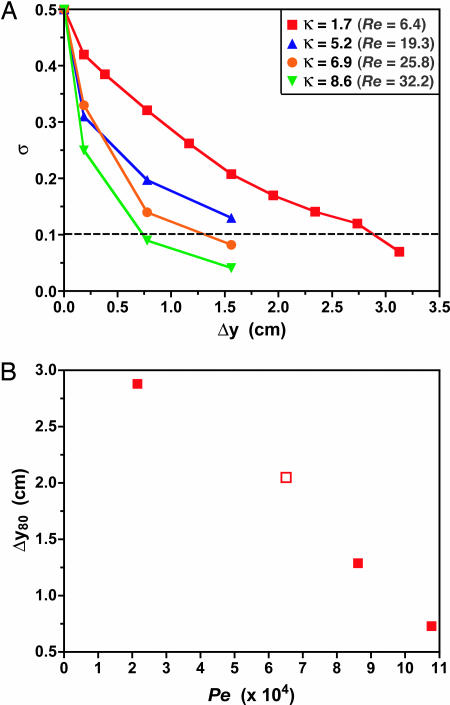
Beyond a critical Re, fluid encountering a sudden increase in a conduit's cross-sectional area undergoes local separation from the wall in response to the adverse pressure gradient resulting in the formation of a vortex pair bracketing the entrance to the expansion (46, 47). When these expansion phenomena in the horizontal plane are coupled with Dean effects in the vertical plane, the resulting multivortex flow field can further accelerate interspecies transport (Fig. 4A). This effect can be seen by direct visualization of colored dye streams in a curved microchannel incorporating an expansion from 100 to 500 μm in width (Fig. 4B; see also Movie 1, which is published as supporting information on the PNAS web site). The effectiveness of this multivortex arrangement is demonstrated in an ASM design consisting of a curved serpentine microchannel incorporating abrupt expansions at periodic locations along the flow path (Fig. 4A). Cross-sectional confocal imaging shows that mixing is only enhanced above a critical flow rate at which the strength of both Dean and expansion vortices become significant (Fig. 4C). With this simple modification to the serpentine microchannel geometry, a level of 80% mixing is achieved at the 7.8-mm downstream position at Re ∼ 32, with even greater efficiencies possible at higher flow rates (Fig. 4D). Mixing is not enhanced at low flow rates or in the absence of expansion segments, consistent with observations in serpentine and square wave flow geometries of uniform cross-section (17, 19, 35). We examined the practical utility of the ASM design by observing its influence on binding interactions between a fluorescent intercalating dye and dsDNA (Fig. 4E). Fluorescence intensity is confined to the vicinity of the channel centerline at κ = 0.07 but grows to occupy the entire cross-section at κ = 10.4, indicative of an enhancement in interspecies encounters leading to an increase in the population of bound complexes.
Fig. 4.
Multivortex phenomena in an ASM design. (A) Schematic of coupled transverse Dean (vertical plane) and expansion vortex (horizontal plane) effects in the vicinity of an abrupt increase in width from 100 to 500 μm over the last quarter of each semicircular arc (29 μm tall; 630 μm radius of curvature; Re, κ computed based on the 100-μm-wide segment; i and o denote inner and outer walls, respectively). (B) Top-view images (Upper) and corresponding confocal cross-sectional images (Lower) taken at the entrance to an expansion in width from 100 to 500 μm occurring 1.5 mm downstream from the entrance depicting vortex formation with increasing κ. (C) Confocal cross-sectional images taken at downstream positions indicated in A at Re = 32.2 and κ = 8.6. Images taken at the end of the fourth expansion (position iv in A) are also shown at flow rates ranging from 6.4 < Re < 32.2 (1.7 < κ < 8.6). As κ is increased, the two species become almost completely intermixed, as indicated by uniform fluorescence over the channel cross-section. (D) Plot of σ at position iv in A computed from the confocal image sequence in C as a function of the Dean, Reynolds, and Péclet numbers (Pe was computed using D = 3 × 10⁻⁶ cm2/s for Rhodamine 6G). (E) Binding enhancement between dsDNA (calf thymus, 2.5 μg/ml) and an intercalating dye (ethidium bromide, 50 μg/ml) with increasing κ (dashed lines denote the microchannel walls). Images were taken at the positions indicated in A; red arrows indicate the flow direction, and white arrows indicate increased fluorescence above the background level of the unbound dye due to intercalation at the interface between streams.
Optimal ASM design involves two geometric considerations. First, expansions should be positioned at downstream locations where simultaneous counterrotations of at least 90° have occurred in the upper and lower halves of the cross-section to align the interface between species with the horizontal plane and maximize expansion effects on both species. This location can be determined by using the same analysis discussed for the P-SAR mixer design (Fig. 3). Second, these phenomena depend on the expansion ratio [i.e., the ratio of inlet (narrow) to outlet (wide) cross-sectional areas]. Our ASM design incorporates a 1:5 expansion ratio, providing a balance between favorable micromixing and ease of fabrication (e.g., avoiding problems with microchannel sagging at high expansion ratios). In terms of flow conditions, the ASM is effective at Re > 1 (i.e., where there is sufficient inertial driving force to generate transverse flow). At higher flow rates, an inverse relationship between mixing length and Péclet number is observed (Fig. 5), in contrast to chaotically driven configurations, which display a signature logarithmic dependence of mixing length on Pe (18). For aqueous working fluids, the ASM is capable of achieving a level of 80% mixing in downstream distances of Δy80 < 7 mm at flow rates of >10−1 ml/min (see Supporting Text and also Table 1 and Fig. 9, which are published as supporting information on the PNAS web site).
Fig. 5.
Mixing performance of the ASM design in Fig. 4A. (A) Flow rate dependence of the evolution of σ with downstream distance. (B) Variation of the downstream distance to achieve 80% mixing (Δy80, determined from intersection of mixing intensity data with the dashed line in A) with Péclet number. The open symbol at Pe ∼ 6.5 × 10⁴ indicates that this mixing length was estimated by extrapolation.
In summary, the P-SAR and ASM designs are capable of efficient micromixing in short downstream distances using microchannel geometries that can be easily fabricated in a single lithography step. This level of simplicity makes these micromixing approaches broadly applicable as generic components in a wide range of lab-on-a-chip systems, including those constructed in substrates where soft lithography cannot be used (e.g., glass, quartz, or silicon).
Materials and Methods
Device Fabrication.
Master molds were fabricated by using a printed circuit-based process (48). Soft lithography then was used to construct microchannels by heating the master to 120°C on a hot plate and making an impression of the pattern in a melt-processable thermoplastic elastomer gel substrate (49). After cooling and release, fluidic access holes were fashioned by using a syringe needle, and the channels were thermally bonded to a flat surface of the elastomer to form enclosed channel networks.
Flow Visualization.
Cross-sectional images of two aqueous streams, one of which was labeled with fluorescent Rhodamine 6G (Aldrich), were obtained by using a LSM 5 PASCAL confocal scanning microscope (Zeiss) with a 40×, 0.6 numerical aperture objective. Mixing efficiency was quantified by computing the standard deviation of the intensity distribution over each image, σ = 〈(I – 〈I〉)2〉, where I is the grayscale value of each pixel (scaled between 0 and 1) and 〈·〉 denotes an average over all of the pixels in the image. Thus, σ = 0.5 corresponds to two completely unmixed regions whereas σ = 0 corresponds to complete mixing. Top-view images of aqueous streams labeled with blue and yellow food dye (Adams Extract) were obtained by using a MZ8 microscope (Leica) interfaced with a Coolpix 4500 digital camera (Nikon). Flow rates were controlled by using a multifeed syringe pump (Harvard Apparatus).
Binding Experiments.
Binding experiments were carried out between two aqueous streams, one containing 50 μg/ml calf thymus DNA (Sigma-Aldrich) and the other containing 2.5 μg/ml ethidium bromide (Maxim Biotech, South San Francisco, CA). Fluorescence was detected by using an Olympus SZX-12 stereoscope with a mercury arc illumination source and GFP filter set and imaged by using a CCD-300 camera with Geniisys intensifier (Dage-MTI, Michigan City, IN).
Supplementary Material
Acknowledgments
We thank Dr. Michael A. Bevan and Richard E. Beckham for invaluable assistance with the confocal imaging experiments and also for unselfishly allowing us to access their confocal microscope at all hours. We also thank Maria Handal for exceptionally insightful discussions about how to visually depict the flow phenomena. This work was supported by National Institutes of Health Grant NIH K22-HG02297.
Abbreviations
- ASM
asymmetric serpentine micromixer
- P-SAR
planar split-and-recombine.
Footnotes
Conflict of interest statement: No conflicts declared.
This paper was submitted directly (Track II) to the PNAS office.
References
- 1.Beebe D. J., Mensing G. A., Walker G. M. Annu. Rev. Biomed. Eng. 2002;4:261–286. doi: 10.1146/annurev.bioeng.4.112601.125916. [DOI] [PubMed] [Google Scholar]
- 2.Burns M. A., Johnson B. N., Brahmasandra S. N., Handique K., Webster J. R., Krishnan M., Sammarco T. S., Man P. M., Jones D., Heldsinger D., et al. Science. 1998;282:484–487. doi: 10.1126/science.282.5388.484. [DOI] [PubMed] [Google Scholar]
- 3.Günther A., Jhunjhunwala M., Thalmann M., Schmidt M. A., Jensen K. F. Langmuir. 2005;21:1547–1555. doi: 10.1021/la0482406. [DOI] [PubMed] [Google Scholar]
- 4.Jensen K. Nature. 1998;393:735–737. [Google Scholar]
- 5.Knight J. Nature. 2002;418:474–475. doi: 10.1038/418474a. [DOI] [PubMed] [Google Scholar]
- 6.Ottino J. M., Wiggins S. Science. 2004;305:485–486. doi: 10.1126/science.1099343. [DOI] [PubMed] [Google Scholar]
- 7.Stone H. A., Stroock A. D., Ajdari A. Annu. Rev. Fluid Mech. 2004;36:381–411. [Google Scholar]
- 8.Nguyen N.-T., Wu Z. J. Micromech. Microeng. 2005;15:R1–R16. [Google Scholar]
- 9.Ottino J. M., Wiggins S. Philos. Trans. R. Soc. London Ser. A. 2004;362:923–935. doi: 10.1098/rsta.2003.1355. [DOI] [PubMed] [Google Scholar]
- 10.Bessoth F. G., deMello A. J., Manz A. Anal. Comm. 1999;36:213–215. [Google Scholar]
- 11.Erbacher C., Bessoth F. G., Busch M., Verpoorte E., Manz A. Mikrochim. Acta. 1999;131:19–24. [Google Scholar]
- 12.Hardt S., Pennemann H., Schönfeld F. Microfluidics Nanofluidics. 2006;2 10.1007/s10404–005-0071-6. [Google Scholar]
- 13.Howell P. B., Jr., Mott D. R., Fertig S., Kaplan C. R., Golden J. P., Oran E. S., Ligler F. S. Lab Chip. 2005;5:524–530. doi: 10.1039/b418243j. [DOI] [PubMed] [Google Scholar]
- 14.Johnson T. J., Ross D., Locascio L. E. Anal. Chem. 2002;74:45–51. doi: 10.1021/ac010895d. [DOI] [PubMed] [Google Scholar]
- 15.Kim D. J., Oh H. J., Park T. H., Choo J. B., Lee S. H. Analyst. 2005;130:293–298. doi: 10.1039/b414180f. [DOI] [PubMed] [Google Scholar]
- 16.Kim D. S., Lee S. H., Kwon T. H., Ahn C. H. Lab Chip. 2005;5:739–747. doi: 10.1039/b418314b. [DOI] [PubMed] [Google Scholar]
- 17.Liu R. H., Stremler M. A., Sharp K. V., Olsen M. G., Santiago J. G., Adrian R. J., Aref H., Beebe D. J. J. Microelectromech. Sys. 2000;9:190–197. [Google Scholar]
- 18.Stroock A. D., Dertinger S. K. W., Ajdari A., Mezic I., Stone H. A., Whitesides G. M. Science. 2002;295:647–651. doi: 10.1126/science.1066238. [DOI] [PubMed] [Google Scholar]
- 19.Therriault D., White S. R., Lewis J. A. Nat. Mater. 2003;2:265–271. doi: 10.1038/nmat863. [DOI] [PubMed] [Google Scholar]
- 20.Kim D. S., Lee S. W., Kwon T. H., Lee S. S. J. Micromech. Microeng. 2004;14:798–805. [Google Scholar]
- 21.Berger S. A., Talbot L. Annu. Rev. Fluid Mech. 1983;15:461–512. [Google Scholar]
- 22.Erdogan M. E., Chatwin P. C. J. Fluid Mech. 1967;29:465–484. [Google Scholar]
- 23.Janssen L. A. M. Chem. Eng. Sci. 1976;31:215–218. [Google Scholar]
- 24.Johnson M., Kamm R. D. J. Fluid Mech. 1986;172:329–345. [Google Scholar]
- 25.Nunge R. J., Lin T. S., Gill W. N. J. Fluid Mech. 1972;51:363–383. [Google Scholar]
- 26.Ruthven D. M. Chem. Eng. Sci. 1971;26:1113–1121. [Google Scholar]
- 27.Jones S. W., Thomas O. M., Aref H. J. Fluid Mech. 1989;209:335–357. [Google Scholar]
- 28.Bertsch A., Heimgartner S., Cousseau P., Renaud P. Lab Chip. 2001;1:56–60. doi: 10.1039/b103848f. [DOI] [PubMed] [Google Scholar]
- 29.Kim D. S., Lee I. H., Kwon T. H., Cho D.-W. J. Micromech. Microeng. 2004;14:1294–1301. [Google Scholar]
- 30.Howell P. B., Jr., Mott D. R., Golden J. P., Ligler F. S. Lab Chip. 2004;4:663–669. doi: 10.1039/b407170k. [DOI] [PubMed] [Google Scholar]
- 31.Sudarsan A. P., Ugaz V. M. Lab Chip. 2006;6:74–82. doi: 10.1039/b511524h. [DOI] [PubMed] [Google Scholar]
- 32.Vanka S. P., Luo G., Winkler C. M. AIChE J. 2004;50:2359–2368. [Google Scholar]
- 33.Vanka S. P., Winkler C. M., Coffman J., Linderman E., Mahjub S., Young B. Proceedings of the 4th ASME/JSME Joint Fluids Engineering Conference, Honolulu, HI; New York: Am. Soc. Mech. Engineers; 2003. pp. 887–892. [Google Scholar]
- 34.Yamaguchi Y., Takagi F., Watari T., Yamashita K., Nakamura H., Shimizu H., Maeda H. Chem. Eng. J. 2004;101:367–372. [Google Scholar]
- 35.Yamaguchi Y., Takagi F., Yamashita K., Nakamura H., Maeda H., Sotowa K., Kusakabe K., Yamasaki Y., Morooka S. AIChE J. 2004;50:1530–1535. [Google Scholar]
- 36.Jiang F., Drese K. S., Hardt S., Küpper M., Schönfeld F. AIChE J. 2004;50:2297–2305. [Google Scholar]
- 37.Schönfeld F., Hardt S. AIChE J. 2004;50:771–778. [Google Scholar]
- 38.Dean W. R. Philos. Mag. Ser. 7. 1927;4:208–223. [Google Scholar]
- 39.Dean W. R. Philos. Mag. Ser. 7. 1928;5:673–695. [Google Scholar]
- 40.Gelfgat A. Y., Yarin A. L., Bar-Yoseph P. Z. Phys. Fluids. 2003;15:330–347. [Google Scholar]
- 41.Squires T. M., Quake S. R. Rev. Mod. Phys. 2005;77:977–1026. [Google Scholar]
- 42.Ducrée J., Brenner T., Haeberle S., Glatzel T., Zengerle R. Microfluidics Nanofluidics. 2006;2:78–84. [Google Scholar]
- 43.Grumann M., Geipel A., Riegger L., Zengerle R., Ducrée J. Lab Chip. 2005;5:560–565. doi: 10.1039/b418253g. [DOI] [PubMed] [Google Scholar]
- 44.Kheshgi H. S., Scriven L. E. Phys. Fluids. 1985;28:2968–2979. [Google Scholar]
- 45.Speziale C. G., Thangam S. J. Fluid Mech. 1983;130:377–395. [Google Scholar]
- 46.Alleborn N., Nandakumar K., Raszillier H., Durst F. J. Fluid Mech. 1997;330:169–188. [Google Scholar]
- 47.Cherdron W., Durst F., Whitelaw J. H. J. Fluid Mech. 1978;84:13–31. [Google Scholar]
- 48.Sudarsan A. P., Ugaz V. M. Anal. Chem. 2004;76:3229–3235. doi: 10.1021/ac035411n. [DOI] [PubMed] [Google Scholar]
- 49.Sudarsan A. P., Wang J., Ugaz V. M. Anal. Chem. 2005;77:5167–5173. doi: 10.1021/ac050448o. [DOI] [PubMed] [Google Scholar]
Associated Data
This section collects any data citations, data availability statements, or supplementary materials included in this article.


