

Abstract
The most critical step in maize domestication (Zea mays ssp. mays) was the liberation of the kernel from the hardened, protective casing that envelops the kernel in the maize progenitor, teosinte1. This evolutionary step exposed the kernel on the surface of the ear such that it could be readily utilized as a food source by humans. Here, we show that this key event in maize domestication is controlled by a single gene (teosinte glume architecture; tga1) belonging to the SBP-domain family2 of transcriptional regulators. The factor controlling the phenotypic difference between maize and teosinte maps to a 1 kilobase region within which maize and teosinte show only six fixed differences in their DNA sequences. One of these differences encodes a non-conservative amino acid substitution and may affect protein function, while the other five differences potentially affect gene regulation. Molecular evolution analyses show that this region was the target of selection during maize domestication. Our results demonstrate that modest genetic changes in single genes can induce dramatic changes in phenotype during domestication and evolution.
The origin of the maize ear has been considered one of the greatest mysteries in both crop domestication3 and plant evolution4. While a wealth of botanical and genetic information has identified the wild Mexican grass, teosinte (Zea mays ssp. parviglumis), as the direct progenitor of maize, the profound differences in the structure of the maize and teosinte female inflorescences (ears) has posed a challenge to formulating a compelling model for the developmental and genetic steps involved in this evolutionary transition3. At the heart of the problem is the fact that teosinte kernels are tightly encased in structures called cupulate fruitcases, while maize kernels are borne uncovered on the surface of the ear (Figure 1a, b). The strength with which the fruitcase envelops the teosinte kernel and the stony nature of this casing far exceed the relatively flimsy and loosely bound chaff that surrounds the kernels of the ancestors of the other domesticated cereals. Indeed, the stony fruitcase of teosinte had been considered such an obstacle to the use of teosinte as a grain that teosinte was dismissed by some as a possible progenitor of maize5. It was argued that the genetic steps to free the grain from this casing and thereby convert teosinte into a useful crop were too complex to have arisen under domestication.
Figure 1.
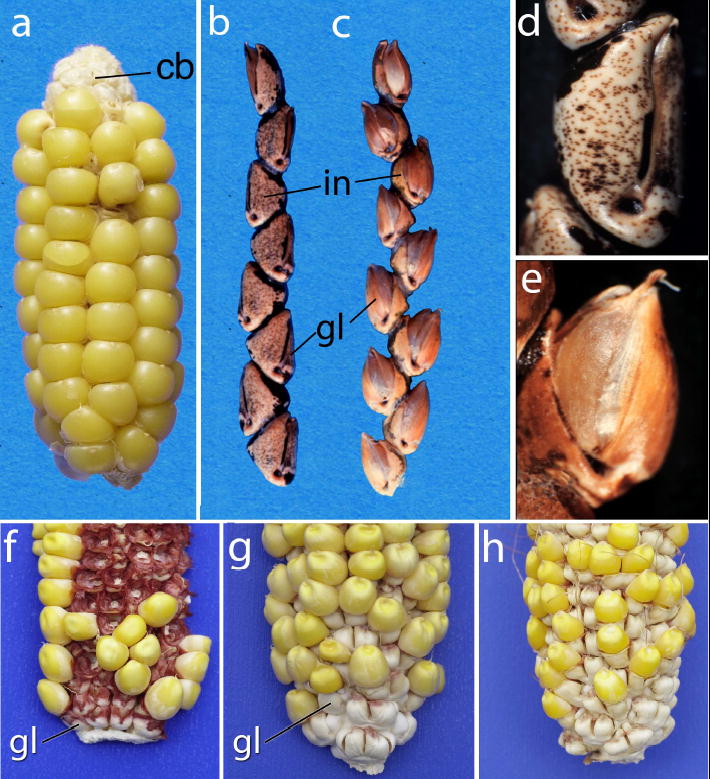
Phenotypes. a. Maize ear showing the cob (cb) exposed at top. b. Teosinte ear with the rachis internode (in) and glume (gl) labeled. c. Teosinte ear from a plant with a maize allele of tga1 introgressed into it. d. Close-up of a single teosinte fruitcase. e. Close-up of a fruitcase from teosinte plant with a maize allele of tga1 introgressed into it. f. Ear of maize inbred W22 (Tga1-maize allele) with the cob exposed showing the small white glumes at the base. g. Ear of maize inbred W22:tga1 which carries the teosinte allele, showing enlarged (white) glumes. h. Ear of maize inbred W22 carrying the tga1-ems1 allele, showing enlarged glumes. For higher magnification copies of f–h see Supplementary Information.
Each of the 5 to 12 cupulate fruitcases in a teosinte ear is formed from an invaginated internode (cupule) within which the kernel sits, and a glume that covers the opening of the cupule such that the kernel is completely hidden from view (Figure 1b, d). When mature, the teosinte ear disarticulates into the individual fruitcases, each of which contains one kernel. The fruitcase functions to protect the kernel from predation, and the fruitcase passes unscathed through the digestive tracks of animals, providing a means of biotic seed dispersal6. At maturity, teosinte fruitcases are heavily lignified and the epidermal cells are filled with silica, giving the fruitcase a stony appearance7. Cupules and glumes are present in maize, but reduced in size relative to the kernel such that they do not surround the kernel. In maize, these organs form the central cob of the ear to which the kernels are attached (Figure 1a). Maize glumes are less lignified and contain less silica than their teosinte counterparts7. Thus, maize domestication involved a change in ear development such that the cupules and glumes form the internal axis of the ear, rather than casings around the kernels. In a sense, maize domestication involved turning the teosinte ear inside-out.
Genetic control of the differences in fruitcase/ear structure between maize and teosinte was previously shown to involve a single quantitative trait locus (QTL) of large effect plus several QTL of smaller effect8. The large effect QTL segregates as a single Mendelian locus in isogenic background, and has been designated tga1 (ref. 1); however, whether tga1 represents a single gene or a complex locus consisting of multiple linked genes remained unknown. In teosinte genetic background, the maize allele (Tga1-maize) causes a reduction in internode invagination such that the cupule is too small to house the teosinte kernel, which becomes exposed on the surface of the teosinte ear (Figure 1c, e). In maize background, the teosinte allele (tga1-teosinte1) causes an enlargement of the cupule and glume (Figure 1f, g). Moreover, the teosinte allele causes the epidermal cells of the cupule and glume to be filled with silica, a feature that accounts for the hardness of the teosinte cupulate fruitcase7. The teosinte allele also produces a thicker layer of lignified cells in the glume. The multiple effects on cupule development, the 3-dimensional growth of the glume, lignification, and silica deposition, suggest that tga1 acts as a regulatory gene at the head of a developmental cascade7.
We employed the maize genetic map, physical maps for maize inbreds B73 and Mo17, and the rice physical map to develop a set of molecular markers near tga1 (see Supplementary Information). Starting with marker npi316 on maize chromosome 4 (ref. 1), which is tightly linked to tga1, we screened maize BAC libraries and identified a BAC contig near tga1. We used BAC end and other sequences from this contig to BLAST the rice genome, and thereby identified a region on rice chromosome 8 that is collinear with the region near tga1 on maize chromosome 4. Subsequent BLAST searches using the collinear rice sequence identified a second maize contig near tga1. DNA sequence analysis revealed that the two maize contigs overlap, enabling us to assemble a single supercontig of ~1.5 megabases. We used markers within this supercontig and determined that tga1 was located within the supercontig (Supplementary Methods).
To fine map tga1, we screened 3106 F2 plants segregating for tga1 with markers b91.k20 and umc1511, and scored the plants for the tga1 trait (Figure 2a). Marker b91.k20 is located at one end of the supercontig, and umc1511 is located off the other end of the supercontig. Plants possessing cross-overs between these two markers were assayed for marker be25.a15, which is at the opposite end of the supercontig from b91.k20. These data confirmed that tga1 lies between b91.k20 and be25.a15. Markers from within the supercontig were placed on our genetic and physical maps, enabling us to map tga1 to BAC c126f15. Markers within this BAC enabled us to map tga1 to a ~6 kb segment between bnlg252 and bm22.7. Since this ~6 kb region encompassed 7 additional recombination events, we were able to further map the element that controls the difference between the maize and teosinte phenotypes to a 1042 bp segment between snp-1024 and snp+18.
Figure 2.

The tga1 locus. a. Map of the chromosomal segment at tga1 with marker loci used for positional cloning. Hatched boxes are the three exons of tga1. Red box is the 1042 bp segment to which the factor controlling the difference between maize and teosinte was mapped. Seven of the 3106 plants with cross-overs in tga1 are shown along with their phenotypes and genotypes (light gray bar: homozygous maize; medium gray bar: heterozygous; black bar: homozygous teosinte). For details on marker loci see supplemental information. b. The tga1 protein sequence aligned with its rice counterpart. Identical amino acids are in black background and similar ones in gray. Blue bar indicates the SBP domain, green triangles indicate the intron positions. The fixed amino acid difference between teosinte and maize (K→N) is highlighted in red. The position of the L→F amino acid change for the tga1-ems1 allele is marked with an asterisk.
BLAST searches using the 6 kb region at tga1 revealed that it has homology to SBP transcriptional regulators2. Although there are no maize ESTs that closely match this region, we identified matching ESTs from other cereals including one from rice (AK109469) that maps to the collinear region on rice chromosome 8 discussed above. Based on their homologous sequences and collinear chromosomal locations, AK109469 is likely the rice ortholog of tga1. We aligned this rice EST with the maize genomic sequence and identified three exons in maize that match those of rice with putatively conserved start and stop codons (Figure 2b). We designed primers based on the maize sequence corresponding to the 3′ and 5′ non-translated regions of the rice EST. RT-PCR with total RNA isolated from maize ears gave a single product of the expected size based on the rice EST. The RT-PCR product was sequenced, confirming that it matched the maize genomic sequence and that it contains two introns in the same positions as rice (Figure 2b). The open reading frame encodes a putative protein of 432 amino acids that is 58% identical and 66% similar to the rice EST (Figure 2b).
We used another tga1 allele (tga1-ems1) that was generated by ethyl methanesulfonate mutagenesis of maize line W22 to confirmed that the SBP-domain gene just described is tga1 (Supplemental Methods). Plants homozygous for tga1-ems1 (Figure 1h) match the phenotype of the teosinte allele, although phenotypic expression of tga1-ems1 seems more environmentally labile than tga1-teosinte1. DNA sequence analysis of the SPB gene for the tga1-ems1 stock revealed that it differs from its parental (W22) allele by a non-conservative amino acid substitution of a phenylalanine for a leucine at position 5 (Figure 2b). This lesion in the tga1-ems1 allele confirms our conclusion from the positional cloning that tga1 is the SBP gene, and it demonstrates that a single amino acid substitution is sufficient to confer the difference between the maize and teosinte phenotypes.
The functional difference between the maize and teosinte alleles of tga1 could result from differences in gene expression or the tga1 protein. To investigate the former possibility, we used a combination of Northerns, in situ hybridization and real-time PCR with maize inbred W22, an isogenic version of W22 (W22:tga1) that carries a teosinte allele at tga1, and teosinte itself. Northern analysis revealed that tga1 is expressed relatively strongly in immature ears and weakly in husks, but tga1 expression was not detected in the other tissues examined (Figure 3a). The message levels for immature ears with the maize vs. teosinte allele appeared equivalent. To confirm equivalent expression for the maize and teosinte alleles, we used real-time PCR which indicates that relative tga1 messages levels for the maize (0.79±0.06) and teosinte (0.85±0.06) alleles are indeed statistically equivalent (t-test = 0.65, P=0.37).
Figure 3.

Molecular analysis of tga1. a. Top panel is a Northern blot showing that tga1 is expressed in immature ears of W22 maize (M) and W22:tga1 (T) which carries the teosinte allele. Weak expression is also visible in the husks (HK). No expression of tga1 is seen in root (RT), prop root (PR), unexpanded leaf (LF) or immature tassel (TS). Lower panel is the ethidium bromide stained gel with the visible rRNAs confirming approximately equal loading of total RNA in each lane. b. Western blots showing that the protein encoded by the teosinte allele of tga1 accumulates at a higher level than the protein of the maize allele. Blots probed with either anti-TGA1 or anti-ACTIN (control) antibodies. Protein was extracted from individual ears of W22 maize (M) carrying a maize allele and W22:tga1 (T) carrying a teosinte allele. Immature ears were staged by their lengths which are indicated in mm.
We also compared the expression patterns of the maize and teosinte alleles using in situ hybridization. In the maize inbred W22, tga1 is expressed in the inflorescence meristem of the developing ear and the spikelet pair primordia (Figure 4a). tga1 is also expressed in the spikelet primordia including the glume primordia (Figure 4e). In older spikelet primordia, tga1 expression is seen in glumes, lemma, lower floret, and other floral organs (Figure 4i). We observed weak but distinct expression throughout the immature ear that is easily discerned if one compares results with the antisense probe (Figure 4a, e, i) to those with sense controls (Figure 4d, h, l). We also observed a band of tga1 expression at the adaxial junction of the spikelet and the inflorescence axis, the region of the inflorescence that develops into the cupule (Figure 4i).
Figure 4.
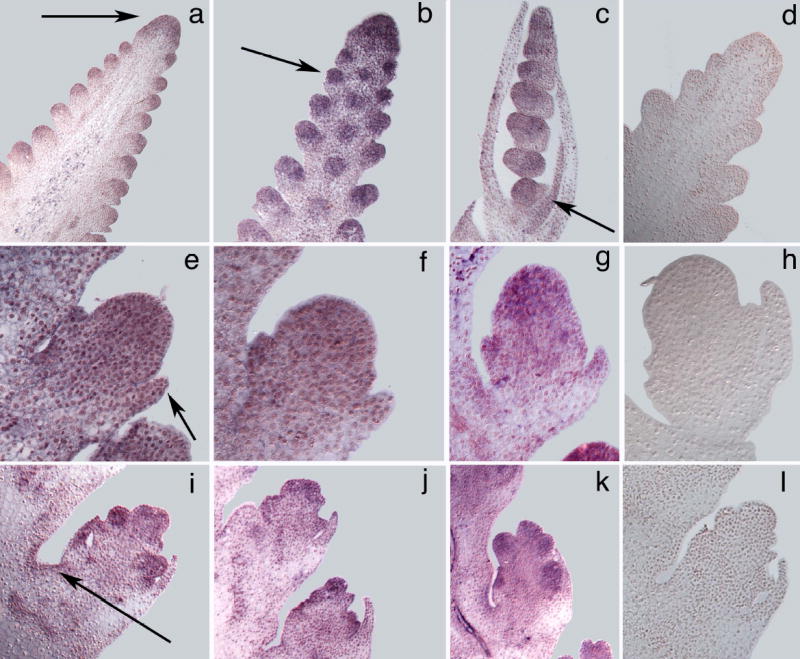
Tissue in situ hybridizations. a–d, Immature ears. e–h, Young spikelet primordia. i–l, Older spikelet primordia with distinct floral organ primordia. tga1 antisense probe was applied to W22 maize (a, e, i), W22:tga1 (b, f, j), and teosinte (c, g, k). tga1 sense probe was applied to W22 as a control (d, h, l). Arrows show tga1 expression in the inflorescence meristem (a), spikelet-pair primordium (b), teosinte husk (c), glume (e), and cupule forming region (i).
When we compared the pattern of tga1 expression seen in W22 to that in W22:tga1 or teosinte itself, we observed no clear differences. In W22:tga1, expression is observed in the inflorescence meristem, spikelet pair meristems, glumes, cupule forming region, and other floral organs (Figure 4b, f, j). Similarly, in teosinte, we observed the same spatial pattern of expression (Figure 4c, g, k). Teosinte also shows expression in the husk leaf that subtends the ear (Figure 4c), consistent with the weak expression seen in maize husks (Figure 3a). Overall, we do not see any quantitative nor qualitative differences in tga1 expression between the isogenic lines, W22 and W22:tga1, or between the maize inbred W22 and teosinte itself. Our expression analyses cannot rule out the existence of some complex or subtle difference in expression such as prolonged expression throughout later development for one genotype; however, the absence of any discernible difference, suggests that differences between the maize and teosinte proteins may be critical to phenotype.
Our genetic analyses narrow the location of the causative site for the functional difference between maize and teosinte to the 1042 bp segment described above. DNA sequence analysis of this 1042 bp segment using 16 diverse maize and 12 teosinte individuals identified six fixed differences between maize and teosinte. Five of these six are single base-pair polymorphisms that lie just 5′ of the coding sequence and potentially affect tga1 expression. The sixth difference encodes an amino acid substitution of lysine (K) in teosinte to asparagine (N) in maize at position 6 (Figure 2b). Several observations suggest that this amino acid substitution is the causative site. First, we observed no differences in the level of tga1 message accumulation between the isogenic lines for the maize and teosinte alleles. Second, we observed no differences in the pattern of tga1 expression between these same isogenic lines, and teosinte itself shows a parallel pattern of tga1 expression to that observed in maize. Third, the lysine observed in teosinte at position 6 is conserved between rice, wheat (CK207354) and teosinte, suggesting it is important to protein function or stability. Fourth, the EMS mutant allele that we recovered alters the amino acid adjacent to the maize-teosinte fixed amino acid difference (Figure 2b), indicating that this region of the protein is critical and that an amino acid change here is sufficient to distinguish the maize and teosinte phenotypes.
We tested whether there is a difference in tga1 protein abundance associated with the maize and teosinte alleles by western analysis and observed that the protein encoded by the teosinte allele is more abundant over a range of developmental stages (Figure 3b). Given this result, a difference in protein abundance may underlie the phenotypic differences. Perhaps, the K→N substitution alters protein stability, although it may also affect translation efficiency or protein function. One could argue that the difference in protein level is caused by one or more of the five promoter SNP and that these SNP are the causative site(s). However, given that the teosinte and EMS alleles share amino acid changes at adjacent sites and these alleles cause nearly the same phenotype, we believe that the K→N substitution is the more probable candidate for the causative site when considering all of the evidence.
If tga1 was the target of selection during maize domestication, then the signature of past selection may be evident in its level of DNA sequence polymorphism. We analyzed sequence variation across tga1 for diverse samples of maize and teosinte (Z. mays ssp. parviglumis). Three expectations of past selection were assessed. First, we estimated the ratio of nucleotide diversity (π) in maize to that in teosinte. Selection during maize domestication will reduce this ratio9. Second, we calculated Tajima’s D-statistic10, which measures whether there is an excess of low frequency polymorphic sites. Such an excess is expected in the wake of a recent selective sweep and will cause a negative D-statistic. Third, we applied the HKA test11, which assesses the ratio of diversity in the focal species (maize) to divergence from an outgroup (Z. diploperennis) for a target gene (tga1) relative to one or more control (neutral) genes.
The tga1 promoter region shows strong evidence of a past selective sweep with a significant Tajima’s D and highly significant HKA test (Figure 5a). Furthermore, the ratio of πmaize/πparviglumis indicates that maize possesses only 5% of the diversity found in parviglumis teosinte, which is far below the 60–80% level observed for neutral genes9,12 and nearly as low as the level observed in the 5′ regulatory region of tb1, another maize domestication gene13. The first exon shows modest evidence for past selection with a significant HKA test, a πmaize/πparviglumis ratio of 27%, and a negative but not significantly negative D-statistic. In contrast, both exons 2 and 3 show neutral patterns of sequence diversity, indicating that the effect of the selective sweep does not extend across the entire gene (Figure 5a). The stronger evidence for selection in the promoter than in the exon 1 seems inconsistent with the inference that the causative site is the K→N substitution in exon 1; however, the putative selected site is essential at the promoter-exon 1 border, thus promoter diversity should be affected by selection on this site. Moreover, the promoter has high diversity in teosinte, while exon 1 has low diversity in teosinte. This difference means that there is more statistical power to obtain a significant test in the promoter than in exon 1.
Figure 5.

Molecular evolution. a, Nucleotide diversity (π) in maize and teosinte for tga1. Tajima’s D and HKA tests for non-neutral evolution and the ratio of π in maize to π in teosinte are shown. b, Joint distribution of the posterior probabilities (scale from white to black) for the time since fixation of the maize allele in generation (Tgen) and the selection coefficient (s).
We also applied two approaches that model a selective sweep using the coalescent. First, we used the method of Kim and Stephan14, which calculates the likelihood ratio for a selective sweep vs. a neutral model and provides an estimate of the strength of selection (2Ns). This analysis indicated that 2Ns=9232, a value which would be observed under neutral evolution exceedingly rarely (P<0.0001). Second, we used the method of Przeworski15, which provides an estimate of the time since fixation of a beneficial allele (T=Tgen/4N), which will be <0.2 in the case of a recent selective sweep. For tga1, the mode of the distribution of simulated values of T is ~0.021 and over 99.7% of the simulation values are ≤0.2, providing strong support for a recent selective sweep. This latter method also provides a joint posterior distribution of the selection coefficient (s) and the time in generations since the fixation of the favored allele (Tgen=4NT). When the population size (N) is set to 100,000, this distribution suggests a selection coefficient of 3–4% and a time since fixation of the favored allele of ~10,000 years for tga1 (Figure 5b).
Our results demonstrate that complex differences between the cob that bears the naked grains of maize and the hardened fruitcases that surround the kernels of teosinte are regulated by a single gene, tga1, and it is possible that just a single amino acid change within this gene is responsible. Exactly how tga1 regulates ear development remains to be learned. One interpretation is that like many other developmental genes in plants, tga1 regulates organ identity. The glumes and internodes of the teosinte ear are exceptional among grasses for their degree of lignification and the presence of silica in all epidermal cells. The glumes of the maize ear are more leaf-like and closer in morphology to the glumes of other grasses7. In teosinte therefore, tga1 may both activate the developmental processes to produce the hardened glumes and invaginated internodes of teosinte, as well as repress a default developmental program for the leaf-like identity of glumes and solid internodes found in other grasses.
The domestication of maize has been a topic long surrounded by controversy. Mangelsdorf and Reeves5 argued that teosinte could not be the progenitor of maize because the morphological differences between maize and teosinte were so vast that the underlying genetic steps could not have arisen during the few thousand years in which maize was domesticated. Thus, they argued that maize evolved in nature over a long evolutionary period. Their assertions were challenged by Beadle16 who contended that mutations of large effect in a small number of genes would be sufficient to convert teosinte into a useful grain crop. Our results with tga1 confirm Beadle’s interpretation that simple mutations in single genes contributed major morphological steps in maize domestication.
While progress has been made in identifying genes involved in crop domestication, identifying the specific polymorphisms controlling domesticated phenotypes has proved elusive. Regulatory changes in the fw2.2 gene appear to control a major portion of the difference in fruit weight between wild and cultivated tomatoes17, however, the specific regulatory elements involved have not yet been pinpointed. Similarly, regulatory changes in the tb1 gene have been suggested as controlling the difference in plant architecture between maize and teosinte13,18, but again the specific regulatory changes remain unknown. For tga1, we have identified a set of six SNP, one or some combination of which represent the causative site(s). Based on the available evidence, our preferred hypothesis is that the K→N substitution controls the phenotypic difference between maize and teosinte.
A feature of all domestication genes that have been identified to date is that the “cultivated” allele is also found at moderate frequencies in the wild progenitor. This is true of fw2.2 in tomato19, tb1 in maize13, and BoCal in broccoli20. Thus, the evolution of fruit weight in tomato, plant architecture in maize, and inflorescence structure in broccoli all fit a model of human selection acting upon standing allelic variation that preexisted in the wild progenitor. In contrast, tga1 may represent a case of new mutation (or at least a rare variant) since we failed to find the maize allele in teosinte by our sequence diversity analysis.
Charles Darwin21 utilized evolution under artificial selection (domestication) as a model for evolution under natural selection. Domestication genes, like tga1, can provide appropriate models for genes that control key innovations that differentiate natural species. In this context, several features of tga1 are notable. First, tga1 represents a single major gene that controls a profound morphological step in maize evolution, and thereby provides support for the view that major gene changes can and do contribute to the origin of evolutionary novelties22. Second, the argument that major gene changes are unlikely because they are typically accompanied by deleterious pleiotropic effects23 does not apply to tga1. Rather, the teosinte allele provides for a fully formed cupulate fruitcase that protects the kernel in the natural environment, while the maize allele allows an exposed kernel to be used as food by humans as part of a mutualistic relationship. The lack of deleterious pleiotropic effects associated with tga1 can be readily explained by the modular nature of maize (plant) development. tga1 is expressed in the ear, but not elsewhere in the plant. Thus, changes in tga1 will not have pleiotropic effects on roots, leaves, stalk, and tassel, facilitating ear specific modifications in function. Finally, the nature of the functional differences in tga1 between maize and teosinte are simple, no more than 6 bp substitutions and perhaps just a single amino acid change. Our observations strengthen the argument that large phenotypic effects can be caused by very simple molecular changes during domestication or evolution.
Methods
Genetic Mapping
A W22 × W22:tga1 F2 fine-mapping population of 3106 plants, which segregated for Tga1-maize vs. tga1-teosinte1, was generated by self-pollinating F1 hybrids of the parental stocks. This population was screened with markers b91.k20 and umc1511 that flank tga1. Plants with crossovers between these two markers were screened with additional markers located between b91.k20 and umc1511. Phenotypes of F2 plants with cross-overs between markers b91.k20 and be25.a15 were scored by visual inspection of mature ears. Although Tga1-maize is visually dominant to tga1-teosinte1, the heterozygous class is distinct and intermediate between the two homozygous classes7, and thus we were able to fully classify the plants into three phenotypic classes. For a complete list of the marker loci, primer sequences, PCR conditions, and gel conditions see Supplementary Information.
Nucleic acid analyses
After genetic mapping demonstrated that tga1 lies within the BAC c126f15, we shotgun sequenced it to 7X coverage (see Supplementary Information). This work produced a final assembly of ~169 kb in length (AY883559). BLAST (www.ncbi.nlm.nih.gov) searches identified a match between the ~6 kb region between bnlg252 and bm22.7 to which tga1 was mapped and the rice EST AK109469. We used this rice EST and the corresponding maize genomic sequence as guides to predict the location of the intron-exon boundaries of tga1. We confirmed that the predicted maize gene is expressed by RT-PCR. One μg of total RNA from young W22 ears was reverse-transcribed using Superscript III (Invitrogen) and a tga1-specific primer. We then performed PCR with primers that amplify a region from 31 bp 5′ of the putative start codon to 99 bp 5′ of the predicted stop codon. The PCR product was sequenced to verify gene structure (Genbank AY883560). We isolated and sequenced the exons and 5′ non-transcribed region of Tga1-maize, tga1-teosinte1 and tga1-ems1 alleles (Genbank AY883560-AY883568) by PCR. For primers, PCR and sequencing conditions see Supplementary Information.
Gene expression assays
Total RNA was isolated from immature ears (2–3 cm in length) and other tissues using TRI reagent (Molecular Research Center). Northern blots with ~12 μg total RNA of each sample per lane followed standard procedures (see Supplementary Information). cDNA for real-time PCR was produced using 1 μg of total RNA isolated from 16 immature ears each of W22 and W22:tga1. Immature ears were developmentally staged by measuring ear length to insure that both the W22 and W22:tga1 genotypes were represented by developmentally equivalent samples, 27 mm ± 0.9 and 28 mm ± 0.9, respectively. RNA was treated with amplification grade DNaseI (Invitrogen) and then reversed transcribed into cDNA with random hexamers using Taqman Reverse Transcription Reagent Kit (Applied Biosystems). Maize Beta-tublin2 (Genbank X52879) was selected as an endogenous control for PCR quantification. Two replicates were analyzed for each of the 32 samples. For further details about tissue samples, reaction conditions, and primer and probe sequences see Supplementary Information.
Methods for preparing tissue samples and in situ hybridization with digoxigenin-labeled RNA probes followed procedures described elsewhere24. A tga1 891 bp RT-PCR fragment that excluded the SBP-domain and included 80 bp of the 3′ UTR was amplified using PCR and cloned into pGEM-T vector (Promega). Two plasmids with different insert orientations were isolated and linearized using SpeI, and then used as templates to generate anti-sense/sense probes. Probes were synthesized by T7 RNA polymerase with the DIG RNA labeling Kit (Roche).
Protein assay
The 3′ end of tga1 excluding the SBP-box was amplified by PCR from a tga1 RT-cDNA clone (Supplemental Methods). The PCR fragment was cloned into pET151/D-TOPO vector (Invitrogen) and transformed into BL21 codonPlus (DE3)-RIPL cells (Stratagene). The Histag-TGA1 (amino acids 181–432) fusion protein was purified using a His-bind purification kit (Novagen). After a further purification by SDS-PAGE gel, the TGA1 fusion protein was used as an antigen to generate rabbit polyclonal anti-TGA1 antibody (Invitrogen). The specificity of the antibody to TGA1 was tested by Western blot analysis.
Protein from immature maize ears (9 mm to 22 mm in length) was extracted using a plant total protein extraction kit (Sigma). Protein concentrations were determined by protein assay using Quick Start Bradford dye regent (Bio-Rad). For each ear sample, 25 μg of protein was loaded into a 10% SDS-PAGE gel and transferred to immoblion-P membrane (Millipore) using a mini trans-blot cell (Bio-Rad). The blot was probed with anti-TGA1 primary antibody and then affinity purified HRP-conjugated goat anti-rabbit secondary antibody (Kirkegaard & Perry Laboratory). Immune-Star HRP substrate (Bio-Rad) was added and the chemiluminescent signal on the blots was detected with X-ray film. The blots were re-probed with an anti-ACTIN (sc-1616R) antibody (Santa Cruz Biotechnology) as a loading control.
Molecular evolution
We sequenced the tga1 promoter and coding regions for a set of 16 diverse landraces of maize and 12 teosinte individuals (Z. mays ssp. parviglumis) and the outgroup Zea diploperennis (Genbank AY883436-AY883558) using the PCR primers (Supplementary Information). PCR products from Z. diploperennis were cloned into the TA vector (pCR 2.1-TOPO kit, Invitrogen) and at least four clones were sequenced. Nucleotide diversity (π), and Tajima’s D statistic10, and the Hudson-Kreitman-Aguadé (HKA) tests11 were calculated in DnaSP Version 4.0 (ref. 25). For the HKA tests, Z. diploperennis was used as the outgroup and adh1, adh2, glb1, and te1 as control loci9,12. The overall HKA P-value was obtained by summing the individual χ2 values for the four control genes.
Supplementary Material
Acknowledgments
We thank David Baum and Jonathan Wendel for comments, Richard Clark for helpful discussions; Evgueni Ananiev, Kevin Fengler, and Michele Morgante for help with screening and identifying BAC contigs; the DuPont sequencing group for BAC sequencing; and Peter Rose for assistance with genetic mapping. This research was supported in part by grants from the National Institutes of Health and the U.S.D.A. Hatch program (to J.F.D.), a Howard Hughes Medical Institute predoctoral fellowship (to K.B.), and an Environmental Protection Agency predoctoral fellowship (to L.L).
Footnotes
Supplementary Information accompanies this paper on www.nature.com/nature
References
- 1.Dorweiler J, Stec A, Kermicle J, Doebley J. Teosinte glume architecture1: A genetic locus controlling a key step in maize evolution. Science. 1993;262:233–235. doi: 10.1126/science.262.5131.233. [DOI] [PubMed] [Google Scholar]
- 2.Klein J, Saedler H, Huijser P. A new family of DNA binding proteins includes putative transcriptional regulators of the Antirrhinum majus floral meristem identity gene SQUAMOSA. Mol Gen Genet. 1996;250:7–16. doi: 10.1007/BF02191820. [DOI] [PubMed] [Google Scholar]
- 3.Doebley J. The genetics of maize evolution. Annu Rev Genet. 2004;38:37–59. doi: 10.1146/annurev.genet.38.072902.092425. [DOI] [PubMed] [Google Scholar]
- 4.Maynard Smith J. Macroevolution. Nature. 1981;289:13–14. doi: 10.1038/289013a0. [DOI] [PubMed] [Google Scholar]
- 5.Mangelsdorf PC, Reeves RG. The origin of maize. Proc Natl Acad Sci USA. 1938;24:303–312. doi: 10.1073/pnas.24.8.303. [DOI] [PMC free article] [PubMed] [Google Scholar]
- 6.Wilkes, H. G. Teosinte: The closest relative of maize. (Bussey Institution of Harvard University, Cambridge, MA, 1967).
- 7.Dorweiler J, Doebley J. Developmental analysis of teosinte glume architecture1: a key locus in the evolution of maize (Poaceae) Amer J Bot. 1997;84:1313–1322. [PubMed] [Google Scholar]
- 8.Doebley J, Stec A. Inheritance of the morphological differences between maize and teosinte: comparison of results for two F2 populations. Genetics. 1993;134:559–570. doi: 10.1093/genetics/134.2.559. [DOI] [PMC free article] [PubMed] [Google Scholar]
- 9.Tenaillon MI, U’Ren J, Tenaillon O, Gaut BS. Selection versus Demography: A multilocus investigation of the domestication process in maize. Mol Biol Evol. 2004;21:1214–1225. doi: 10.1093/molbev/msh102. [DOI] [PubMed] [Google Scholar]
- 10.Tajima F. Statistical method for testing the neutral mutation hypothesis by DNA polymorphism. Genetics. 1989;123:585–595. doi: 10.1093/genetics/123.3.585. [DOI] [PMC free article] [PubMed] [Google Scholar]
- 11.Hudson RR, Kreitman M, Aguade MA. test of neutral molecular evolution based on nucleotide data. Genetics. 1987;116:153–159. doi: 10.1093/genetics/116.1.153. [DOI] [PMC free article] [PubMed] [Google Scholar]
- 12.White SE, Doebley JF. The molecular evolution of terminal ear1, a regulatory gene in the genus Zea. Genetics. 1999;153:1455–1462. doi: 10.1093/genetics/153.3.1455. [DOI] [PMC free article] [PubMed] [Google Scholar]
- 13.Clark RM, Linton E, Messing J, Doebley JF. Pattern of diversity in the genomic region near the maize domestication gene tb1. Proc Natl Acad Sci USA. 2004;101:700–707. doi: 10.1073/pnas.2237049100. [DOI] [PMC free article] [PubMed] [Google Scholar]
- 14.Kim Y, Stephan W. Detecting a local signature of genetic hitchhiking along a recombining chromosome. Genetics. 2002;160:765–777. doi: 10.1093/genetics/160.2.765. [DOI] [PMC free article] [PubMed] [Google Scholar]
- 15.Przeworski M. Estimating the time since the fixation of a beneficial allele. Genetics. 2003;164:1667–76. doi: 10.1093/genetics/164.4.1667. [DOI] [PMC free article] [PubMed] [Google Scholar]
- 16.Beadle GW. Teosinte and the origin of maize. J Hered. 1939;30:245–247. [Google Scholar]
- 17.Cong B, Liu J, Tanksley SD. Natural alleles at a tomato fruit size quantitative trait locus differ by heterochronic regulatory mutations. Proc Natl Acad Sci USA. 2002;99:13606–13611. doi: 10.1073/pnas.172520999. [DOI] [PMC free article] [PubMed] [Google Scholar]
- 18.Doebley J, Stec A, Hubbard L. The evolution of apical dominance in maize. Nature. 1997;386:485–488. doi: 10.1038/386485a0. [DOI] [PubMed] [Google Scholar]
- 19.Nesbitt TC, Tanksley SD. Comparative sequencing in the genus Lycopersicon. Implications for the evolution of fruit size in the domestication of cultivated tomatoes. Genetics. 2002;162:365–379. doi: 10.1093/genetics/162.1.365. [DOI] [PMC free article] [PubMed] [Google Scholar]
- 20.Purugganan MD, Boyles AL, Suddith JI. Variation and selection at the CAULIFLOWER floral homeotic gene accompanying the evolution of domesticated Brassica oleracea. Genetics. 2000;155:855–862. doi: 10.1093/genetics/155.2.855. [DOI] [PMC free article] [PubMed] [Google Scholar]
- 21.Darwin, C. On The Origin of Species by Means of Natural Selection (John Murray, London, 1859).
- 22.Gottlieb LD. Genetics and morphological evolution in plants. Amer Naturalist. 1984;123:681–709. [Google Scholar]
- 23.Lande R. The response to selection on major and minor mutations affecting a metrical trait. Heredity. 1983;50:47–65. [Google Scholar]
- 24.Jackson, D. in Plant Molecular Pathology: A Practical Approach (eds. Gurr, S. J., McPherson, M. J. & Bowles, D. J.) 163–174 (Oxford University Press, Oxford, 1992).
- 25.Rozas J, Rozas R. DnaSP version 3: an integrated program for molecular population genetics and molecular evolution analysis. Bioinformatics. 1999;15:174–175. doi: 10.1093/bioinformatics/15.2.174. [DOI] [PubMed] [Google Scholar]
Associated Data
This section collects any data citations, data availability statements, or supplementary materials included in this article.