Abstract
Previous reports that investigated the regulation of the NO/soluble guanylyl cyclase (sGC)/cGMP pathway by estrogenic compounds have focused primarily on the levels of NO, NO-producing enzymes, and cGMP in various tissues. In this study, we demonstrate that 17β-estradiol (E2) regulates the α1 and β1 subunits of the NO receptor, sGC, at the mRNA and protein levels in rat uterus. Using real-time quantitative PCR, we found that within 1 h of in vivo E2 administration to rats, sGC mRNA levels begin to diminish. After 3 h, there is a maximal diminution of sGC mRNA expression (sGC α1 10% and sGC β1 33% of untreated). This effect was blocked by the estrogen receptor antagonist, ICI 182,780, indicating that estrogen receptor is required. The effect of E2 also was observed in vitro with incubations of uterine tissue, indicating that the response does not depend on the secondary release of other hormones or factors from other tissues. Puromycin did not block the effect, suggesting the effects occur because of preexisting factors in uterine tissues and do not require new protein synthesis. Using immunoblot analysis, we found that sGC protein levels also were reduced by E2 over a similar time course as the sGC mRNA. We conclude that sGC plays a vital role in the NO/sGC/cGMP regulatory pathway during conditions of elevated estrogen levels in the rat uterus as a result of the reduction of sGC expression.
Keywords: nitric oxide, gene regulation, steroid hormone
The steroid hormone 17β-estradiol (E2) exhibits dramatic effects in the uterus with respect to hyperemia, gene expression, and proliferation of the endometrium. It is clear that there is a wide array of changes in the expression of multiple genes and biochemical processes within the uterus after E2 exposure. However, as a whole, it is unclear how these responses mediate the hyperemic and subsequent proliferative response of the uterine tissue.
To understand how these processes are regulated is essential, because normal physiological, pathological, and pharmacological estrogenic responses are common. For instance, the levels of estrogen are tightly regulated and mediate uterine quiescence and initiation of labor during pregnancy (1). In addition, estrogen levels fluctuate during the estrous cycle of mammals and the menstrual cycle of primates, which mediate the endometrial growth cycle (2). Postmenopausal women frequently are administered estrogen supplements in hormone replacement therapy regimens to reduce the loss of bone mass associated with menopause. Furthermore, use of the anti-estrogen, tamoxifen, for treating breast cancer results in paradoxical estrogenic effects in the uterus (3). Finally, both men and women are exposed to low levels of phyto-estrogens on a daily basis, dependent on dietary and environmental intake (4).
Reports indicate that estrogens regulate the NO/soluble guanylyl cyclase (sGC)/cGMP cell signaling pathway and the levels of NO and the second messenger, cGMP, in many tissues, including the uterus. Recent and past studies have investigated the levels of the various players within this pathway in the uterus, in hopes of understanding how they participate in the above-mentioned physiological and pathological states. For example, after E2 administration and during elevated estrogen levels during pregnancy, the enzymes that produce NO are activated in the uterus (1, 5–7). In addition, levels of cGMP either rise or fall in response to E2, depending on the experimental conditions and/or length of administration or stage of pregnancy or estrous cycle (1, 8–10).
sGC is a heme-containing cytosolic cGMP-generating receptor. Many of the NO-dependent cell signaling events that regulate important physiological processes are mediated through activation of sGC. NO is synthesized by the three isoforms of NO synthases (nNOS, iNOS, eNOS, or NOS 1, 2, and 3, respectively; ref. 11). NO then can diffuse freely and bind to sGC, enhancing the production of cGMP and subsequently stimulating cGMP targets, such as cGMP-dependent protein kinases, cyclic nucleotide phosphodiesterases, and ion channels (12–14).
sGC consists of two subunits, α and β, which make up the active heterodimeric enzyme (15). At least two mammalian isoforms for each subunit (α1/α2 and β1/β2) have been identified and are expressed in a tissue-specific manner (16). Both isoforms for each subunit have been cloned and sequenced in human, rat, and bovine (17–21). The α1/β1 sGC heterodimer appears to be the most abundantly expressed and widely distributed sGC holoenzyme. Previously, we cloned and sequenced the mouse sGC α1 and β1 isoforms and subsequently determined their genomic organization and chromosomal localization in an effort to help us elucidate how sGC is regulated (22).
Earlier studies have neglected to examine the regulation of the NO receptor, sGC, at the mRNA and protein levels in response to E2 in the uterus. In this report, we used immature rats to determine whether E2 regulates the mRNA and protein levels of the sGC subunits. We report that E2 has a rapid and profound effect on uterine sGC α1 and β1 isoforms in this model system, which is well characterized to study estrogenic regulation of gene expression in vivo.
Materials and Methods
Animals and Treatments.
Immature female Sprague–Dawley rats (21 days old, 40–45 g; Sasco, Omaha, NE) were either nonovariectomized, purchased ovariectomized, or ovariectomized on arrival; and ovariectomized animals were allowed to recover 4 days before treatments. Animals were given tap water and fed Purina rat chow (no. 5001) ad libitum, with a 12:12 h light/dark cycle. All procedures were approved by the University of Texas–Houston Health Science Center Animal Welfare Committee and are in accordance with the guidelines of the National Institutes of Health.
Animals were injected s.c. (as described previously) in the periscapular region with various hormones (23). Unless otherwise indicated (dose–response), the dose of E2 was 40 μg/kg body weight, whereas the doses of other hormones were as follows: dexamethasone, 600 μg/kg; 5α-dihydrotestosterone, 400 μg/kg; and progesterone, 40 mg/kg (Sigma). For other experiments, animals were treated i.p. (as described previously) with either ICI 182,780 (2 mg/kg; Tocris Neuramin, Bristol, U.K.) or puromycin (100 mg/kg; Sigma) 30 min before the administration of 40 μg/kg E2 (23, 24).
Determination of Uterine sGC α1 and β1 mRNA Levels in Vitro.
Animals were killed and uterine tissues were immediately removed and placed into glass vials containing 1 ml of pregassed (95% O2/5% CO2 at 37°C) phenol red-free DMEM/F-12 medium (GIBCO; supplemented with 100 units/ml penicillin and 100 μg/ml streptomycin) either with or without 10 nM E2. All vials then were gassed with 95% O2/5% CO2, sealed, and incubated for 3 h in a 37°C shaking water bath.
RNA Preparations.
Tissues were removed from killed animals or glass vials and immediately homogenized in Ultra Spec RNA Isolation Solution (Biotecx Laboratories, Houston) to obtain total RNA preparations. After isolation, total RNA from tissues was spectrophotometrically quantified at 260 nm. For Northern analysis, total RNA from three individual animals was pooled and subjected to poly(A)+ mRNA purification by using a poly(A)+ purification kit (Dynal, Great Neck, NY).
Preparation of Tissue Homogenates for Immunoblot Analysis.
Tissues were removed from killed, nonovariectomized animals and placed immediately into liquid nitrogen and subsequently stored at −80°C until used (not more than 1 wk). Tissues were homogenized in buffer containing 50 mM triethanolamine (pH 7.4), 50 mM NaCl, 10% glycerol, 0.5 mM EDTA, 1 mM DTT, 1 mM cGMP, 1 mM PMSF, and 5 μg/ml each of pepstatin A, leupeptin, aprotinin, and chymostatin. Homogenates then were sonicated and spun at 15,000 × g for 15 min. The supernatant then was spun for 1 h at 100,000 × g, and the soluble fraction was used in the immunoblot analysis.
Real-Time Reverse Transcriptase–PCR Analysis.
To determine sGC α1 and β1 mRNA levels, the use of an α1 and β1 rat isoform-specific fluorescent detected, real-time quantitative PCR (Q-PCR) technique was used, as originally described by Gibson et al. (25). In brief, 100 ng total RNA extracted from rat tissues was used in a reverse transcriptase reaction by using Superscript reverse transcriptase (GIBCO/BRL) with a specific oligonucleotide primer corresponding to the complementary sequence of α1 or β1 sGC mRNA (sGC α1, 5′-ACACAATATGCATCTCCGATGG-3′; sGC β1, 5′-CCCGTGGAAACTGATGTCAA-3′). For the PCR, the negative-strand oligonucleotides remained the same, and the positive-strand oligonucleotides were: 5′-GCTCTCTATACTCGCTTTGACCAA-3′ for the α1 subunit and 5′-CGGGACCTAGTAGTCACGCA-3′ for the β1 subunit. A third, fluorescent-labeled, oligonucleotide probe that anneals within the amplicon for each assay also was used (5′-CCACCTTGTAGACATCCAGCTCTCCACA-3′ for the α1 assay and 5′-ACAGAGTGCTCCCCCAGCTCCAG-3′ for the β1 assay). Detection of the dequenched probe was achieved by using an Applied Biosystems Prism 7700 Sequence Detector (Perkin–Elmer). The data were analyzed by using the sequence detector software. Because each assay crosses an intron/exon boundary, the possibility of chromosomal DNA artifacts in the PCR is virtually eliminated. However, tubes containing no RNA template during the reverse transcriptase reaction and tubes containing no Superscript enzyme were consistently assayed in parallel to control for DNA and buffer contamination, respectively.
Relative levels of sGC α1 and β1 mRNA were reported after normalization to 36b4 mRNA, also detected by real-time Q-PCR. Levels of 36b4 message were not significantly altered by any treatment reported here.
Northern Blot Analysis.
Samples of poly(A)+ RNA were denatured for 10 min at 60°C in RNA loading buffer and subsequently separated on a 1% agarose denaturing gel. One microgram of poly(A)+ RNA was loaded per lane. After transferring to Duralon-UV membrane (Stratagene), membranes were prehybridized for 2 h in 50% formamide, 0.5% SDS, 6× SSC, 5× Denhardt's solution, 0.6% dextran sulfate, and 50 μg/ml yeast tRNA solution. Membranes were first hybridized with a random primed-generated 32P-dCTP-labeled probe using a random primed DNA labeling kit (Roche Molecular Biochemicals) and a 1.3-kb cDNA from sGC α1 as a template. Blots were hybridized for 16 h at 46°C and washed twice in buffer 1 (2× SSC, 0.5% SDS) then twice in buffer 2 (1× SSC, 0.1% SDS) and exposed to x-ray film (Kodak). For sGC β1, blots were stripped and reprobed in the exact manner, using a probe generated from a 1.9-kb cDNA for sGC β1. To correct for internal variation in loading, blots also were hybridized by using a 32P-labeled cDNA to glyceraldehyde-3-phosphate dehydrogenase (Ambion, Austin, TX).
Immunoblot Analysis.
Total protein in the 100,000 × g supernatants was determined by using Bradford reagent (Bio-Rad). Fifty micrograms of total protein from each sample was boiled for 8 min in Laemmli sample buffer and fractioned on 10% SDS gels. Resolved proteins were transferred to poly(vinylidene difluoride) membranes (Bio-Rad) and blocked overnight in 5% nonfat dry milk. Membranes then were incubated with a mouse monoclonal anti-sGC α antibody (H6) (26, 27), and sGC α protein was detected by using the ECL detection system (Amersham Pharmacia). Protein bands were analyzed by densitometry and presented as percent of control, using the densitometric values.
Data Analysis.
Statistical analysis of the E2 time course (Fig. 1A) was performed by ANOVA followed by the Scheffé post hoc test for comparison between groups (∗ indicates significant difference compared with control animals at the 0.05 level). All other statistical analyses were done by using a t test (∗ indicates significance from control, P < 0.01; # indicates significance from ∗). Where applicable, the results are presented as means ± SEM.
Figure 1.
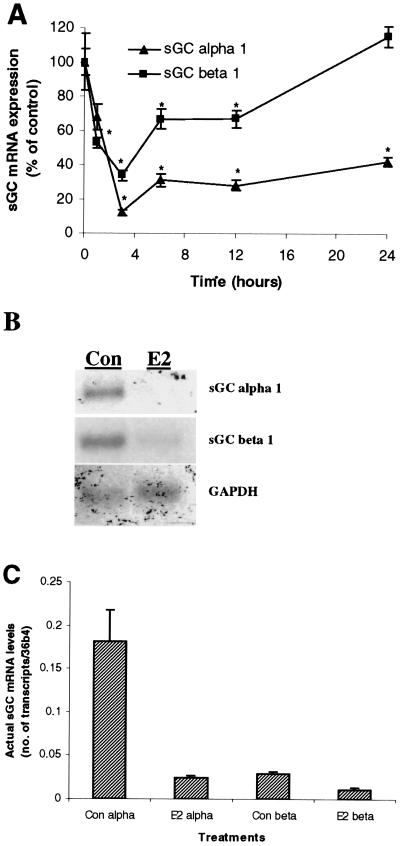
E2 rapidly diminishes sGC α1 and β1 mRNA expression in the rat uterus. Ovariectomized rats were administered E2 (40 μg/kg body weight, single injection) and killed over a time course. Uterine sGC α1 and β1 mRNA expression was determined by real-time Q-PCR (0–24 h) (A) and Northern blot (at 3 h) (B). Mean values ± SEM (n = 3) in A were normalized to 36b4 and graphed as percent of control (Con, Time 0 h). (C) The actual quantitation of sGC α1 and β1 transcript levels relative to 36b4 transcript under E2-stimulated and nonstimulated conditions as determined by real-time Q-PCR.
Results
E2 Rapidly Decreases Both sGC α1 and β1 mRNA.
We first determined the influence of a physiological dose of E2 on mRNA expression levels of sGC α1 and β1 using real-time Q-PCR (see Materials and Methods). As shown in Fig. 1A, in vivo administration of E2 to ovariectomized animals resulted in a rapid decrease of sGC α1 mRNA in the uterus. The effects were seen as early as 1 h after administration (30% decrease), and reached the lowest level at 3 h (90% decrease). Over the 24-h time course, the levels of sGC α1 mRNA began to reaccumulate, but only reached approximately 42% of control values.
Similar to the effects on sGC α1 mRNA levels, uterine sGC β1 mRNA levels also were reduced by in vivo E2 administration. Within 1 h, sGC β1 levels were diminished by almost 50%, and by 3 h to 34% of control levels. Unlike sGC α1, sGC β1 levels returned back to control steady-state levels within 24 h after E2 injection (Fig. 1A).
We also determined the effect of E2 on uterine sGC α1 and β1 mRNA levels in immature nonovariectomized animals. Three hours after the in vivo administration of E2 to nonovariectomized animals, sGC α1 and β1 mRNA levels were reduced to 15% and 32% of control values, respectively (data not shown). These results indicate that sGC α1 and β1 mRNA are similarly regulated in ovariectomized and nonovariectomized immature animals.
The reduction of sGC α1 and β1 mRNA levels in the rat uterus after 3 h of E2 in vivo treatment is further illustrated in Fig. 1B using Northern blot analysis. Transcripts of sGC α1 (5.2 kb) and β1 (4.2 kb) were detected as stated in Materials and Methods. The sGC α1 transcript is evident in control animals and virtually disappears after 3 h of E2 treatment. The dramatic reduction of sGC β1 transcript after 3 h of E2 administration also is shown. The glyceraldehyde-3-phosphate dehydrogenase transcript was detected to control for equal loading of samples. Fig. 1C illustrates the actual quantitative levels of sGC transcripts relative to the control housekeeping gene, 36b4, in 100 ng total uterine RNA under control (untreated) and 3-h E2-treated animals using real-time Q-PCR.
E2-Mediated sGC α1 and β1 mRNA Inhibition Is Dose-Dependent and Is Specific to Estrogen Receptor (ER) Activation.
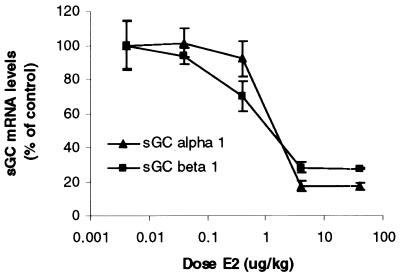
To confirm that the E2 reduction of uterine sGC mRNA depended on ER activation, we used three methods: (i) dose response, (ii) ER antagonist, and (iii) nonestrogenic steroid hormones. First, we determined the dose–response curve for E2 reduction of sGC mRNAs. Increasing doses of E2 were injected into ovariectomized rats, and uterine sGC α1 and β1 levels were determined after 3 h. As shown in Fig. 2, at a dose of 4 μg/kg, maximal reductions of both sGC α1 and β1 mRNA levels were observed.
Figure 2.
Dose-dependent reduction of sGC α1 and β1 transcripts by E2. Increasing doses of E2 were administered to ovariectomized animals that were killed after 3 h. Uterine sGC mRNA levels were determined by real-time Q-PCR. Mean values ± SEM (Con, n = 6; all doses, n = 3) were normalized to 36b4 and graphed as percent of control.
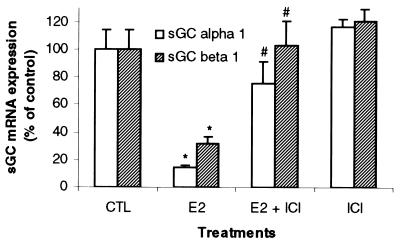
Some animals also were pretreated with the pure ER antagonist, ICI 182,780 (2 mg/kg), 30 min before E2 injection (40 μg/kg). Fig. 3 demonstrates that competitive inhibition of E2 binding to ER by ICI 182,780 blocks the effects of E2 on the mRNA of both sGC α1 and β1 subunits in uterine tissue. There was no effect of the ICI compound on the expression of these RNAs when administered alone (Fig. 3).
Figure 3.
ICI 182,780 blocks the E2-mediated diminution of uterine sGC mRNA expression. Ovariectomized rats were treated with the pure ER antagonist, ICI 182,780, 30 min before the administration of E2 (40 μg/kg body weight). Animals were killed after 3 h, and sGC α1 and β1 mRNA levels were determined by real-time Q-PCR. Mean values ± SEM (Con, n = 6; E2, n = 9; E2 + ICI, n = 6; ICI, n = 8) were normalized to 36b4 and graphed as percent of control.
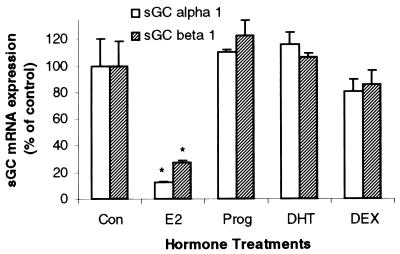
Finally, the effects of progesterone, 5α-dihydrotestosterone, and dexamethasone on uterine sGC mRNA levels were determined. None of the nonestrogenic steroid hormones used resulted in any significant changes in sGC mRNA levels (Fig. 4). Taken together, these results indicate that the E2-mediated effects on sGC at 3 h are specifically estrogenic and require ER activation.
Figure 4.
Uterine sGC mRNA regulation exhibits steroid-hormone specificity. Ovariectomized animals were administered either E2 (40 μg/kg), progesterone (Prog, 40 mg/kg), 5α-dihydrotestosterone (DHT, 400 μg/kg), or dexamethasone (DEX, 600 μg/kg). Animals then were killed after 3 h and uterine sGC α1 and β1 mRNA levels were determined by real-time Q-PCR. Mean values ± SEM (n = 3) were normalized to 36b4 and graphed as percent of control.
Puromycin Does Not Block E2-Mediated Effects on sGC mRNA Levels.
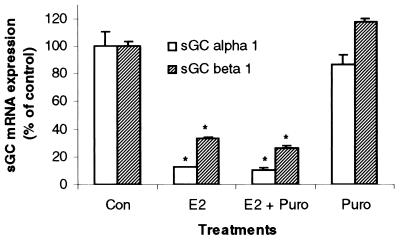
To determine whether the E2 effects on sGC mRNA levels in the uterus required the synthesis of new proteins, we used the protein synthesis inhibitor puromycin (100 mg/kg). At this dose, puromycin has been repeatedly shown to be effective at blocking new protein synthesis in both uterine and liver tissues (28–30). Puromycin was unable to block the inhibitory effect of E2 on sGC α1 and β1 mRNA levels. Furthermore, puromycin alone had no effect on sGC α1 or β1 transcripts (Fig. 5). Therefore, basal expression and E2 inhibition of sGC mRNA levels occur in the absence of any newly synthesized protein during the 3-h incubation period.
Figure 5.
E2 inhibition of uterine sGC mRNA levels occurs independently of new protein synthesis. Ovariectomized rats were pretreated with puromycin (30 min) and subsequently administered E2 (40 μg/kg). Animals were killed 3 h after the administration of E2, and sGC α1 and β1 mRNA levels were determined by real-time Q-PCR. Mean values ± SEM (n = 3) were normalized to 36b4 and graphed as percent of control.
E2 Inhibits sGC α1 and β1 mRNA in Vitro.
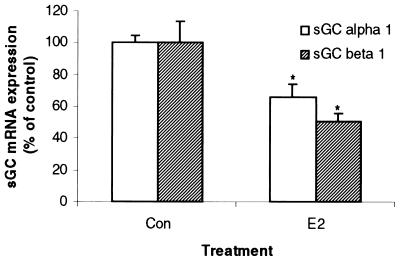
To determine whether the E2-mediated effects on sGC α1 and β1 mRNA levels occurred independent of factors released from other tissues, we treated uterine tissues in vitro with E2 (10 nM) after removing them from the intact animals. After 3 h of in vitro incubation with E2, uterine sGC α1 mRNA levels were reduced by 33% and sGC β1 by 50% when compared with tissues incubated in the absence of E2 (Fig. 6). Apparently because of nonoptimal conditions, the levels of in vitro control sGC mRNA levels were only 31% and 35% of in vivo control levels for α1 and β1, respectively (data not shown). Nevertheless, a direct effect by E2 to diminish sGC mRNA expression was observed in vitro.
Figure 6.
E2 inhibits uterine sGC mRNA levels in vitro. Uteri were excised from ovariectomized animals and incubated in vitro for 3 h in the presence or absence of E2 (10 nM). Transcript levels for sGC α1 and β1 mRNA were determined by real-time Q-PCR. Mean values ± SEM (n = 4) were normalized to 36b4 and graphed as percent of control.
E2 Decreases sGC Protein Levels.
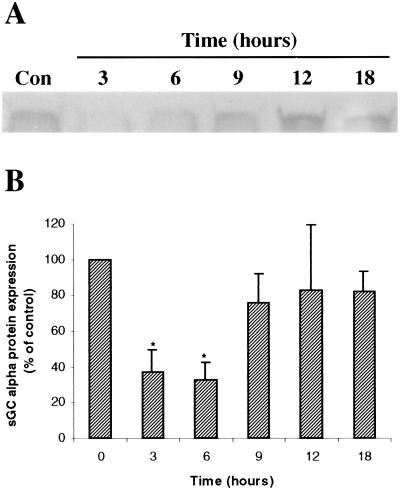
Using immunoblot analysis, we determined that E2 also results in decreased sGC protein. Fig. 7A demonstrates the effect of in vivo administration of E2 to immature nonovariectomized animals on sGC α protein levels in the uterus. Overall, E2 caused uterine sGC α protein levels to diminish to approximately 30–35% of control levels between 3 and 6 h after injection. By 12–18 h after E2 administration, the sGC protein levels returned to approximately 80% of the untreated animals (Fig. 7B).
Figure 7.
E2 leads to the reduction of sGC protein levels in rat uterus. Nonovariectomized rats were administered E2 (40 μg/kg) and killed over a time course. Uterine sGC α protein levels were determined by immunoblotting. (A) A representative blot from one experiment. (B) The average densitometric values from five independent experiments ± SEM graphed as percent of control.
Discussion
The female reproductive tissues respond dramatically to endocrine factors, specifically the ovarian steroid hormones. In this regard, estrogens and progesterone exhibit profound physiological effects in uterine tissue with respect to growth, vascularization, and gene expression. These steroid hormones also are associated with pathological states such as uterine cancers. However, the exact molecular mechanism(s) that regulate steroid hormone-mediated uterine physiological and pathological processes are not known.
The results presented here illustrate that E2 regulates both the α1 and β1 subunits of uterine sGC by reducing their mRNA levels within 1–3 h after in vivo injection to immature rats. Significant decreases were observed at the earliest time tested (1 h). The fact that the ER antagonist, ICI 182,780, blocks this response suggests that the inhibition is an ER-mediated effect. Furthermore, this effect only occurred after the in vivo administration of E2, and not in response to the other nonestrogenic hormones progesterone, 5α-dihydrotestosterone, and dexamethasone. In addition, this rapid response appears to be specific to uterine tissue, because lung, liver, and vascular tissue were all unresponsive to the E2 effects at times (3 h) when uterine sGC α1 and β1 mRNA was virtually abolished (data not shown). Taken together, E2 rapidly and specifically down-regulates sGC mRNA expression in vivo in the rat uterus.
We also demonstrate here that sGC α protein levels are reduced in the uterus of immature animals after in vivo E2 administration. The decrease in sGC protein levels likely occurs as a result of the reduction of the mRNA levels, because the time course of sGC protein reduction appears to follow subsequent to the mRNA.
In an effort to help elucidate the mechanism that mediates the effect of E2 on sGC α1 and β1 mRNA in the uterus, we used the protein synthesis inhibitor puromycin to determine whether the synthesis of new protein was necessary. Preadministration of puromycin had no effect on the inhibition of the sGC transcripts by E2, indicating that newly synthesized proteins are not responsible for the loss of sGC mRNA levels, and likely occur because of preexisting factors in uterine tissue. Puromycin alone had no effect on these transcripts, indicating that, under these conditions (estrogen deficiency), basal mRNA expression for sGC α1 and β1 does not require de novo protein synthesis.
Previously, it has been demonstrated that both transcriptional as well as nontranscriptional mechanisms mediate E2 repression of gene expression. For instance, Pastori and coworkers (31) described that the stabilization of the transcript encoding vitellogenin was increased after exposure to E2 in the popular Xenopus model. In addition, over a similar time period, cytoplasmic levels of fibrinogen disappeared because of a decrease in the stability of its message.
The possibility remains that E2 also represses the transcriptional activity of the genes responsible for the expression of the sGC subunits. Recently, Stoner et al. (32) demonstrated that the vascular endothelial growth factor transcript is rapidly reduced by E2 through repression of transcription in a cell culture model. E2 has been shown to repress the transcription of other genes through ER activation and may involve coactivators/repressors or the inhibition of transcription factors (33–36). These particular studies, however, targeted the more classical steroid-action time frame over many hours or days of treatment. We have shown that the E2 effects on sGC mRNA levels are very rapid, and even at 24 h post-E2 injection the levels of sGC α1 remain lower by approximately 50%. We are unsure whether this trend is caused by the metabolism of E2 because only one injection of E2 was administered. It would be interesting to determine whether the maintained reduction of sGC α1 mRNA levels after 24 h (50%) is a result of a direct mechanism similar to the classical genomic pathway stated above. In this regard, sGC α1 and β1 may be regulated independently, as we also suggested previously, despite their chromosomal proximity (22). Because the levels of sGC mRNA diminish so rapidly in response to E2 in rat uterus, it is likely that certain preexisting factors (e.g., ribonucleases or transcription factors) are responsible for the effects we have reported. Alternatively, the results also may reflect differences in the rate of turnover of sGC messages.
Recent and past evidence also has suggested that various responses to E2 may be because of a nonclassical, cell-surface E2 receptor, particularly rapid responses such as elevated cGMP levels and ion channel regulation of cell permeability. Some reports describe the activation of the mitogen-activated protein kinase (MAPK) signaling pathway and cGMP accumulation within minutes of stimulation by a membrane-impermeable form of estrogen in human vascular endothelial cells (37–41). This also could help explain the rapid effects by E2 in rat uterus on sGC mRNA. Notably, nerve growth factor-mediated decreases of sGC mRNA in PC-12 cells depend on the activation of the upstream activator of the MAPK pathway, Ras (42).
In the immature rat uterus, it is understood that the majority of rapid E2 responses on gene expression occur through the stimulation of the ERα. The recently discovered beta receptor (ERβ) is present at very low levels in the uterus, and it is not clear whether functional levels of ERβ protein are present (43–45). Zhong and coworkers (41) also have demonstrated that nongenomic effects of E2 occur through ERα stimulation. Therefore, we speculate that the effects on sGC mRNA levels are likely caused by direct stimulation of ERα in the rat uterus. We have not ruled out the possibility of a classical endocrine or paracrine effect initiated by E2 that could lead to the release of a small peptide or polypeptide growth factor that may activate a cell signaling cascade in the uterine tissue, resulting in sGC mRNA reduction. However, our results demonstrate that E2 leads to the reduction of sGC α1 and β1 mRNA in vitro, indicating that this response does not depend on the secondary release of other hormones or factors from other tissues.
It is important to note that α2 and β2 isoforms of sGC also exist. In fact, the sGC α2 subunit mRNA has been shown to be abundant in the uterus (16). Our study specifically examined the regulation of sGC α1 and β1.
Our results are also interesting in the broad realm of E2-mediated gene expression. To our knowledge, we have reported the most rapid negatively regulated gene by E2 in a mammalian system thus far, which could elucidate a mechanism for E2-mediated gene regulation. As more genes are reported to be negatively regulated by E2, common mechanisms such as sequence-specific repressor sites or E2-activated ribonucleases may become more apparent.
We have demonstrated here that ER activation leads to the rapid regulation of both sGC α1 and β1 mRNA and sGC protein in the rat uterus after in vivo E2 administration to an animal model, and we believe it plays an important role in E2-mediated uterine physiology. The long-term goal of our study is to understand how steroid hormones exhibit their effects on sGC mRNA at the molecular level, which will allow us to discover targets for the modulation and prevention/treatment of various physiological and pathological processes and diseases.
Acknowledgments
We thank Connie Chiappetta for her assistance in handling the animals. This study was supported in part by funding from the G. Harold and Leila Mathers Foundation, the John S. Dunn Foundation, the Welch Foundation, National Aeronautics and Space Administration, the U.S. Department of Defense, and the University of Texas–Houston. J.S.K. is supported by the Rosalie B. Hite predoctoral fellowship from the University of Texas M.D. Anderson Cancer Center, S.M.H. by National Institutes of Health Grant HD-08615, and F.M. by an endowed chair from the John S. Dunn Foundation and the Regents of the University of Texas.
Abbreviations
- E2
17β-estradiol
- sGC
soluble guanylyl cyclase
- Q-PCR
quantitative PCR
- ER
estrogen receptor
References
- 1.Yallampalli C, Byam-Smith M, Nelson S O, Garfield R E. Endocrinology. 1994;134:1971–1974. doi: 10.1210/endo.134.4.8137765. [DOI] [PubMed] [Google Scholar]
- 2.Brenner R M, Slayden O D. In: The Physiology of Reproduction. Knobil E, Neill J D, editors. New York: Raven; 1994. pp. 541–569. [Google Scholar]
- 3.Burger H G. Horm Res. 2000;53:25–29. doi: 10.1159/000023528. [DOI] [PubMed] [Google Scholar]
- 4.Hyder S M, Kirkland J L, Loose-Mitchell D S, Makela S, Stancel G M. In: Endocrine Disruptors. Naz R K, editor. Boca Raton, FL: CRC; 1999. pp. 166–186. [Google Scholar]
- 5.Weiner C P, Lizasoain I, Baylis S A, Knowles R G, Charles I G, Moncada S. Proc Natl Acad Sci USA. 1994;91:5212–5216. doi: 10.1073/pnas.91.11.5212. [DOI] [PMC free article] [PubMed] [Google Scholar]
- 6.Weiner C P, Knowles R G, Nelson S E, Stegink L D. Endocrinology. 1994;135:2473–2478. doi: 10.1210/endo.135.6.7988434. [DOI] [PubMed] [Google Scholar]
- 7.Riemer R K, Buscher C, Bansal R K, Black S M, He Y, Natuzzi E S. Am J Physiol. 1997;272:E1008–E1015. doi: 10.1152/ajpendo.1997.272.6.E1008. [DOI] [PubMed] [Google Scholar]
- 8.Flandroy L, Galand P. J Cyclic Nucleotide Res. 1978;4:145–158. [PubMed] [Google Scholar]
- 9.Kuehl F A, Jr, Ham E A, Zanetti M E, Sanford C H, Nicol S E, Goldberg N D. Proc Natl Acad Sci USA. 1974;71:1866–1870. doi: 10.1073/pnas.71.5.1866. [DOI] [PMC free article] [PubMed] [Google Scholar]
- 10.Vesely D L, Hill D E. Endocrinology. 1980;107:2104–2109. doi: 10.1210/endo-107-6-2104. [DOI] [PubMed] [Google Scholar]
- 11.Murad F. Recent Prog Horm Res. 1998;53:43–59. [PubMed] [Google Scholar]
- 12.Francis S H, Corbin J D. Crit Rev Clin Lab Sci. 1999;36:275–328. doi: 10.1080/10408369991239213. [DOI] [PubMed] [Google Scholar]
- 13.Juilfs D M, Soderling S, Burns F, Beavo J A. Rev Physiol Biochem Pharmacol. 1999;135:67–104. doi: 10.1007/BFb0033670. [DOI] [PubMed] [Google Scholar]
- 14.Biel M, Zong X, Ludwig A, Sautter A, Hofmann F. Rev Physiol Biochem Pharmacol. 1999;135:151–171. doi: 10.1007/BFb0033672. [DOI] [PubMed] [Google Scholar]
- 15.Kamisaki Y, Saheki S, Nakane M, Palmieri J A, Kuno T, Chang B Y, Waldman S A, Murad F. J Biol Chem. 1986;261:7236–7241. [PubMed] [Google Scholar]
- 16.Budworth J, Meillerais S, Charles I, Powell K. Biochem Biophys Res Commun. 1999;263:696–701. doi: 10.1006/bbrc.1999.1444. [DOI] [PubMed] [Google Scholar]
- 17.Nakane M, Saheki S, Kuno T, Ishii K, Murad F. Biochem Biophys Res Commun. 1988;157:1139–1147. doi: 10.1016/s0006-291x(88)80992-6. [DOI] [PubMed] [Google Scholar]
- 18.Nakane M, Arai K, Saheki S, Kuno T, Buechler W, Murad F. J Biol Chem. 1990;265:16841–16845. [PubMed] [Google Scholar]
- 19.Giuili G, Scholl U, Bulle F, Guellaen G. FEBS Lett. 1992;304:83–88. doi: 10.1016/0014-5793(92)80594-7. [DOI] [PubMed] [Google Scholar]
- 20.Koesling D, Herz J, Gausepohl H, Niroomand F, Hinsch K D, Mulsch A, Bohme E, Schultz G, Frank R. FEBS Lett. 1988;239:29–34. doi: 10.1016/0014-5793(88)80539-8. [DOI] [PubMed] [Google Scholar]
- 21.Koesling D, Harteneck C, Humbert P, Bosserhoff A, Frank R, Schultz G, Bohme E. FEBS Lett. 1990;266:128–132. doi: 10.1016/0014-5793(90)81523-q. [DOI] [PubMed] [Google Scholar]
- 22.Sharina I G, Krumenacker J S, Martin E, Murad F. Proc Natl Acad Sci USA. 2000;97:10878–10883. doi: 10.1073/pnas.190331697. . (First Published September 12, 2000; 10.1073/pnas.190331697) [DOI] [PMC free article] [PubMed] [Google Scholar]
- 23.Hyder S M, Stancel G M, Chiappetta C, Murthy L, Boettger-Tong H L, Makela S. Cancer Res. 1996;56:3954–3960. [PubMed] [Google Scholar]
- 24.Hyder S M, Chiappetta C, Murthy L, Stancel G M. Cancer Res. 1997;57:2547–2549. [PubMed] [Google Scholar]
- 25.Gibson U E M, Heid C A, Williams P M. Genome Res. 1996;6:995–1001. doi: 10.1101/gr.6.10.995. [DOI] [PubMed] [Google Scholar]
- 26.Lewicki J A, Brandwein H J, Waldman S A, Murad F. J Cyclic Nucleotide Res. 1980;6:283–296. [PubMed] [Google Scholar]
- 27.Brandwein H, Lewicki J, Murad F. Proc Natl Acad Sci USA. 1981;78:4241–4245. doi: 10.1073/pnas.78.7.4241. [DOI] [PMC free article] [PubMed] [Google Scholar]
- 28.Loose-Mitchell D S, Chiappetta C, Stancel G M. Mol Endocrinol. 1988;2:946–951. doi: 10.1210/mend-2-10-946. [DOI] [PubMed] [Google Scholar]
- 29.DeAngelo A B, Gorski J. Proc Natl Acad Sci USA. 1970;66:693–700. doi: 10.1073/pnas.66.3.693. [DOI] [PMC free article] [PubMed] [Google Scholar]
- 30.Nelson K, Cimbala M A, Hanson R W. J Biol Chem. 1980;255:8500–8515. [PubMed] [Google Scholar]
- 31.Pastori R L, Moskaitis J E, Smith L H, Jr, Schoenberg D R. Biochemistry. 1990;29:2599–2605. doi: 10.1021/bi00462a024. [DOI] [PubMed] [Google Scholar]
- 32.Stoner M, Wang F, Wormke M, Nguyen T, Samudio I, Vyhlidal C, Marme D, Finkenzeller G, Safe S. J Biol Chem. 2000;275:22769–22779. doi: 10.1074/jbc.M002188200. [DOI] [PubMed] [Google Scholar]
- 33.An J, Ribeiro R C J, Webb P, Gustafsson J-A, Kushner P J, Baxter J D, Leitman D C. Proc Natl Acad Sci USA. 1999;96:15161–15166. doi: 10.1073/pnas.96.26.15161. [DOI] [PMC free article] [PubMed] [Google Scholar]
- 34.Roy D, Angelini N L, Belsham D D. Endocrinology. 1999;140:5045–5053. doi: 10.1210/endo.140.11.7117. [DOI] [PubMed] [Google Scholar]
- 35.Ray P, Ghosh S K, Zhang D H, Ray A. FEBS Lett. 1997;409:79–85. doi: 10.1016/s0014-5793(97)00487-0. [DOI] [PubMed] [Google Scholar]
- 36.Blobel G A, Sieff C A, Orkin S H. Mol Cell Biol. 1995;15:3147–3153. doi: 10.1128/mcb.15.6.3147. [DOI] [PMC free article] [PubMed] [Google Scholar]
- 37.Razandi M, Pedram A, Greene G L, Levin E R. Mol Endocrinol. 1999;13:307–319. doi: 10.1210/mend.13.2.0239. [DOI] [PubMed] [Google Scholar]
- 38.Russel K S, Haynes M P, Sinha D, Clerisme E, Bender J R. Proc Natl Acad Sci USA. 2000;97:5930–5935. doi: 10.1073/pnas.97.11.5930. [DOI] [PMC free article] [PubMed] [Google Scholar]
- 39.Pietras R J, Szego C M. Nature (London) 1977;265:69–72. doi: 10.1038/265069a0. [DOI] [PubMed] [Google Scholar]
- 40.Gorodeski G I. Endocrinology. 2000;141:1658–1666. doi: 10.1210/endo.141.5.7473. [DOI] [PubMed] [Google Scholar]
- 41.Zhong C, Yuhanna I S, Galcheva-Gargova Z, Karas R H, Mendelsohn M E, Shaul P W. J Clin Invest. 1999;103:401–406. doi: 10.1172/JCI5347. [DOI] [PMC free article] [PubMed] [Google Scholar]
- 42.Liu H, Force T, Bloch K D. J Biol Chem. 1997;272:6038–6043. doi: 10.1074/jbc.272.9.6038. [DOI] [PubMed] [Google Scholar]
- 43.Wang H, Masironi B, Eriksson H, Sahlin L. Biol Reprod. 1999;61:955–964. doi: 10.1095/biolreprod61.4.955. [DOI] [PubMed] [Google Scholar]
- 44.Shughrue P J, Lane M V, Scrimo P J, Merchenthaler I. Steroids. 1998;63:498–504. doi: 10.1016/s0039-128x(98)00054-3. [DOI] [PubMed] [Google Scholar]
- 45.Couse J F, Lindzey J, Grandien K, Gustafsson J A, Korach K S. Endocrinology. 1997;138:4613–4621. doi: 10.1210/endo.138.11.5496. [DOI] [PubMed] [Google Scholar]


