Abstract
The first steps in the photocycles of the archaeal photoreceptor proteins sensory rhodopsin (SR) I and II from Halobacterium salinarum and SRII from Natronobacterium pharaonis have been studied by ultrafast pump/probe spectroscopy and steady-state fluorescence spectroscopy. The data for both species of the blue-light receptor SRII suggests that their primary reactions are nearly analogous with a fast decay of the excited electronic state in 300–400 fs and a transition between two red-shifted product states in 4–5 ps. Thus SRII behaves similarly to bacteriorhodopsin. In contrast for SRI at pH 6.0, which absorbs in the orange part of the spectrum, a strongly increased fluorescence quantum yield and a drastically slower and biexponential decay of the excited electronic state occurring on the picosecond time scale (5 ps and 33 ps) is observed. The results suggest that the primary reactions are controlled by the charge distribution in the vicinity of the Schiff base and demonstrate that there is no direct connection between absorption properties and reaction dynamics for the retinal protein family.
Sensory rhodopsin (SR) I and II are members of the family of retinal-containing membrane proteins of archaea, which also includes the well-known ion pumps bacteriorhodopsin (BR) and halorhodopsin (HR). SRI and SRII act as receptors in phototaxis. In this process light absorption triggers movement of the flagellated cells toward favorable or away from unfavorable environments, depending on the wavelength of the absorbed light. Thus, the SRs provide a simple color-sensing mechanism (1) for haloarchaea like Halobacterium salinarum and other species. Attractant and repellent reactions of the cell are triggered by light absorption of specific photochromic states of these photoreceptors. In SRI, the dark-adapted state SRI587 is converted into a blue-shifted intermediate S373 by absorbing orange light around 590 nm (2), leading to positive signaling via the closely coupled transducer protein HtrI (3). Absorption of a UV photon in the S373 state leads to a repellent stimulus, resulting in a photophobic response of the cell. SRII is a blue-light receptor with maximum ground-state absorption around 490 nm. The repellent signaling is initiated by the intermediate SRII360 (M) in the course of the SRII photocycle (4).
SRI and SRII are structurally very similar to BR and HR; sequence homology is especially striking in the chromophore environment (5, 6). Although 13 of 21 residues in a 5-Å shell around the retinal atoms are strictly conserved in BR, HR, and SRI of all species sequenced to date, SRII has three residues less conserved (7). This might be one reason for the blue-shifted absorption maximum of SRII compared with the other archaeal receptor proteins (8). Photoexcitation triggers a series of conformational changes initiated by trans-cis isomerization of the retinal chromophore in all retinal-containing membrane proteins (9). The first events lead to the formation of a red-shifted intermediate observed on the subnanosecond time scale. The interaction between chromophore and protein environment plays a key role for speed and efficiency (η = 0.3–0.7) of the photochemistry in these chromoproteins. In recent years ultrafast spectroscopic experiments on the primary reaction dynamics in a number of photoreceptors such as rhodopsin, phytochrome, or photoactive yellow protein contributed to a better understanding of the construction principles and the molecular mechanisms of these systems (10–12). Also the primary events in the photocycles of the ion pumps BR and HR have been described in great detail (13–18), but to our knowledge no data for the SRs in the ultrafast time domain were available until now.
We present in this study experiments on the primary reactions of transducer-free SRI and SRII by ultrafast spectroscopy on the femtosecond and picosecond time scale. Our experiments resolve the primary reaction dynamics and further allow a direct comparison of the ultrafast kinetics of SRII from the two different species H. salinarum (sSRII) and Natronobacterium pharaonis (pSRII).
Materials and Methods
pSRII.
The overexpression and isolation of the pSRII–His fusion protein in Escherichia coli was analogous to that described in ref. 19. The pSRII-His fraction eluting from the Ni-nitrilotriacetic acid column (Qiagen, Hilden, Germany), which contained pSRII-His, was diluted with 10 mM Tris buffer (pH 8) containing 0.15% dodecyl maltoside (DM) to a salt concentration below 20 mM NaCl. Under these conditions pSRII–His binds to the matrix of a DEAE column. Residual imidazole was removed by extensive washing with 50 mM NaCl, 10 mM Tris, 0.15% DM (pH 8). Finally, the protein was eluted by a stepwise increase of the salt concentration to 500 mM NaCl. The purity of the protein sample was judged by SDS/PAGE as well as by the ratio between the protein absorption at 280 nm and the chromophore absorption at 500 nm. A value of <1.3 indicates a purity of >95%. The final sample conditions in the experiments were: 150 mM NaCl, 10 mM Tris⋅HCl (pH 8), 0.2% DM.
Recombinant sSRI and sSRII.
To express sSRI and sSRII homologously in H. salinarum the corresponding genes sopI and sopII were cloned into the pBPH-M vector (20). In the case of sSRI the bop leader sequence was fused to the 5′ end of sopI by PCR. The 3′ 42 bp were omitted, resulting in a construct according to ref. 21. SopII was cloned into the same vector but without the bop leader sequence. Again, the last 42 bp were omitted, thereby increasing protein amounts in the crude extracts about 10-fold compared with the full-length protein as judged by immunoblotting. Both genes were expressed under the control of the bop promotor, and the resulting proteins carried a C-terminal His tag. They were purified as described (22) with the difference that sSRI was bound to the Ni-nitrilotriacetic acid column at pH 7. Protein yield was about 1–2 mg/liter of cell culture for both SRI and SRII. After purification a buffer exchange was performed on PD10 columns (Amersham Pharmacia) to a 50 mM Mes buffer (pH 6.0), 4 M NaCl. The samples contained no detectable impurities. The final conditions for spectroscopic experiments were sSRI in 50 mM Mes (pH 6.0)/4 M NaCl/0.025% DM and sSRII in 50 mM Mes (pH 6.0)/4 M NaCl/0.05% DM.
Stationary Spectroscopy.
Absorption spectra were recorded with a Perkin–Elmer Lambda19 spectrometer and corrected for classical Rayleigh scattering. Because of the low fluorescence intensities of the investigated retinal proteins, fluorescence measurements could not be performed with commercial fluorescence spectrometers. As a consequence a highly sensitive Raman spectrometer was used. The samples were stirred in a thin quartz cuvette and illuminated with 514-nm light from an argon-ion laser. Emitted photons were collected with a microscope objective in a back-scattering arrangement, focused on the entrance slit of an imaging spectrograph, and detected in a liquid nitrogen-cooled charge-coupled device camera (see ref. 23 for details). Fluorescence spectra of rhodamine 6G in methanol measured under the same experimental conditions served as a standard.
Time-Resolved Spectroscopy.
The femtosecond time-resolved measurements by pump/probe technique were performed with a home-built 1-kHz Ti:sapphire laser system similar to the setup described in ref. 24. The pulse width of the system was about 100 fs (full width at half maximum), and the pulse energy was typically 1 mJ at a central wavelength of 800 nm. Part of the 800-nm output was frequency-doubled and used for pumping a noncollinear optical parametrical amplifier (NOPA) with a tunable wavelength range from 480 to 750 nm. The NOPA setup has been described in detail (25). The output pulses of the NOPA were compressed to a duration of approximately 20 fs. These pulses excited the samples at wavelengths of 480 or 530 nm (SRII) and 560 nm (BR and sSRI).
A white-light continuum used for probing was generated from either frequency-doubled (400 nm) or fundamental laser pulses (800 nm, energy ≈1 μJ) in a 2-mm sapphire plate. It covered a wavelength range from 400 to 700 nm. For signal and reference detection two spectrometers each with a 42-segment diode array (Δλ = 8 nm) were used. The signal spectrometer recorded the spectrum of the continuum transmitted through the sample at a certain delay time between pump and probe pulses. The reference spectrometer recorded the spectrum of the continuum pulse. Long-term drift effects were avoided by an automated recalibration procedure: every 20 s pump pulses were blocked and the ratio between probe and reference signals for the nonexcited sample was determined to calculate the transmission of the unexcited sample.
The signals from the diode arrays were recorded in single-pulse detection mode by a gated multichannel analog/digital converter. The experimental delay time zero position and the instrumental response function were verified by recording transient absorption changes of different laser dyes (DCM, cresyl violet).
The single-channel measurements with highest temporal resolution were recorded with a similar setup. Both pump and probe pulses were generated by two independent tunable noncollinear optical parametrical amplifiers. The temporal resolution was measured by cross-correlating pump and probe beams in a thin BBO crystal (β-barium-borate, thickness 25 μm), which was placed directly at the sample position (see ref. 26 for details). The resulting cross correlation width was 30 fs (full width at half maximum) for 660 nm and 34 fs for 890-nm probe pulses at a pump wavelength of 530 nm.
In all experiments the probing pulses were polarized parallel to the exciting pulses. During the measurements the samples were pumped through a thin quartz cuvette (path length 0.5 mm for multichannel measurements and 0.25 mm for single-channel measurements), thus exchanging the excited sample volume between subsequent laser shots.
Results
Stationary Spectroscopy.
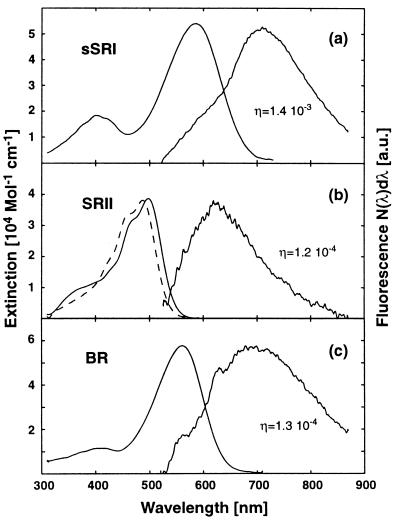
Fig. 1 shows the steady-state absorption and fluorescence spectra of the investigated samples. By comparison of fluorescence intensities of the chromoproteins with that of a rhodamine 6G solution in methanol, the fluorescence quantum yields of the retinal proteins were deduced. Using ref. 27, the excited-state lifetimes were derived from the fluorescence spectra (photon distributions) and quantum yields. The spectra of sSRI (Fig. 1a) and both SRII (Fig. 1b) are plotted together with the data of BR (Fig. 1c). The absorption spectrum of sSRI (see Fig. 1a) has its major peak at 587 nm. A second peak is seen at 400 nm. The absorption spectrum is characteristic for the “blue form” of SRI expected for the ambient pH value (6.0) of the sample (22, 28). The red shift of the main absorption band relative to BR indicates the protonation of Asp-76 (28), which corresponds to Asp-85 in BR, located in the vicinity of the Schiff base.
Figure 1.
Absorption and fluorescence spectra of sSRI (a), sSRII (b, dashed line), pSRII (b, solid line), and BR (c). Fluorescence spectra are scaled to the same height as the corresponding absorption spectra. A fluorescence spectrum of sSRII could not be recorded because of dominating buffer fluorescence around 560 nm. Buffer fluorescence also is visible in the short wavelength wing of the sSRI fluorescence band (a). In the fluorescence spectrum of BR the narrow shoulders at 560 and 620 nm arise from Raman scattering of water.
sSRI shows a broad fluorescence with a maximum around 700 nm extending beyond 800 nm. The form of the emission spectrum is similar to that of BR. However, a striking difference occurs for the fluorescence intensities. The fluorescence quantum yield of sSRI is approximately 1 order of magnitude higher than for BR and pSRII, indicating a much longer lifetime of the excited electronic state of sSRI.
The absorption spectrum of SRII from N. pharaonis (pSRII) displays the main absorption peak at λmax = 497 nm and vibronic bands in the shoulder at shorter wavelengths (Fig. 1b, see ref. 29). The spectral features of SRII from H. salinarum (sSRII, dashed line in Fig. 1b) are very similar. The most remarkable difference is the blue shift of the absorption maximum to λmax = 487 nm. The fluorescence spectrum of pSRII peaks around 630 nm, and the fluorescence intensity of pSRII is very similar to that of BR (see Fig. 1c). The resulting fluorescence quantum yield of pSRII is calculated to 1.2 × 10⁻⁴, which is very close to the value of BR (1.3 × 10⁻⁴), which in turn is in good agreement with earlier publications (13). Estimation of excited-state lifetimes using ref. 27 yields a value of τS1 ≈ 750 fs for pSRII and τS1 ≈ 800 fs for BR. Although not all conditions for applying the Strickler–Berg relation to the retinal chromophore in the archaeal rhodopsins are fulfilled, it has been demonstrated, that this relation gives interesting information even in the case of photoactive molecules (see ref. 30).
The fluorescence spectrum of the sSRII sample was dominated by fluorescence around 560 nm attributed to the buffer. Therefore no fluorescence spectrum for sSRII is shown.
Time-Resolved Spectroscopy of SRII.
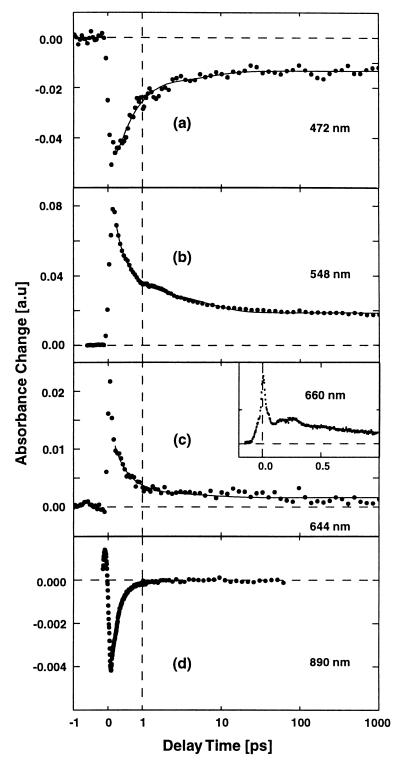
Time-dependent absorbance changes of pSRII were recorded at more than 30 wavelengths between 400 and 890 nm. Traces for selected probing wavelengths are shown in Fig. 2. At the blue side of the main absorption band (e.g., at 472 nm; Fig. 2a) one finds an absorption decrease at time zero, which recovers partially in the ≈300-fs and 5-ps time domain. At later times the absorption decrease stays constant until 1 ns. At 548 nm (Fig. 2b), in the red wing of the ground-state absorption band, the pSRII response upon photoexcitation is dominated by a strong absorption increase. A considerable fraction of this increase decays within 300 fs, followed by a further decrease on the picosecond time scale. A residual signal in the form of a constant absorption increase remains at later delay times. At 644 nm (Fig. 2c), in a spectral range devoid of ground-state absorption a first rise of the absorption is followed by a fast initial decay on the sub-100-fs time scale. Subsequently, the signal shows the ≈300 fs and a weak 5-ps decay. At late times a weak absorption increase remains. The transient absorbance change at 660 nm (Fig. 2c, Inset) has been recorded with higher temporal resolution and single-channel detection. Here the modulation of the very fast initial kinetics clearly indicates wave packet-like motion in pSRII. At later times the absorption decays with 300 fs. It is surprising that stimulated emission (characteristic for an excited electronic state) is not evident in this spectral range. Only around λpr = 730 nm did we obtain a first indication of a weak stimulated emission with a decay time constant in the 100-fs range. However, stimulated emission is well seen in single-channel experiments performed at 890 nm (Fig. 2d). In this range the weak, but well-resolved, absorption decrease decays with a time constant of 300 fs. There is no indication of a long-lasting stimulated emission in the picosecond time range.
Figure 2.
Transient absorption changes of pSRII after excitation with 480-nm (multichannel detection, a–c) and 530-nm pulses (single-channel detection, c Inset and d) displaying the femtosecond and picosecond reaction dynamics. The solid lines represent the results from a multiexponential global fitting procedure with time constants of τ1 < 150 fs, τ2 = 300–400 fs, τ3 = 5 ps, and τ4 = ∞. Note the linear time scale for delay times < 1 ps and the logarithmic scale at later delay times.
Qualitatively the results on pSRII can be summarized as follows. In the range of ground-state absorption the absorption decrease is caused by the ground-state depletion. Strong excited-state absorption is observed at very early times in the red wing of the ground-state band. Subsequently, the absorption increase is reduced in the 100-fs time domain (λpr = 644 nm). Stimulated emission at long wavelengths shows that the excited electronic state decays in the 300-fs range. The excited-state absorption around 550 nm decreases with the same time constant. At later delay times absorption transients are observed, which point to a transition between red-shifted product states (absorption changes in the 5-ps range and at late delay times).
A modeling of 31 absorption transients in a global fitting routine (see solid curves in Fig. 2) with exponential functions indicates that the time dependence of the experimental data can be satisfactorily fitted with four time constants (τ1 < 150 fs, τ2 ≈ 300–400 fs, τ3 = 5 ps, and τ4 > 10 ns, which can be treated as τ4 = ∞ for the time range investigated here). Very weak additional absorption changes can be modeled by a time constant of 50 ps. When this additional time constant is introduced, the global fitting procedure changes the other picosecond time constant from 5 to 3 ps.
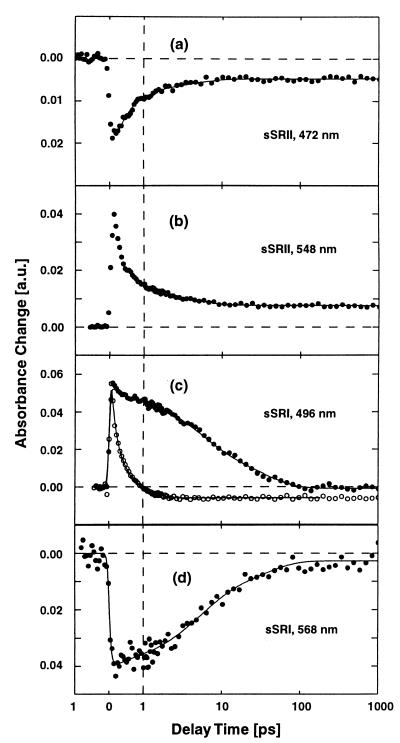
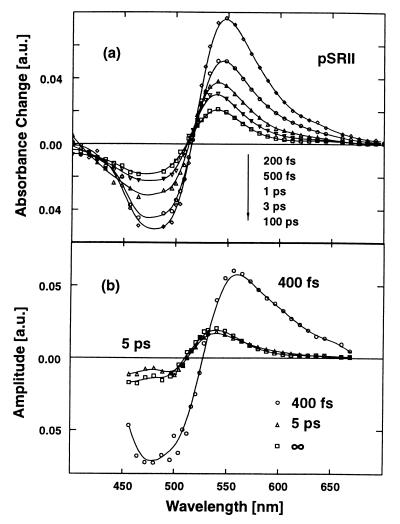
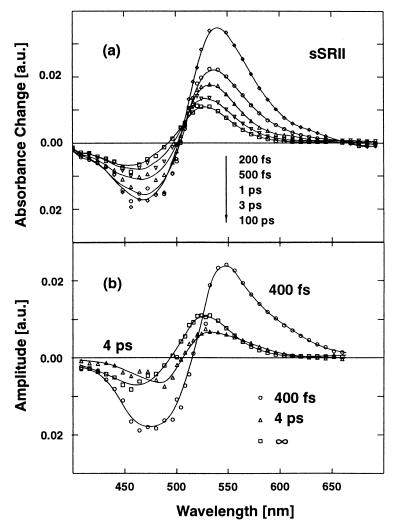
Fig. 3 a and b shows experimental data on SRII from H. salinarum (sSRII). The data taken at 472 nm (a) and 548 nm (b) reveal time dependence very similar to that observed for pSRII. This similarity is also evident when the absorption changes of the two samples recorded at special delay times are plotted as a function of probing wavelength (transient spectra see Figs. 4a and 5a). Both samples show a strong bleaching of the ground-state absorption and strong excited-state absorption at early times. The absorption changes observed at longer delay times are similar and indicative of the existence of red-shifted intermediates. When the absorption changes of sSRII are modeled we obtain similar time constants as for pSRII: τ1 < 150 fs, τ2 = 400 fs, τ3 = 4 ps, and τ4 = ∞. The amplitude spectra related to the different decay times (decay-associated spectra) are shown in Figs. 4b and 5b.
Figure 3.
Transient absorption changes of sSRII (a and b), sSRI (c and d, ●) and BR (c, ○). The solid lines represent the results from a multiexponential global fitting procedures.
Figure 4.
(a) Transient absorption spectra for pSRII at different delay times. (b) Decay-associated spectra (amplitude spectra) of the recorded transients (pSRII). The spectral characteristics for the 400-fs component displays ground-state bleaching (λ < 520 nm) and excited-state absorption (λ > 520 nm). The 5-ps component shows the signature of a transition between red-shifted photoproducts.
Figure 5.
(a) Transient absorption spectra for sSRII at different delay times. (b) Decay-associated spectra (amplitude spectra) of the recorded sSRII transients. The spectral features of sSRII and pSRII (Fig. 4) are very similar.
SRI.
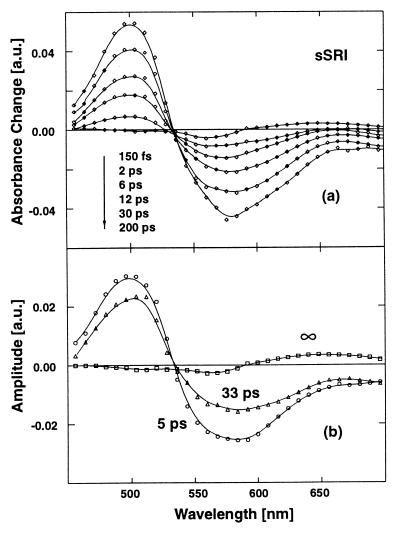
Time-resolved absorption changes of SRI are shown in Fig. 3 c and d (filled circles). For comparison, the open circles in Fig. 3c represent data from BR. In a spectral range, with weak ground-state and strong excited-state absorption (λpr = 496 nm) the initial absorption increase is similar for SRI and BR. This absorption increase decays rapidly for BR. However, in SRI this absorption increase changes very little during the first picosecond. Later on, a biexponential decay occurs on the 10-ps range. Data taken at 568 nm near the peak of the sSRI ground-state absorption reveal similar dynamics: there is a strong bleaching of the ground-state absorption that recovers to a large extent on the 10-ps time scale. At longer delay times a weak reduced absorption remains, indicative for a long-lived product state. The data can be well modeled by a weak ≈150-fs component and two major contributions with time constants of 5 and 33 ps. Details of the spectral properties of sSRI are seen in the transient spectra in Fig. 6a. Around 490 nm we observe strong absorption increase related to excited-state absorption. The absorption decrease around 570 nm represents ground-state bleaching whereas the absorption decrease extending to 700 nm is an indication for stimulated emission. The decay-associated spectra (Fig. 6b) show that both picosecond processes (5 and 33 ps) have the same wavelength dependence, whereas the absorption changes after 1 ns (∞-component) clearly point to the formation of a red-shifted photoproduct. Such long-lived intermediates have been observed on the nanosecond time scale (2).
Figure 6.
(a) Transient absorption spectra for sSRI at different delay times. (b) Decay-associated spectra (amplitude spectra) of the recorded sSRI transients. Excited-state absorption (λ < 530 nm), ground-state bleaching (λ ≈ 580 nm), and stimulated emission (λ > 650 nm) are clearly visible in the transient spectra and in both picosecond amplitude spectra.
Discussion
The photoinduced dynamics in photoactive biomolecules is of fundamental importance for understanding the coupling between light absorption, the related conformational changes, and the biological function of the particular chromoprotein. For retinal-containing proteins fast initial motions of the chromophore retinal on the excited-state potential surface leads the retinal to a region in the configurational space, where the transition to the product state takes place (14, 16). In this paper we want to concentrate on the transition back to the ground state. The S1 motions will be treated in a forthcoming manuscript.
The S1 → S0 transition can be deduced from the decay of both stimulated emission and excited-state absorption. In BR the kinetics at 490 nm (excited-state absorption) and 900 nm (stimulated emission) were used to assign the 500-fs transient to the transition to the first ground-state product J (13, 31). Because sSRI has similar absorption properties as BR, the 490-nm absorption transient can be taken as an indication that both processes, the 5-ps and the 33-ps process, are related to the S1 decay. The similar behavior of both components in the wavelength range of stimulated emission (see Fig. 6b) supports this interpretation. The strong differences in fluorescence quantum yield between BR and sSRI (Fig. 1) provide a second strong argument that the excited state of sSRI is long-lived.
Another striking observation is the biexponentiality of the S1 decay. Slow biexponential reaction dynamics with time constants in the picosecond regime have been found in BR mutants with uncharged residues at the 85 position, acid purple BR (32), HR (ref. 15; containing Thr at the corresponding position), and isolated retinal in solution (lacking a well-defined charged surrounding; refs. 33 and 34). The red-shifted absorption spectrum in combination with titration experiments indicates the protonation of the counter ion Asp-76 in sSRI. This finding in combination with the biexponential picosecond S1 decay places sSRI in a line with the above-mentioned systems and provides a strong indication that the negative charge at Asp-85 in BR (or Asp-73 in sSRII) is of major importance for a fast subpicosecond formation of a red-shifted product state. Alternative interpretations of the observed biexponentiality are: (i) sample heterogeneity, because we measured at a pH value of 6.0, which is close to the published pK value of 6.5 for the transition between the protonated and the deprotonated state of SRI and (ii) use of different primary reaction pathways as discussed, e.g., for halorhodopsin (15).
SRII acts as a blue-light receptor of the cell. As a consequence, the ground-state absorption spectra of both SRII samples are strongly blue-shifted relative to BR and SRI. There are characteristic residues in the vicinity of the retinal chromophore that are conserved among the archaeal rhodopsins but not in SRII—such as Val-108 (instead of Met in all other archaeal rhodopsins, numbering according to pSRII), Gly-130 (instead of Ser), and Thr-204 (instead of Ala). These residues with different nucleophilic character were considered likely candidates for the unique blue-shifted absorption maximum of SRII, but recent mutagenesis work demonstrated that even the corresponding triple mutant of pSRII compensated only 30% of the spectral shift between SRII and BR (8). Therefore another mechanism for color tuning escaped detection so far and the detailed molecular mechanisms for the blue shift are not known at present. Because of the shifted ground-state absorption of SRII the assignment of transient absorption dynamics to molecular processes is more complicated for SRII than for the other retinal proteins. At most wavelengths several intermediates simultaneously lead to absorption transients. At early times the bleaching of the ground-state absorption band around 490 nm is superimposed by the excited-state absorption. Excited-state absorption around 550 nm is in a spectral range, where stimulated emission and absorption of red-shifted photoproducts also occur. Therefore the decay of the excited electronic state can be identified only via the stimulated emission at much longer wavelengths. The experimental data taken from pSRII at 890 nm indicate that the S1 decay occurs with 300 fs. The strong amplitude of the 300-fs component in the 450- to 630-nm range (see Fig. 4b) supports this interpretation. Other arguments originate from the decay-associated spectra (Figs. 4b and 5b). The long-lasting absorption changes (∞-component) demonstrate the existence of a red-shifted photoproduct in the 100-ps to the nanosecond range. This state can be identified as a K-like intermediate found in flash photolysis measurements (29, 35, 36). The similar decay-associated spectra of the infinite and the 5-ps kinetic components indicate a species with a stronger red shift—we call it SRII J—populated for 5 ps. The 300- to 400-fs kinetic component has different absorption transients that can be assigned to features related with the decay of the excited electronic state: decrease of the excited-state absorption (λ > 530 nm) and recovery of the ground-state absorption (around 480 nm). This interpretation also is supported by the small fluorescence quantum yield of pSRII.
The experimental data on the SRII samples from the two species H. salinarum and N. pharaonis indicate that their primary reactions are very similar to each other and to the one observed in native BR:
 |
All of these samples show wavepacket-like absorption changes in the S1 state with reactions in the 100- to 200-fs range. These reactions can be related to an initial motion on the S1 surface out of the Franck–Condon region (SRII**) presumably along high-frequency (C-C stretch) coordinates. This motion may precede the torsion and therefore triggers retinal isomerization. The transition to the ground-state potential energy surface is reflected by the appearance of a first red-shifted product state (SRII J) in the 300- to 400-fs range. A secondary transition to a less red-shifted state (SRII K510) occurs in 4–5 ps. In sSRI a much slower decay of the excited electronic state into a red-shifted intermediate is observed. In this molecule the slow initial reaction prevents the detection of a transition between two red-shifted intermediates (such as J and K in BR) on the time scale of a few picoseconds.
Conclusions
The primary reaction dynamics of SRI and SRII follow the reaction schemes of the ion-pumping retinal proteins HR and BR and their mutants. The transient absorption data for SRII suggest a fast decay of the excited electronic state in 300–400 fs to a first red-shifted product state and the subsequent formation of a second, less red-shifted product state in 4–5 ps similar to BR. In contrast, for sSRI at pH 6 (protonated Asp-76), a slow biexponential absorbance change (5 and 33 ps) indicates a long-lived excited state. The two SRs represent retinal proteins with specialized absorption and dynamic properties: the absorption spectrum of SRII provides color vision in the blue spectral range. Nevertheless the primary reactions remain unaffected compared with the proton pump BR. On the other hand, the orange light receptor SRI has BR-like absorption properties, but its primary reaction is strongly slowed down. Obviously color shift and initial dynamics are essentially independent. While the primary dynamics seem to be controlled by the charge distribution in the vicinity of the Schiff base (protonation state of Asp residues) the detailed molecular mechanisms leading to the different absorption behavior remain to be investigated. The high conservation of amino acid residues in the different archaeal retinal proteins shows that minor changes of the protein surrounding the retinal chromophore have been used in the course of evolution to adapt the absorption properties and the reaction dynamics to the functional requirements of the proteins. Very fast initial reaction dynamics leads to a high reaction yield and is especially important for the proton pump BR. It does not play a key role for the SRs, where a longer lifetime of the signaling state may compensate for a lower quantum yield. At least in the case of SRI the process of evolution to a two-color photosensor is accompanied by a significant loss in quantum yield (36).
Acknowledgments
We thank I. Chizhov for his contributions to the data analysis and M. Nonella and P. Tavan for stimulating discussions. This work was supported by Deutsche Forschungsgemeinschaft/SFB 533.
Abbreviations
- SR
sensory rhodopsin
- BR
bacteriorhodopsin
- HR
halorhodopsin
- DM
dodecyl maltoside
Footnotes
Article published online before print: Proc. Natl. Acad. Sci. USA, 10.1073/pnas.021560298.
Article and publication date are at www.pnas.org/cgi/doi/10.1073/pnas.021560298
References
- 1.Spudich J L, Bogomolni R A. Nature (London) 1984;312:509–513. doi: 10.1038/312509a0. [DOI] [PMC free article] [PubMed] [Google Scholar]
- 2.Bogomolni R A, Spudich J L. Biophys J. 1987;52:1071–1075. doi: 10.1016/S0006-3495(87)83301-5. [DOI] [PMC free article] [PubMed] [Google Scholar]
- 3.Yao V J, Spudich J L. Proc Natl Acad Sci USA. 1992;89:11915–11919. doi: 10.1073/pnas.89.24.11915. [DOI] [PMC free article] [PubMed] [Google Scholar]
- 4.Yan B, Takahashi T, Johnson R, Spudich J L. Biochemistry. 1991;30:10686–10692. doi: 10.1021/bi00108a012. [DOI] [PubMed] [Google Scholar]
- 5.Lin S L, Yan B. Protein Eng. 1997;10:197–206. doi: 10.1093/protein/10.3.197. [DOI] [PubMed] [Google Scholar]
- 6.Blanck A, Oesterhelt D, Ferrando E, Schegk E S, Lottspeich F. EMBO J. 1989;8:3963–3971. doi: 10.1002/j.1460-2075.1989.tb08579.x. [DOI] [PMC free article] [PubMed] [Google Scholar]
- 7.Ihara K, Umemura T, Katagiri I, Kitajima-Ihara T, Sugiyama Y, Kimura Y, Mukohata Y. J Mol Biol. 1999;285:163–174. doi: 10.1006/jmbi.1998.2286. [DOI] [PubMed] [Google Scholar]
- 8.Shimono K, Iwamoto M, Sumi M, Kamo N. Photochem Photobiol. 2000;72:141–145. doi: 10.1562/0031-8655(2000)072<0141:eotcaa>2.0.co;2. [DOI] [PubMed] [Google Scholar]
- 9.Oesterhelt D. Curr Opin Struct Biol. 1998;8:489–500. doi: 10.1016/s0959-440x(98)80128-0. [DOI] [PubMed] [Google Scholar]
- 10.Kochendoerfer G G, Mathies R A. Isr J Chem. 1996;35:211–226. [Google Scholar]
- 11.Teuchner K, Schulz-Evers M, Leupold D, Strehlow D, Rüdiger W. Chem Phys Lett. 1997;268:157–162. [Google Scholar]
- 12.Baltuska A, van Stokkum I H M, Kroon A, Monshouwer R, Hellingwerf K J, van Grondelle R. Chem Phys Lett. 1997;270:263–266. [Google Scholar]
- 13.Polland H-J, Franz M A, Zinth W, Kaiser W, Kölling E, Oesterhelt D. Biophys J. 1986;49:651–662. doi: 10.1016/S0006-3495(86)83692-X. [DOI] [PMC free article] [PubMed] [Google Scholar]
- 14.Dobler J, Zinth W, Kaiser W, Oesterhelt D. Chem Phys Lett. 1988;144:215–220. [Google Scholar]
- 15.Arlt T, Schmidt S, Zinth W, Haupts U, Oesterhelt D. Chem Phys Lett. 1995;241:559–565. [Google Scholar]
- 16.Mathies R A, Cruz C H, Pollard W T, Shank C V. Science. 1988;240:777–779. doi: 10.1126/science.3363359. [DOI] [PubMed] [Google Scholar]
- 17.Ye T, Friedman N, Atkinson G H, Sheves M, Ottolenghi M, Ruhman S. J Phys Chem. 1999;103:5122–5130. [Google Scholar]
- 18.Hasson K C, Gai F, Anfinrud P A. Proc Natl Acad Sci USA. 1996;93:15124–15129. doi: 10.1073/pnas.93.26.15124. [DOI] [PMC free article] [PubMed] [Google Scholar]
- 19.Hohenfeld I P, Wegener A A, Engelhard M. FEBS Lett. 1999;442:198–202. doi: 10.1016/s0014-5793(98)01659-7. [DOI] [PubMed] [Google Scholar]
- 20.Patenge N, Haase A, Bolhuis H, Oesterhelt D. Mol Microbiol. 2000;36:105–113. doi: 10.1046/j.1365-2958.2000.01831.x. [DOI] [PubMed] [Google Scholar]
- 21.Ferrando-May E, Brustmann B, Oesterhelt D. Mol Microbiol. 1993;9:943–953. doi: 10.1111/j.1365-2958.1993.tb01224.x. [DOI] [PubMed] [Google Scholar]
- 22.Krebs M P, Spudich E N, Spudich J L. Protein Expression Purif. 1995;6:780–788. doi: 10.1006/prep.1995.0009. [DOI] [PubMed] [Google Scholar]
- 23.Hartl I, Zinth W. Opt Commun. 1999;160:184–190. [Google Scholar]
- 24.Huber R, Spörlein S, Moser J E, Grätzel M, Wachtveitl J. J Phys Chem. 2000;104:8995–9003. [Google Scholar]
- 25.Wilhelm T, Piel J, Riedle E. Opt Lett. 1997;22:1474–1476. doi: 10.1364/ol.22.001494. [DOI] [PubMed] [Google Scholar]
- 26.Lochbrunner S, Huppmann P, Riedle E. Opt Commun. 2000;184:321–328. [Google Scholar]
- 27.Strickler S J, Berg R A. J Chem Phys. 1962;37:814–822. [Google Scholar]
- 28.Rath P, Spudich E, Neal D D, Spudich J L, Rothschild K J. Biochemistry. 1996;35:6690–6696. doi: 10.1021/bi9600355. [DOI] [PubMed] [Google Scholar]
- 29.Chizhov I, Schmies G, Seidel R, Sydor J R, Lüttenberg B, Engelhard M. Biophys J. 1998;75:999–1009. doi: 10.1016/S0006-3495(98)77588-5. [DOI] [PMC free article] [PubMed] [Google Scholar]
- 30.Kochendoerfer G G, Mathies R A. J Phys Chem. 1996;100:14526–14532. [Google Scholar]
- 31.Logunov S L, Masciangioli M, Kamalov V F, El-Sayed M A. J Phys Chem. 1998;102:2303–2306. [Google Scholar]
- 32.Logunov S L, El-Sayed M A, Lnyi J K. Biophys J. 1996;71:1545–1553. doi: 10.1016/S0006-3495(96)79357-8. [DOI] [PMC free article] [PubMed] [Google Scholar]
- 33.Hamm P, Zurek M, Röschinger T, Patzelt H, Oesterhelt D, Zinth W. Chem Phys Lett. 1996;263:613–621. [Google Scholar]
- 34.Yamaguchi S, Hamaguchi H. J Chem Phys. 1998;109:1397–1408. [Google Scholar]
- 35.Imamoto Y, Shichida Y, Hirayama J, Tomioka H, Kamo N, Yoshizawa T. Photochem Photobiol. 1992;56:1129–1134. [Google Scholar]
- 36.Losi A, Braslavsky S E, Gärtner W, Spudich J L. Biophys J. 1999;32:2183–2191. doi: 10.1016/S0006-3495(99)77373-X. [DOI] [PMC free article] [PubMed] [Google Scholar]


