

Abstract
Excitatory and inhibitory (EI) interactions shape network activity. However, little is known about the EI interactions in pathological conditions such as epilepsy. To investigate EI interactions during seizure-like events (SLE), we performed simultaneous dual and triple whole-cell and extracellular recordings in pyramidal cells and oriens interneurons in rat hippocampal CA1. We describe a novel pattern of interleaving EI activity during spontaneous in vitro SLEs generated by the potassium channel blocker 4-aminopyridine in the presence of decreased magnesium. Interneuron activity was increased during interictal periods. During ictal discharges interneurons entered into long-lasting depolarization block (DB) with suppression of spike generation; simultaneously, pyramidal cells produced spike trains with increased frequency (6–14Hz) and correlation. Following this period of runaway excitation, interneuron post-ictal spiking resumed and pyramidal cells became progressively quiescent. We performed correlation measures of cell-pair interactions using either the spikes alone or the subthreshold postsynaptic interspike signals. EE spike correlation was notably increased during interneuron DB, while subthreshold EE correlation decreased. EI spike correlations increased at the end of SLEs, while II subthreshold correlations increased during DB. Our findings underscore the importance of complex cell-type specific neuronal interactions in the formation of seizure patterns.
Keywords: hippocampus, epilepsy, inhibition, excitation, correlation
Introduction
Epileptic seizures are often described as “hypersynchronous” events arising from decreased inhibition with excessive excitation (Penfield and Jasper 1954; Wyler and Ojemann 1982; Westbrook 1991). However, inhibition is retained in samples from human epileptics (Babb et al. 1989; During and Spencer 1993; Menendez de la Prida et al. 2002), and interneuron activity is essential for the generation of in vitro epileptiform activity in human (Cohen et al. 2002) and animal (Higashima et al. 1996; Avoli et al. 1996a; Lopantsev and Avoli 1998; Velazquez and Carlen 1999; Fujiwara-Tsukamoto et al. 2004) tissue. Additionally, EEG (Schiff et al. 2005) and in vitro synaptic currents (Netoff and Schiff 2002) suggest that seizures may not be characterized by a straightforward synchrony increase.
Previous in vitro studies of intracellular excitatory-inhibitory (EI) interplay focused primarily on stimulation-induced epileptiform activity (Perez-Velazquez and Carlen 1999; Perez-Velazquez 2003; Fujiwara-Tsukamoto et al. 2004, 2005). In these paradigms, tetanic stimulation replaced pre-ictal and ictal onset dynamics and the resulting afterdischarges demonstrated synchronous activation of inhibitory and excitatory cells (Fujiwara-Tsukamoto et al. 2004). However, we know little about EI interactions and synchrony during spontaneous pre-ictal, ictal, and post-ictal events.
To investigate EI, excitatory-excitatory (EE), and inhibitory-inhibitory (II) interactions in robust seizure-like events (SLEs), we used a 4-aminopyridine (4-AP) and decreased magnesium seizure model. Simultaneous dual and triple whole-cell recordings of inhibitory oriens interneurons and excitatory pyramidal cells, along with extracellular potential measurements, were performed in the CA1 of rat hippocampal slices. We report a novel pattern of EI activity interplay during these spontaneous SLEs.
Methods
Animals
Experiments were performed on Sprague Dawley rats (P18–P35) with a George Mason University approved protocol.
Electrophysiology
Animals were anesthetized with diethyl-ether, decapitated, brains were removed, hippocampi isolated, and transverse 350μm sections cut in cold dissection buffer (in mM: 2.6 KCl, 1.23 NaH2PO4, 24 NaHCO3, 0.1 CaCl2, 2 MgCl2, 205 sucrose, 20 glucose) using a vibratome.
Slices were incubated for an hour in artificial cerebrospinal fluid (ACSF; pH 7.3, 30°C, in mM: 130 NaCl, 0.6 MgSO4, 3.5 KCl, 1.2 CaCl2, 10 glucose, 2.5 NaH2PO4, 24 NaHCO3) aerated with 95%O2-5%CO2, transferred to a submersion recording chamber (Warner Instruments) and perfused (1ml/min, 34°C). Borosilicate glass micropipettes (4–7 MΩ) for current clamp recordings contained (in mM): 116 K gluconate, 6 KCl, 0.5 EGTA, 20 HEPES, 10 phosphocreatine, 0.3 NaGTP, 2 NaCl, 4 MgATP, and 0.3% Neurobiotin (pH 7.25, 295mOsm). Extracellular recordings were performed with micropipettes (1–3 MΩ, 0.9% NaCl).
Alignment of the seizure start times was based on an identifiable feature of the extracellular recording - the fast positive extracellular shift (FPES, 1–5mV, Fig. 1D). Oriens interneurons (Supplementary Materials) were targeted because of their importance and vulnerability in epilepsy (Oliva et al. 2002; Santhakumar and Soltezs, 2004; Sanon et al., 2005), and their role in network synchronization (Pike et al. 2000; Gillies et al. 2002). Seven of 12 interneurons that underwent depolarization block (DB) displayed orienslacunosum moleculare (OLM) interneuron membrane characteristics and bipolar horizontal dendritic morphology (Maccaferri and McBain 1996; Maccaferri and Lacaille 2003, Supplementary Materials). Cells selected for patching were 30–200μm apart (average 122μm). An extracellular electrode was placed in the pyramidale near the patched cells. A subset of experiments was performed after isolating CA1 (n=13) by making cuts from alveus to moleculare lacunosum on each side of CA1. Recordings were performed using Axoclamp 2B and 2A, MCC 700 (Molecular Devices), and Grass P16 amplifiers, filtered (5KHz whole-cell, 1KHz extracellular), and digitized at 10KHz (Digidata and Pclamp7, Molecular Devices).
Figure 1. Analysis of the SLEs in pyramidal cell pairs.
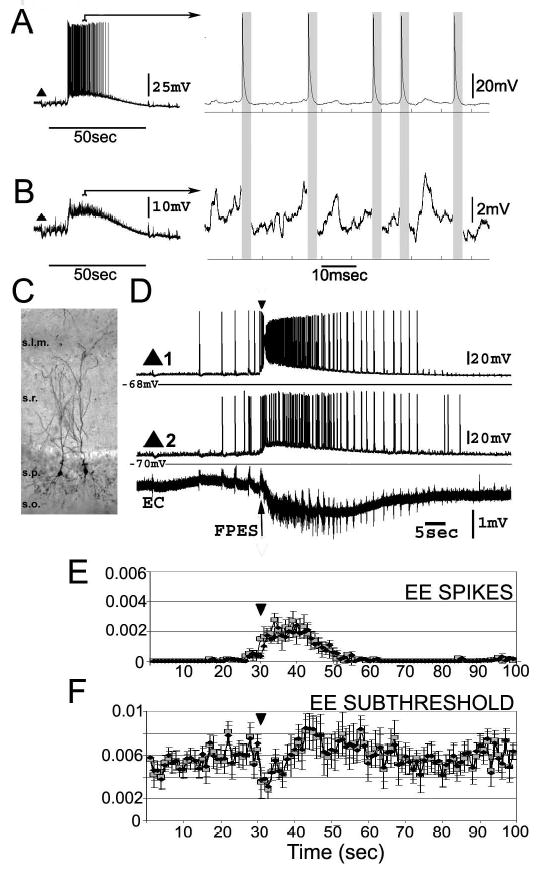
A. Left trace shows the complete voltage signal recorded from a pyramidal cell during SLE; right contains an expanded excerpt from the left. B. Examples of the same signal as in A with the spikes removed (regions in gray boxes). The residual interspike voltage signal was used for subthreshold correlation analysis. C. Photomicrograph of two neurobiotin filled pyramidal cells in the CA1. s. - stratum; l.m. - lacunosum moleculare; r. - radiatum; p. -pyramidale; o. - oriens. D. Whole-cell recordings from two pyramidal cells (triangles) and an extracellular electrode (EC). Following some pre-ictal spikes, pyramidal cells fire a prolonged burst of spikes riding on a wave of intracellular depolarization (ictal event), followed by post-ictal spikes of decaying frequency. The inverted triangle (30sec., D and E) is aligned with the FPESs used to denote the start of the ictal events. E. The crosscorrelation between each pair was measured within one-second nonoverlapping windows beginning 30 seconds before until 70 seconds after the FPES. Graphs of crosscorrelation values for spikes (top) and subthreshold voltages (bottom). Black diamonds represent unweighted pooled and gray squares weighted resampled averages. ANOVA results for one-second windows showed that crosscorrelation values for subthreshold voltages (df=7199, F=1.38, p=0.0083 for unweighted) and for the spikes (df=7199, F=14.72, p<0.0001) significantly changed across the evolution of SLEs. Tukey multiple comparison tests (p<0.001 for unweighted and p<0.05 for weighted averages) confirmed that correlation values at the start of the ictal event (inverted triangle mark) significantly decreased for the subthreshold voltages and increased for the spikes.
SLEs appeared following 100μM bath-application of 4-AP (Sigma) and raising the temperature to 36°C. Increasing concentrations of 4-AP were used (up to 200μM) if SLE formation was not observed within 20 min. We fortuitously discovered that decreasing the Mg concentration to 0.6 mM, although insufficient by itself to promote SLEs, had a profound affect on prolonging 4-AP induced SLEs. 4-AP increases inhibitory and excitatory signaling (Avoli et al. 1988, 1996b; Somjen 2004), while decreased Mg partially removes n-methyl-d-aspartate (NMDA) receptor blockade and divalent charge screening. A similar strategy employs elevated potassium with decreased magnesium (Khosravani et al. 2003, 2005; Isaev et al 2005).
Histochemistry
Neurobiotin filled cells were reconstructed with camera lucida (Fig. 2A and Supplementary Material). For the cells that exhibited DB, the outline of the slices and stratum pyramidale were drawn using camera lucida and overlaid (to the best fit) in Photoshop (Adobe; Fig. 2E).
Figure 2. EI interplay during SLEs.
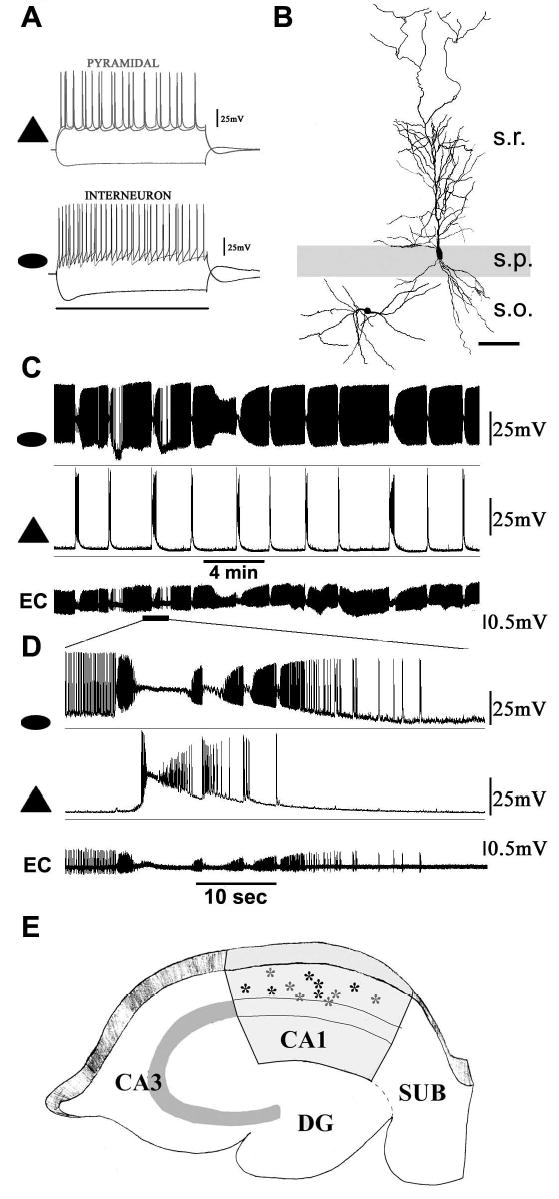
A. Examples of pyramidal (triangle) and oriens interneuron (ellipse) membrane properties following 500 msec (scale bar) negative and positive current injections. B. Camera lucida microscope drawings of the dendrites of the cells in A. s. - stratum; o. - oriens; p - pyramidale; r - radiatum. Scale bar - 50μm. C. Repetitive SLEs and EI interplay. The interneuron (ellipse) is more active in 4-AP than the pyramidal (triangle) cell. EC denotes a fortuitous extracellular single unit recording of action potentials from the axon of this interneuron. The EC electrode was placed in oriens, about 75μm from the interneuron soma. D. Expanded time base illustrating robust EI interplay during the SLEs. Note the cessation of axonal spikes in EC during interneuron DB. E. Locations of interneurons exhibiting DB. Horizontal and rounded interneuron somata were mapped following neurobiotin histochemistry. Gray stars indicate interneurons that underwent DB in isolated CA1.
Correlation analysis
To track the temporal evolution of EE and EI synchrony, two unbiased crosscorrelations were calculated using subthreshold membrane potentials and spike times of pairs of neurons over discrete time windows. We use crosscorrelation to infer the presence of synchronization (Netoff and Schiff 2002). Dual correlation analyses allowed us to compare synchrony in subthreshold inputs and suprathreshold neuronal outputs. Alternate methods to achieve a similar analysis used median filters to remove spikes (Mooney et al. 2001; Buonomano 2003), which alter the spectra and are less suitable for correlation measures.
For spike correlation, a simple threshold was used to identify discrete spike times. To measure subthreshold correlations, data between spike initiation and termination were discarded and correlations were performed using interspike data (Fig. 1A and 1B). The spike data gaps were retained, leaving the time relationships among the residual subthreshold voltages unchanged. This subthreshold activity reflects synaptic network inputs to the cells, as well as intrinsic voltage-gated subthreshold responses. In contrast, spike cross-correlation reflects neuronal output (Supplementary Material). We applied an estimate of the expected crosscorrelation variance given each time series’ autocorrelation and time length. Only statistically significant correlations, greater than two standard deviations of the expected value, were included in the analysis (full details in Supplementary Materials).
Statistical analysis
Averaged data representing spiking rates and crosscorrelation values are reported as mean ± standard deviation (s.d.). Analysis of variance (ANOVA) was used to determine whether the means of correlation measures from distinct SLE epochs were significantly different. Post-hoc Tukey multiple comparison tests (confidence limit p < 0.001) were performed following ANOVA. Because the number of SLEs measured per cell pair was variable (5–18), we also recalculated averages by randomly resampling to equalize the number of SLEs compared from each pair. Both pooled and resampled averages are reported.
Results
Recurrent SLEs (>15 sec ictal-like network events with extracellular potential shifts; Fig. 1A and 1D) were recorded in 30 neuronal pairs (18 dual and 4 triple) located in strata oriens and pyramidale, yielding over 250 SLEs for analysis. Qualitatively analogous SLEs were observed in experiments in which the CA1 region was surgically isolated (n=13 cells), suggesting that the excitatory Schaeffer collateral pathway is not necessary for local network SLE generation in the CA1 (Barbarosie and Avoli 1997; Netoff and Schiff 2002).
Pyramidal cells (n=35) fired at lower rates than interneurons prior to SLEs. Consistent early features of SLEs were a burst of pyramidal cell spikes (~1–3 seconds), coinciding with a FPES in the extracellular and intracellular potentials followed by a sustained negative extracellular shift (1–5mV, Fig. 1D). When multiple FPESs were seen, the final one just before the slow negative extracellular potential shift was selected as the temporal anchor point for subsequent analysis.
Sub- and suprathreshold crosscorrelation analyses of excitatory cell pairs (n=15) revealed qualitatively different results (Fig. 1E, 1F). Pyramidal cell spike output increased markedly during the SLEs (n = 15 pairs, 148 SLEs) and showed a considerable increase in spike crosscorrelation (Fig. 1E). In contrast, averaged subthreshold EE correlations (n=15 pairs; 148 SLEs) showed significantly decreased correlations at the start of the ictal-like event (Fig. 1F). This finding is consistent with previous results in which voltage-activated conductances during similar recordings were blocked (Netoff and Schiff 2002).
In the presence of 4-AP, oriens interneurons were more active and fired at higher frequencies than concurrently recorded pyramidal cells (Figs. 2–3). During SLEs, the interneurons and pyramidal cells exhibited a robust spiking interplay (Fig. 2), which took place over substantially longer time scales compared to the interplay seen in interictal bursts (Supplementary Fig. 1).
Figure 3. EI interplay during SLEs.
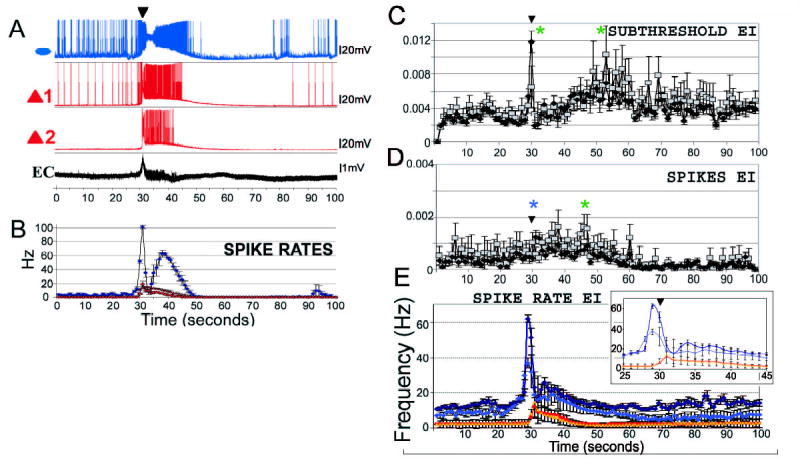
A. Traces from simultaneous whole-cell measurements from one interneuron (blue, ellipse) and two pyramidal cells (red, triangles), and an extracellular DC mode recording (EC). Inverted black triangles denote the FPESs. B. Average spike rates of the three cells (interneuron - blue circles, pyramidal 1 - red diamonds, pyramidal 2 - red triangles). Note that the plot in B is an average (n=8 SLEs in the experiment), and hence is not precisely time locked to the single SLE example shown in A. C. EI crosscorrelation averages. The means of EI subthreshold crosscorrelation values were significantly different (ANOVA: df=10199, F=4.27, p<0.0001) at distinct SLE stages (Tukey multicomparison, green asterisks). Unweighted pooled subthreshold EI crosscorrelation values (represented as black diamonds) peaked at the onset of SLEs, followed by a decrease, and then a gradual increase towards the end of the SLEs (Tukey multiple comparison test, p<0.001). With weighted resampled averages (gray squares) the peak at the onset of SLEs was less prominent, but the significance of the increase in subthreshold EI correlations was retained (p<0.05). Inverted black triangles denote the FPESs in C, D, inset in E. D. A significant increase in EI spike correlations was observed at the beginning (unweighted, blue asterisk) and following the DB in interneurons (weighted averages, green asterisk). (ANOVA, df=10199, F=3.27, p<0.0001; Tukey multiple comparison test, p<0.001 for unweighted (black diamonds) and p<0.005 for weighted resampled (gray squares) averages). E. Cumulative average spike rates (n=15 oriens interneurons and n=40 pyramidal cells from pairs and single whole cell recordings). Note the peak of inhibitory spiking preceding the FPES (dark blue – I unweigthed pooled; light blue – I weighted resampled). Excitatory firing rates increase as interneurons enter into the DB and decreased as interneurons exit the DB (red – E unweigthed pooled; orange - unweigthed pooled). Inset shows average spike rates at expanded time scale.
Interneuron firing rates peaked at 62 Hz just prior to entering into the long-lasting (5–40 sec) DB within the ictal discharge. DB was characterized by transmembrane potential depolarization (to −40 to −10 mV) and the inactivation of action potential generating mechanisms (Bragin et al. 1997; Bikson et al. 2003; Somjen 2004). DB was observed in 12 horizontal interneurons located in stratum oriens and the pyramidale-oriens layer border (Fig. 2E). Depolarization block was rarely pronounced in pyramidal cells, and when observed was significantly shorter (< 2 sec) than in interneurons (Figs. 2D). As seen in Figs. 2–3, pyramidal cells produced sustained barages of spikes during interneuron DB, typically firing 6–15 spikes per second (average 8.28 spikes for the first 5 seconds of the ictal event). Note the fortuitous extracellular single unit recording from the axon of the interneuron in Figure 2(C and D), confirming cessation of inhibitory spiking during DB. SLE termination was accompanied by the return of interneuron activity as pyramidal cells became progressively quiescent.
Figure 3 shows an example of simultaneous EE and EI interactions during a triple whole-cell and extracellular recording of a spontaneous SLE and the respective average (n=8 SLEs) firing rates. This example illustrates that the firing rates of the two recorded pyramidal cells changed together, with peak firing rates at the onset and sustained high firing rates during the interneuron DB.
Analysis of 102 SLEs from EI pairs are shown in Figures 3C-E (n=12 pairs). There was an increase in EI subthreshold correlations at the beginning and towards the end of the interneuron DB. With resampling, the increase in subthreshold correlations towards the end of the SLEs was the most robust feature (Fig. 3C).
A significant increase in EI spike correlations was observed at the beginning (unweighted) and towards the end of the SLEs (weighted averages; about 45 seconds, Fig. 3D). These EI subthreshold and spike findings are consistent with the fact that pyramidal cells and interneurons were active together at the onset and offset of the depolarization block.
The spike rate averages (n=12 pairs, 102 SLEs) in Figure 3E show a consistent robust sequence starting with intense interneuron firing, followed by a peak in pyramidal cell firing during interneuron DB, and concluding with the return of intense inhibitory firing as pyramidal activity decays. The terminal decay in pyramidal cell firing frequency is associated with the second peak and sustained firing in interneurons recovering from the block (about 35 seconds, Fig. 3E and inset).
Figure 4 shows an example of two interneurons participating in a SLE. Although spiking activity ceased as both interneurons entered DB, subthreshold correlation values nevertheless increased (n=13 SLEs, 3 pairs). The finding that pyramidal cell spike correlations are increased during interneuron DB (Fig. 3C) is consistent with synchronous excitation contributing to the subthreshold II correlations during their DB. In contrast, the loss of inhibitory spike outputs are consistent with the decrease in EE subthreshold correlations during DB (Fig. 1F).
Figure 4. II activity during SLEs.
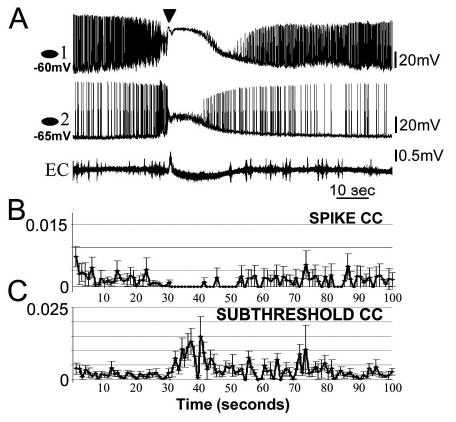
A. Whole cell measurements from two oriens interneurons accompanied by the average cross correlation (CC) measures of suprathreshold (B) and sub-threshold (C) signals (n=13 SLEs, 3 pairs). Inverted triangle indicates the FPES. Note the clear loss of spiking and increase in subthreshold correlations during DB in II pairs (unweighted averages).
Discussion
Our fundamental finding is the novel interleaved spiking pattern between pyramidal cells and interneurons during spontaneous in vitro hippocampal seizure-like events. Our analysis of spike output between EI pairs revealed that pyramidal cells and interneurons became activated at different times during SLEs. Oriens interneurons were more active at SLE onset, followed by a period of DB during which pyramidal cells exhibited runaway excitation. SLE termination was characterized by the oriens interneurons emerging from DB into progressively more active spiking and the simultaneous gradual reduction of pyramidal cell spiking.
Neuronal interplay and depolarization block may have been first observed in pioneering in vivo studies of single intracellular neocortical and hippocampal seizure recordings from untyped cells (Kandel and Spencer 1961; Matsumoto and Marsan 1964). More recently, a strong inhibitory component of seizures with increased inhibitory spiking before and after paroxysmal discharges was observed in single intracellular in vivo recordings from fast spiking putative interneurons (Timofeev et al. 2002). Additional recent in vivo observations have clearly shown that precisely interleaved activity of subpopulations of inhibitory cells coordinate normal hippocampal theta rhythms and sharp waves (Klausberger et al. 2003).
Examples of in vitro EI interplay have been observed in spontaneous bursts with elevated K+ (Aradi and Maccaferri 2004). We have also observed similar activity in our preparation (Supplementary Fig. 1), and have observed that the spontaneous SLEs in our solution retained features of the burst EI interplay, but at the much longer time scale of seizures. This is in contrast to tetanically stimulated seizure-like afterdischarges that show an apparent EI synchronization (Perez-Velazquez and Carlen 1999; Fujiwara-Tsukamoto et al. 2004). We are aware of no other observations of such EI interactions during spontaneous SLEs.
In our work we explicitly calculated the correlation between distinct neuronal subtypes. We found that correlations during SLEs depended qualitatively upon whether subthreshold or spike information was considered. During the SLE onset, we observed a decrease in the subthreshold input correlation among EE pairs. This finding is consistent with our previous work in which we pharmacologically suppressed active conductances (Netoff et al. 2002). EE spike output correlation, on the other hand, increased during SLEs. Similar increases in spike correlation were observed in vivo between nearby putative neocortical pyramidal cells (Timofeev et al. 2004).
It remains to be explained how hippocampal pyramidal cells, with sparse associational connections, exhibit prominent spike synchronization in the setting of decreased subthreshold correlations. It is possible that such spikes synchronize through their ephaptic electric fields (Traub 1985a,b) or through gap junction connectivity between the axons of pyramidal cells (Draguhn et al. 1998). These effects are likely to be more effective when interneurons coordinate their DB activity via their own gap junctions (Zhang et al. 2004), thus releasing the pyramidal cells from inhibition concurrently. Indeed, our preliminary evidence suggests that the gap junction blocker carbenoxolone in our preparation blocks SLEs, and at low concentrations, shortens DB in interneurons (Supplementary Figure 2).
In contrast to EE, EI correlation was elevated at the beginning and end of SLEs. These findings are consistent with the fact that EI spike synchrony can only occur when both populations of cells are firing – at the beginning and towards the end of inhibitory DB. The loss of inhibitory spikes during DB is coincident with the simultaneous decrease in pyramidal cell subthreshold EE synchronization. Lastly, subthreshold II correlation increased while the interneurons in DB stopped firing and pyramidal cell spike correlation increased. We suggest that correlated EE spiking during interneuron DB delivers synchronous synaptic currents to interneurons at a time during which they are unable to respond by spiking.
Nonetheless, we are cautious in evaluating data following spike extraction. The residual subthreshold time series likely undersampled synaptic currents that are coincident with spike generation, potentially leading to a spurious decrease in subthreshold EE correlation. However, our results are consistent with earlier findings during active conductance blockade (Netoff et al. 2002). It may be possible that overestimation of correlation due to the presence of active membrane conductances, and underestimation through time series undersampling following spike extraction, may have had partially offset each other.
Although, synchrony has often been implicated in seizure generation (Westbrook 1991), we are cautious in our interpretation of the observed correlation patterns in our experiments. Despite consistent patterns of correlation changes in the SLEs, we cannot infer a causal role for synchrony in orchestrating the neuronal interplay observed. Furthermore, it remains unknown what synchronization and neuronal interplay patterns will be observed in other in vitro and endogenous in vivo seizures when similarly examined.
Previous work has shown that following stimulation, chloride loading inside pyramidal cells causes inhibition to become excitatory (Fujiwara-Tsukamoto et al. 2004, 2005). It is possible that excessive inhibitory activity at the start of our SLEs became excitatory in its effects on pyramidal cells. Preliminary voltage clamp observations (Ziburkus et al. 2005) suggest that not only pyramidal cells but interneurons as well may have elevated intracellular chloride in this model.
Most of our recorded interneurons resembled O-LM cells in their membrane properties (Fig. 2A) and horizontally oriented dendritic projections (Fig. 2B). O-LM cells also constitute the overwhelming majority of the oriens interneurons (Freund and Buzsaki 1996; Somogyi and Klausberger 2005). Nevertheless, we recognize that we likely included interneurons other than O-LM cells in our sampling.
Although seizures have traditionally been treated as monolithic entities – ictal versus non-ictal – there is little to support this notion. Our findings suggest that the interplay of cellular activity supports a natural partitioning of these in vitro SLEs into stages. The motif of excessive inhibition, subsequent inhibitory breakdown through DB, and the concurrent increase in excitatory output could underlie some of the structured patterns seen in EEGs during seizures. In recent work, discrimination of human scalp and intracranially recorded seizures into at least 3 dynamical stages was shown (Schiff et al. 2005). The experimental findings in this present report illustrate a set of cellular interactions that underlie the evolution of stages in these in vitro SLEs. It will remain a challenge to identify the relevant cellular mechanisms that underlie the evolution of endogenous seizure stages in vivo. Finally, if inhibitory and excitatory cell types fire at different times during seizures, then our findings suggest several novel therapeutic targets for seizure control, including blocking excessive inhibitory network activity and preventing depolarization block.
Supplementary Material
Acknowledgments
We are grateful to G. Buzsaki, R. Traub, T. Netoff, and S. L. Weinstein for helpful discussions.
Footnotes
Grants: Supported by NIH grants R01MH50006 (SJS), K02MH01493 (SJS), K25MH01963 (EB), and a grant from the Epilepsy Foundation (JŽ).
Disclosures: None
References
- Aradi I, Maccaferri G. Cell type-specific synaptic dynamics of synchronized bursting in the juvenile CA3 rat hippocampus. J Neurosci. 2004;24:9681–92. doi: 10.1523/JNEUROSCI.2800-04.2004. [DOI] [PMC free article] [PubMed] [Google Scholar]
- Avoli M, Barbarosie M, Lucke A, Nagao T, Lopantsev V, Kohling R. Synchronous GABA-mediated potentials and epileptiform discharges in the rat limbic system. J Neurosci. 1996a;16:3912–3924. doi: 10.1523/JNEUROSCI.16-12-03912.1996. [DOI] [PMC free article] [PubMed] [Google Scholar]
- Avoli M, Louvel J, Kurcewicz I, Pumain R, Barbarosie M. Extracellular free potassium and calcium during synchronous activity induced by 4-aminopyridine in the juvenile rat hippocampus. J Physiol. 1996b;493:707–717. doi: 10.1113/jphysiol.1996.sp021416. [DOI] [PMC free article] [PubMed] [Google Scholar]
- Avoli M, Perreault P, Olivier A, Villemure JG. 4-Aminopyridine induces a long-lasting depolarizing GABA-ergic potential in human neocortical and hippocampal neurons maintained. Neurosci Lett. 1988;943:27–332. doi: 10.1016/0304-3940(88)90039-0. [DOI] [PubMed] [Google Scholar]
- Babb TL, Pretorius JK, Kupfer WR, Crandall PH. Glutamate decarboxylase immunoreactive neurons are preserved in human epileptic hippocampus. J Neurosci. 1989;7:2562–2574. doi: 10.1523/JNEUROSCI.09-07-02562.1989. [DOI] [PMC free article] [PubMed] [Google Scholar]
- Barbarosie M, Avoli M. CA3-driven hippocampal-entorhinal loop controls rather than sustains limbic seizures. J Neurosci. 1997;17:9308–9314. doi: 10.1523/JNEUROSCI.17-23-09308.1997. [DOI] [PMC free article] [PubMed] [Google Scholar]
- Bikson M, Hahn PJ, Fox JE, Jefferys JG. Depolarization block of neurons during maintenance of electrographic seizures. J Neurophysiol. 2003;90:2402–2408. doi: 10.1152/jn.00467.2003. [DOI] [PubMed] [Google Scholar]
- Bragin A, Penttonen M, Buzsaki G. Termination of epileptic afterdischarge in the hippocampus. J Neurosci. 1997;17:2567–2579. doi: 10.1523/JNEUROSCI.17-07-02567.1997. [DOI] [PMC free article] [PubMed] [Google Scholar]
- Buonomano DV. Timing of neural responses in cortical organotypic slices. Proc Natl Acad Sci. 2003;100:4897–902. doi: 10.1073/pnas.0736909100. [DOI] [PMC free article] [PubMed] [Google Scholar]
- Cohen I, Navarro V, Clemenceau S, Baulac M, Miles R. On the origin of interictal activity in human temporal lobe epilepsy. Science. 2002;298:1418–1421. doi: 10.1126/science.1076510. [DOI] [PubMed] [Google Scholar]
- Draguhn A, Traub RD, Schmitz D, Jefferys JGR. Electrical coupling underlies high-frequency oscillations in the hippocampus in vitro. 1998;394:189–192. doi: 10.1038/28184. [DOI] [PubMed] [Google Scholar]
- During M, Spencer DD. Extracellular hippocampal glutamate and spontaneous seizure in the conscious human brain. Lancet. 1993;341:1607–1610. doi: 10.1016/0140-6736(93)90754-5. [DOI] [PubMed] [Google Scholar]
- Freund TF, Buzsaki G. Interneurons of the hippocampus. Hippocampus. 1996;6:347–470. doi: 10.1002/(SICI)1098-1063(1996)6:4<347::AID-HIPO1>3.0.CO;2-I. [DOI] [PubMed] [Google Scholar]
- Fujiwara-Tsukamoto Y, Isomura Y, Kaneda K, Takada M. Synaptic interactions between pyramidal cells and interneurone subtypes during seizure-like activity in the rat hippocampus. J Physiol. 2004;557:961–979. doi: 10.1113/jphysiol.2003.059915. [DOI] [PMC free article] [PubMed] [Google Scholar]
- Fujiwara-Tsukamoto Y, Isomura Y and Takada M. Comparable GABAergic mechanisms of hippocampal seizure-like activity in post-tetanic and low-Mg2+ conditions. J Neurophysiol. 2005 Dec 7; [Epub ahead of print] [DOI] [PubMed]
- Gillies MJ, Traub RD, LeBeau FE, Davies CH, Gloveli T, Buhl EH, Whittington MA. A model of atropine-resistant theta oscillations in rat hippocampal area CA1. J Physiol. 2002;543:779–793. doi: 10.1113/jphysiol.2002.024588. [DOI] [PMC free article] [PubMed] [Google Scholar]
- Higashima M, Kinoshita H, Yamaguchi N, Koshino Y. Activation of GABAergic function necessary for afterdischarge generation in rat hippocampal slices. Neurosci Lett. 1996;207:101–104. doi: 10.1016/0304-3940(96)12496-4. [DOI] [PubMed] [Google Scholar]
- Isaev D, Isaeva E, Khazipov R, Holmes GL. Anticonvulsant action of GABA in the high potassium-low magnesium model of ictogenesis in the neonatal rat hippocampus in vivo and in vitro. J Neurophysiol. 2005;94:2987–92. doi: 10.1152/jn.00138.2005. [DOI] [PubMed] [Google Scholar]
- Kandel ER, Spencer WA. Excitation and inhibition of single pyramidal cells during hippocampal seizure. Exp Neurol. 1961;4:162–179. doi: 10.1016/0014-4886(61)90038-3. [DOI] [PubMed] [Google Scholar]
- Khosravani H, Carlen PL, Perez Velazquez JL. The Control of Seizure-Like Activity in the Rat Hippocampal Slice. Biophysical Journal. 2003;84:687–695. doi: 10.1016/S0006-3495(03)74888-7. [DOI] [PMC free article] [PubMed] [Google Scholar]
- Khosravani H, Pinnegar CR, Mitchell JR, Bardakjian BL, Federico P, Carlen PL. Increased high-frequency oscillations precede in vitro low-Mg seizures. Epilepsia. 2005;46:1188–97. doi: 10.1111/j.1528-1167.2005.65604.x. [DOI] [PubMed] [Google Scholar]
- Klausberger T, Magill PJ, Marton LF, Roberts JDB, Cobden PM, Buzsaki G, Somogyi P. Brain-state- and cell-type-specific firing of hippocampal interneurons in vivo. Nature. 2003;421:844–848. doi: 10.1038/nature01374. [DOI] [PubMed] [Google Scholar]
- Lopantsev V, Avoli M. Participation of GABAa- mediated inhibition in ictal-like discharges in the rat entorhinal cortex. J Neurophysiol. 1998;79:352–60. doi: 10.1152/jn.1998.79.1.352. [DOI] [PubMed] [Google Scholar]
- Maccaferri G, McBain CJ. The hyperpolarization-activated current (Ih) and its contribution to pacemaker activity in rat CA1 hippocampal stratum oriens-alveus interneurones. J Physiol. 1996;497:119–130. doi: 10.1113/jphysiol.1996.sp021754. [DOI] [PMC free article] [PubMed] [Google Scholar]
- Maccaferri G, Lacaille JC. Interneuron Diversity series: Hippocampal interneuron classifications -making things as simple as possible, not simpler. Trends Neurosci. 2003;26:564–71. doi: 10.1016/j.tins.2003.08.002. [DOI] [PubMed] [Google Scholar]
- Menendez de la Prida L, Benavides-Piccione R, Sola R, Pozo MA. Electrophysiological properties of interneurons from intraoperative spiking areas of epileptic human temporal neocortex. Neuroreport. 2002;13:1421–1425. doi: 10.1097/00001756-200208070-00015. [DOI] [PubMed] [Google Scholar]
- Mooney R, Hoese W, Nowicki S. Auditory representation of the vocal repertoire in a songbird with multiple song types. Proc Natl Acad Sci. 2001;98:12778–83. doi: 10.1073/pnas.221453298. [DOI] [PMC free article] [PubMed] [Google Scholar]
- Netoff TI, Schiff SJ. Decreased neuronal synchronization during experimental seizures. J Neurosci. 2002;22:7297–7307. doi: 10.1523/JNEUROSCI.22-16-07297.2002. [DOI] [PMC free article] [PubMed] [Google Scholar]
- Oliva AA, Jr, Lam TT, Swann JW. Distally directed dendrotoxicity induced by kainic acid in hippocampal interneurons of green fluorescent protein-expressing transgenic mice. J Neurosci. 2002;22:8052–62. doi: 10.1523/JNEUROSCI.22-18-08052.2002. [DOI] [PMC free article] [PubMed] [Google Scholar]
- Penfield W and Jasper H. Epilepsy and the functional anatomy of the human brain. Boston, MA: Little, Brown & Co., 1954.
- Perez-Velazquez JL, Carlen PL. Synchronization of GABAergic interneuronal networks during seizure-like activity in the rat horizontal hippocampal slice. Eur J Neurosci. 1999;11:4110–4118. doi: 10.1046/j.1460-9568.1999.00837.x. [DOI] [PubMed] [Google Scholar]
- Perez-Velazquez JL. Bicarbonate-dependent depolarizing potentials in pyramidal cells and interneurons during epileptiform activity. Eur J Neurosci. 2003;18:1337–1342. doi: 10.1046/j.1460-9568.2003.02843.x. [DOI] [PubMed] [Google Scholar]
- Pike FG, Goddard RS, Suckling JM, Ganter P, Kasthuri N, Paulsen O. Distinct frequency preferences of different types of rat hippocampal neurones in response to oscillatory input currents. J Physiol. 2000;529:205–213. doi: 10.1111/j.1469-7793.2000.00205.x. [DOI] [PMC free article] [PubMed] [Google Scholar]
- Sanon N, Carmant L, Emond M, Congar P, Lacaille JC. Short-term Effects of Kainic Acid on CA1 Hippocampal Interneurons Differentially Vulnerable to Excitotoxicity. Epilepsia. 2005;46:837–48. doi: 10.1111/j.1528-1167.2005.21404.x. [DOI] [PubMed] [Google Scholar]
- Santhakumar V, Soltesz I. Plasticity of interneuronal species diversity and parameter variance in neurological diseases. Trends Neurosci. 2004;27:504–10. doi: 10.1016/j.tins.2004.06.002. [DOI] [PubMed] [Google Scholar]
- Schiff SJ, Sauer T, Kumar R, Weinstein SL. Neuronal Spatiotemporal Pattern Discrimination: The Dynamical Evolution of Seizures. NeuroImage. 2005;28:1043 – 1055. doi: 10.1016/j.neuroimage.2005.06.059. [DOI] [PMC free article] [PubMed] [Google Scholar]
- Somjen GG. Ions in the Brain. New York: Oxford University Press, 2004.
- Somogyi P, Klausberger T. Defined types of cortical interneurone structure, space and spike timing in the hippocampus. J Physiol. 2005;562:9–26. doi: 10.1113/jphysiol.2004.078915. [DOI] [PMC free article] [PubMed] [Google Scholar]
- Timofeev I, Grenier F, Steriade M. The role of chloride-dependent inhibition and the activity of fast-spiking neurons during cortical spike–wave electrographic seizures. Neurosci. 2002;114:1115–1132. doi: 10.1016/s0306-4522(02)00300-7. [DOI] [PubMed] [Google Scholar]
- Timofeev I, Grenier F, Steriade M. Contribution of intrinsic neuronal factors in the generation of cortically driven electrographic seizures. J Neurophysiol. 2004;92:1133–43. doi: 10.1152/jn.00523.2003. [DOI] [PubMed] [Google Scholar]
- Traub RD, Dudek FE, Taylor CP, Knowles WD. Simulation of hippocampal afterdischarges synchronized by electrical interactions. Neuroscience. 1985a;14:1033–1038. doi: 10.1016/0306-4522(85)90274-x. [DOI] [PubMed] [Google Scholar]
- Traub RD, Dudek FE, Snow RW, Knowles WD. Computer simulations indicate that electrical field effects contribute to the shape of the epileptiform field potential. Neuroscience. 1985b;15:947–58. doi: 10.1016/0306-4522(85)90245-3. [DOI] [PubMed] [Google Scholar]
- Westbrook GL. Seizures and epilepsy. In: Principles of Neural Science. Edited by Kandel ER, Jessell TM, Schwartz JH. New York: McGraw-Hill, 1991.
- Wyler AR, Ojemann GA, Ward AA. Neurons in human epileptic cortex: correlation between unit and EEG activity. Ann Neurol. 1982;11:301–308. doi: 10.1002/ana.410110311. [DOI] [PubMed] [Google Scholar]
- Zhang X-L, Zhang L, Carlen PL. Electrotonic coupling between stratum oriens interneurones in the intact mouse juvenile hippocampus. J Physiol. 2004;558:825–839. doi: 10.1113/jphysiol.2004.065649. [DOI] [PMC free article] [PubMed] [Google Scholar]
- Ziburkus J, Cressman JR, Johnson KE, Schiff SJ. Inhibitory and excitatory interplay: neuronal conductance measures during in vitro seizures. Epilepsia. 2005;46(Suppl 8):271–2. [Google Scholar]
Associated Data
This section collects any data citations, data availability statements, or supplementary materials included in this article.