

Abstract
Ion channels in the plasma membrane play critical roles in apoptosis. In a recent study we found that a voltage-dependent anion channel in the plasma membrane (VDACpl) of neuronal hippocampal cell line (HT22) cells was activated during apoptosis and that channel block prevented apoptosis. Whether or not VDACpl is identical to the mitochondrial VDACmt has been debated. Here, we biophysically characterize the apoptosis-inducing VDACpl and compare it with other reports of VDACpls and VDACmt. Excised membrane patches of apoptotic HT22 cells were studied with the patch-clamp technique. VDACpl has a large main-conductance state (400 pS) and occasionally subconductance states of ∼28 pS and 220 pS. The small subconductance state is associated with long-lived inactivated states, and the large subconductance state is associated with excision of the membrane patch and subsequent activation of the channel. The open-probability curve is bell shaped with its peak around 0 mV and is blocked by 30 μM Gd3+. The gating can be described by a symmetrical seven-state model with one open state and six closed or inactivated states. These channel properties are similar to those of VDACmt and other VDACpls and are discussed in relation to apoptosis.
INTRODUCTION
Apoptotic cell death is an essential process in the development of the central nervous system and in the pathogenesis of its degenerative diseases (1). Ion channels in the plasma membrane have been shown to play important roles at different stages of the apoptotic process. For instance efflux of K+ and Cl− ions from the intracellular side causes cell shrinkage and apoptosis (2–4). Blocking of certain channels prevents cell shrinkage and cell death, demonstrating these channels' direct involvement in the apoptotic process (3,4).
In a recent investigation (5), we reported that a voltage-dependent anion channel (VDAC) in the plasma membrane was critical for the apoptosis of a neuronal cell line (HT22). The apoptosis-inducing channel is mainly selective for Cl− and has a large conductance (400 pS) and a bell-shaped open-probability curve with respect to voltage, with its peak around 0 mV. These properties remind one of the VDAC originally found in the mitochondrion (VDACmt; 6), which is also related to porins in bacterial membranes (7). VDACmt is a β-sheet barrel with a large conductance, transporting relatively large molecules between the intermembrane space and the cytosol (6). It is also involved in early stages of certain forms of apoptotic cell death (8,9).
Because several VDAC-specific antibodies selectively labeled the apoptosis-inducing channel (5), this will hereafter be called VDACpl, even though the molecular identity is not proven. The channel was found to be silent in normal cells but highly active in cells undergoing apoptosis. Its critical role for neuronal apoptosis was shown by blocking the channel, either by the VDAC-specific antibodies or by high concentrations of sucrose, which prevented apoptosis. In control cells, VDACpl works as a ferricyanide reductase (10). This activity changes during apoptosis when the channel is activated (5), suggesting a dual role for the VDACpl—an enzymatic and an ion-conducting role. VDAC or a VDAC-like channel in the plasma membrane has also been reported sporadically in several other tissues (11–18), but the existence of VDACpl is not generally accepted and has been debated for a long time (19–21).
The purpose of this investigation is to clarify the biophysical properties of the apoptosis-related VDACpl in detail and to develop a kinetic model for the channel gating. Our model is compared with data from other VDACpls and from VDACmt. We conclude that the apoptosis-inducing VDACpl is very similar to VDACpls found in other cells under control conditions. Furthermore, it is also very similar to the VDACmt, suggesting that they represent the same channel.
METHODS
Cell culture and treatment
Hippocampal cell-line cells (HT22) were incubated in CO2-independent medium (Gibco BRL, Stockholm, Sweden, 18045-054) containing 10% fetal calf serum, 4 mM L-glutamine, 100 units/ml penicillin and 100 μg/ml streptomycin. Cells were incubated at 100% relative humidity and at 37°C for 24 h before exposure to the apoptotic stimuli. All chemicals for cell culture were supplied by Life Technologies (Gibco BRL). To induce apoptosis, cells were exposed to 1 μM staurosporine (STS) for 1.5 to 4.5 h. Only cells that visually showed signs of apoptosis (detached processes, flashed border, and smaller and rounded cell body) were used in this investigation.
Electrophysiology
The electrophysiological recordings were done with the patch-clamp technique. We used an EPC-7 patch-clamp amplifier (HEKA Elektronic Dr. Schulze GmbH, Lambrecht/Pfalz, Germany) and pClamp software (Axon Instruments, Foster City, CA). The extracellular solution was composed of (in mM): 140 NaCl, 5 KCl, 1.8 CaCl2, 1 MgCl2, 10 HEPES, and 23 sucrose (pH 7.4). The patch pipettes were made of borosilicate glass, and the pipette resistance was 4–6 MΩ with the solutions used. The pipettes were filled with the extracellular solution. In the inside-out recordings presented in the work, we also used the extracellular solution in the bath. The reasons for this are that a comparison with other investigations with symmetrical solutions is simplified and the reversal potentials for all channel types should be at 0 mV which, in some respects, simplifies the analysis. In a previous investigation (5) we showed that Na+ on the intracellular side instead of K+ or the presence of Ca2+ did not affect the channel function. The current was always denoted as positive for currents from the intracellular side toward the extracellular pipette side. No blockers were used to block other ion channels because control cells (lacking open VDACpl) were almost completely silent, and if any currents from other channels were seen, their amplitudes should be small in comparison to the current amplitudes generated by the large-conductance VDACpl channel investigated in this study. All recordings were carried out at room temperature (20–22°C). The sampling frequency was 10 kHz, and the signal was filtered at 5 kHz.
Leakage and capacitive currents were removed by subtraction of corresponding traces with no channel activity or by its mathematical representation (to avoid the increased noise). However, the seal resistance varied slightly during the experiment, not only during the excision of the membrane patch but also during recordings from excised patches. This made it difficult to use blank recordings taken from traces obtained at time points temporally distant from the channel opening. Therefore, the simplest way to correct for the seal-resistance current is to remove a steady-state current proportional to the membrane voltage (a linear offline leakage correction)—this procedure removes all currents in patches without VDACpls. This was done simultaneously for 11 different voltage-clamp steps in each family of measurement obtained during a period of 5 s. The strategy was to correct the whole family so that at least one current section in any of the 11 current traces is at zero line. The leakage conductance was followed from family to family through the complete experiment, and if it varied > ±30% the experiment was discarded from the analysis. In our analysis we only used experiments with a seal resistance >2.5 GΩ. Because the investigated channel has a conductance of 400 pS (see below), no complete channel openings are likely to be removed by mistake.
Analysis
The single-channel current amplitude histograms were fitted with the sum of one to three Gaussian curves:
 |
(1) |
where N is the number of events, A is the area of the curve, i is the single-channel current, imean is the mean current, and s is the standard deviation.
To analyze the time a channel is closed or open we used a threshold at 50% of the maximum open-channel current. For the open times we had to correct for long openings that were terminated by the limited activation step time (100 ms). For openings >100 ms we estimated the expected mean values by the following strategy: 1), For voltages where the long pulses were <37% (1/e) of the total number of pulses, we interpolated the data to find the time constant of the 37th percentile; 2), For voltages where the long pulses were >37% of the total number of pulses, we used the following equation: τ = −100/(ln f) where f is the fraction of openings with open times >100 ms. The reason for not using longer voltage steps was the channels are then pushed into a long-lived inactivated state.
RESULTS
In this investigation we studied the apoptosis-inducing VDACpl with the patch-clamp technique in excised membrane patches from HT22 cells. Apoptosis was induced by a 1.5–4.5-h treatment with 1 μM STS as previously described (5). Membrane patches from 46 apoptotic cells were investigated, and in 20 we found VDACpls.
Single-channel recordings in excised membrane patches from apoptotic cells
Fig. 1 A shows a typical voltage-clamp recording from an excised membrane patch. The holding voltage is 0 mV and the test-step voltage is +60 mV. The channel is already open at the beginning of the pulse and closes after ∼20 ms. The current level in the closed state (10 pA) is supposed to be leak current at the patch rim—the seal resistance is thus 6 GΩ. Fig. 1 B shows a recording to +60 mV, 64 s after the recording in Fig. 1 A. Here, no channel opening is seen. The current level is similar to the supposed current level in the closed state in Fig. 1 A. If the blank recording in Fig. 1 B is subtracted from the original recording in Fig. 1 A, then only the voltage-gated current is left (Fig. 1 C). The slight overcompensation in Fig. 1 C (the closed level is slightly below the zero line) probably depends on small variations in the seal resistance with time (see Methods).
FIGURE 1.

Single-channel recordings in excised membrane patches from apoptosis-inducing (by STS) HT22 cells. The membrane voltage is defined as bath potential (intracellular side) minus pipette potential (extracellular side). The holding voltage is 0 mV and the test-step voltage is +60 mV. (A) A nonleakage corrected trace with one VDACpl channel. O denotes the open state and C denotes the closed state. The closed state current is the leakage current here corresponding to a 6-GΩ seal. (B) A similar recording as in panel A but without a channel opening. This recording was obtained 64 s after (A). (C) Trace in panel B subtracted from the trace in panelA.
Fig. 2 A shows the currents for a whole family of voltage steps from +100 to −100 mV separated by 20 mV. The leakage current is corrected proportionally for the whole family assuming a constant leakage conductance (see Methods). Between the pulses the membrane voltage is kept at 0 mV for 0.4 s. In all but the trace at +40 mV, the channel is open at the beginning of the pulse, indicating that the channel is mostly open at the holding voltage 0 mV. The channel closes at the most positive and the most negative voltages during the 100-ms test step, whereas no closures are seen at voltages between −20 and +20 mV. (At +40 mV it was closed for the entire pulse length in this particular recording.) In most cases there are two distinct levels—one open and one closed state. However, levels between the two main levels can occasionally be seen (at −40 and −80 mV) also. The current levels will be discussed in the following section.
FIGURE 2.

A large conductance in the main open state. (A) Currents for a whole family of voltage steps from +100 to −100 mV separated by 20 mV. The leakage current is offline corrected proportionally for the whole family assuming a constant leakage conductance. Between the pulses the membrane voltage is kept at 0 mV for 0.4 s. The dashed lines denote the zero level. (B) Amplitude histograms of the single channel current for all the traces in panel A. Bin width = 1 pA. Note that the y axis is logarithmized at −100 mV to visualize the relatively small peak for the open channel. The histograms were fitted to single, double, or triple Gaussian curves (Eq. 1 in Methods). All units in pA (+100): A1 = 786, i1 = −1.2, s1 = 0.8, A2 = 1060, i2 = 37.2, s2 = 1.5, (+80): A1 = 282, i1 = 0.0, s1 = 0.8, A2 = 1667, i2 = 31.8, s2 = 1.3, (+60): A1 = 1291, i1 = −1.3, s1 = 0.8, A2 = 695, i2 = 21.7, s2 = 1.2, (+40): A = 1853, i = −2.2, s = 0.6, (+20): A = 1983, i = 6.8, s = 0.8, (0): A = 1966, i = 0.4, s = 0.8, (−20): A = −1987, i = −9.5, s = −1.2, (−40): A1 = 927, i1 = −19.9, s1 = 1.8, A2 = 320, i2 = −10.0, s2 = 2.0, A3 = 696, i3 = −2.1, s3 = 2.8, (−60): A1 = 1734, i1 = −25.6, s1 = 2.3, A2 = 125, i2 = 2.1, s2 = 0.7, (−80): A1 = 1329, i1 = −32.2, s1 = 5.5, A2 = 439, i2 = 0.7, s2 = 2.4, (−100): A1 = 202, i1 = −38.8, s1 = 4.1, A2 = 1759, i2 = 3.0, s2 = 0.8. (C) I(V) plot from the difference between the main current levels in the histograms in panel B. The straight line corresponds to a conductance of 409 pS.
The conductance of the VDACpl
The main-conductance state
To estimate the current amplitudes in the excised patches, we plotted and analyzed amplitude histograms. The single-channel currents in Fig. 2 A were binned for every 1 pA and plotted in Fig. 2 B, one histogram for each trace. At voltages between −20 and +100 mV, very distinct current levels are seen, whereas the recording at more negative voltages (−40 and −80 mV) are noisier with openings of several conductance levels. At the voltages −60, +60, +80, and +100 mV two clear peaks are found, representing an open and a closed state. There are no signs of openings of lower conductance levels. At −20 and +20 mV only the open state is occupied, and at +40 mV only the closed state is occupied. At −80 mV the peaks are broad and not perfectly described by the double Gaussian curve (Eq. 1). At −40 mV there is an additional distinct peak between the open and closed levels. This will be referred to as a subconductance state of the VDACpl. The differences between the main current peak and the zero peak in the histograms in Fig. 2 B are plotted in Fig. 2 C. The data points are well fitted with a straight line with a reversal potential very close to 0 with a conductance of 409 pS. The mean from three experiments is 402 ± 8 pS, which is close to our previous estimation based on a manual measurement of the current amplitude (397 ± 12 pS; Elinder et al. (5)).
Subconductance states
For VDACmt, subconductance states have been reported (6). Therefore, we investigated whether there are also subconductance states in VDACpl. Here, we report two types of subconductance levels: 220 pS and 28 pS. The larger subconductance level is primarily seen during excision of the membrane patch and subsequent activation of the channel (see also the section “Excision of the patch from the cell opened the VDACpl” below). The smaller subconductance level follows the main-conductance state and is related to inactivation of the VDACpl (see also the section “Inactivation of VDACpl” below). Because these subconductance levels are rare (<1% of the time in the open state), we could not investigate whether the selectivity differs from the main-conductance state. In this work we analyze data from four examples of each type of subconductance state.
Fig. 3 A shows a clear recording at −40 mV of a transition from the main-conductance level to the larger subconductance level and then back again. This brief current reduction cannot be the opening of another ion channel because we are using symmetric solutions. Any opening in symmetrical solutions at −40 mV should generate an inward-going current. It is also unlikely that this represents a brief closure of a lower-conducting ion channel of another species because we then expect to see other current combinations of this hypothetical channel and the present VDACpl. Such combinations were not observed. Furthermore, it is unlikely that two channels (∼240 pS and ∼160 pS) should open at exactly the same time, as seen 15 ms before the subconductance current (Fig. 3 A). Fig. 3, B, D, and F, shows three other examples of subconductance recordings at +100, −40, and +60 mV, respectively, from three different cells. Fig. 3, C, E, and G, shows the corresponding current amplitude histograms, where three clear peaks are found. The subconductance level is 55% ± 5% (n = 4) of the main conductance level, thus corresponding to 220 pS. Fig. 3 H shows a magnification from Fig. 3 F, where the subconductance state is passed in the channel's way from the open state to the closed state. This type of recording is an indication that the subconductance state is not due to the activation of a non-VDACpl channel.
FIGURE 3.

Subconductances of the VDACpl. (A) A test step to −40 mV. A subconductance level at ∼60% of the main-conductance level is occupied in 4 ms. (B, D, and F) Subconductance recordings at +100, −40, and +60 mV, respectively, from three different cells. (C, E, and G) Corresponding current amplitude histograms. Three clear peaks are found. Bin width = 1 pA. The histograms were fitted to the sum of three Gaussian curves (Eq. 1 in Methods). (C) A1 = 157, i1 = 1.6, s1 = 2.0, A2 = 319, i2 = 24.3, s2 = 5.4, A3 = 367, i3 = 43.7, s3 = 2.6. (E) A1 = 558, i1 = −19.9, s1 = 1.8, A2 = 711, i2 = −2.2, S2 = 2.9, A3 = 316, i3 = −10.0, s3 = 1.9. (G) A1 = 333, i1 = −0.2, s1 = 0.9, A2 = 333, i2 = 14.3, s2 = 4.8, A3 = 949, i3 = 24.0, s3 = 2.1. (H) Magnification from panel F.
Fig. 4 A shows a recording of a channel visiting the small subconductance level. This level follows directly after an opening to the main conductance level, suggesting that this does not represent the opening of another channel in the membrane patch. Fig. 4 B shows the corresponding current histogram, where three peaks are found (arrows). Fig. 4 C shows an amplified portion from Fig. 4 B. A similar conductance level will also be described below for inactivation of the channel. This subconductance level is 7% ± 1% (n = 4) of the main-conductance level, thus corresponding to 28 pS.
FIGURE 4.

The low subconductance state of the VDACpl. (A) A recording −100 mV. The subconductance level is ∼7% of the main-conductance level. Note that the low subconductance is occupied directly after the open state. (B) Corresponding current amplitude histogram, where three possible peaks are found (arrows). Bin width = 0.2 pA. (C) Amplified portion from panel B. Note the asymmetrical shape. The histogram was fitted to a double Gaussian curve (Eq. 1 in Methods). A1 = 119, i1 = 0.3, s1 = 0.8, A2 = 9.6, i2 = −2.0, s2 = 0.5.
Trivalent cations block the channel
No specific blockers exist for VDACs. However, trivalent cations at low micromolar concentrations have been reported to block the main-conductance state of VDAC completely (22). Even though the lanthanides are in general effective blockers (23), 30 μM gadolinium (Gd3+) blocks voltage-gated Na and K channels by only 25% (24). Here, we report that 30 μM Gd3+ applied from the intracellular side blocked the single-channel current almost completely, and reversibly (Fig. 5 A). At +100 mV the Gd3+ recordings become very noisy with a broader amplitude histogram compared to control (Fig. 5, B and C). We suggest that this depends on the Gd3+ ion becoming a permeant blocker that slowly sneaks through the channel.
FIGURE 5.

A trivalent cation blocks the VDACpl almost completely and reversibly. (A) Recordings at +60, +40, −40, and −60 mV from different situations as indicated. (B) Increased noise by Gd3+ at high voltages. (C) Amplitude histogram of the recording in panel B fitted with a single Gaussian curve (Eq. 1). A = 1988, i = 9.1 pA, s = 5.0 pA.
Transitions between closed and open states
Most channels open either at positive or at negative voltages (25). In contrast to this, VDACs have a bell-shaped voltage dependence with roughly the same closing kinetics at negative and positive voltages (5,6). The purpose of this investigation was to quantify the kinetics of the VDACpl activated during apoptosis. This will be important for the understanding of its functional role in apoptosis and to see whether this channel is similar to VDACpls in other preparations and to VDACmts studied in black lipid bilayers.
Transitions to and from the open state
To investigate single-channel kinetics from excised membrane patches, we used 100-ms pulses. Longer pulses tended to push the channel into a long-lasting inactivated state, preventing investigation of the kinetics for several minutes (see below). Fig. 6 A illustrates how open and closed dwell times are measured. The first open time (tO1) is followed by a closed time (tC1), an open time (tO2), and then finally a closed time (tC2) that is not ended before the pulse is over. We studied two different types of time intervals: 1) the time for the channel to close for the first time (tO1), and 2) the time for the channel to reopen (closed times, tC1). For tO1, the channel has to be in the open state already in the beginning of the pulse. For certain voltages tO1 is sometimes >100 ms. This is corrected as described in Methods. In Fig. 6 A there is a second open time (tO2). In general, we obtained fewer data for tO2, and because they started later in the trace they were often truncated. Therefore, we did not analyze other open times than tO1. The closed times (tCx) between two open times were in most cases relatively short (<10 ms) and thus not truncated by the limited time range of the trace (100 ms). However, as shown in Fig. 6 A, there is sometimes a long closed time (tC2) which is truncated by the limited pulse length. This closed time probably reflects that the channel has reached a second long-lasting closed state (see below). Therefore, in our analysis of closed-to-open transitions we only included time intervals between two open intervals.
FIGURE 6.

Opening and closing kinetics of the VDACpl. (A) Measurement of open (tO1, tO2) and closed (tC1, tC2) times. The dashed line denotes the 0-current level. Test step voltage = 80 mV, holding voltage = 0 mV. (B) Typical recordings at four different voltages. O = open state. C = closed state. Holding voltage = 0 mV. (C) First open time (tO1) varies with voltage (open symbols). For tO1 > 100 ms a value of 100 ms is used, which compresses the curve and sets the upper limit to 100 ms (dashed line). Data from 10 different cells. Estimation of expected first open times (solid symbols) following the procedure in the Methods section. Fitted to Eq. 4. Results in Table 1. The fit was based on the logarithmic values. (D) Closed times (tC1, tC2…, truncated sections as tC2 in (A) are not included) versus voltage. Data from 10 cells. Fitted to Eq. 5 (−100 to −60 mV) and Eq. 6 (+40 to +100 mV). (E) A state diagram describing the fast opening and closing kinetics. C1 and C2 denote two closed states, and O denotes the open state. The αs and βs are rate constants described by Eqs. 2 and 3 in the Results section. C1 is occupied at negative membrane voltages, and C2 is occupied at positive voltages. (F) The voltage dependence of the rate constants determined from C and D (Eqs. 2 and 3, Table 1). (G) Closed time events including truncated recordings from four cells. Data between 0.4 and 25 ms are fitted to the sum of two components of the type A × t × √2 × exp(−t/τ). A1 = 24.4, τ1 = 0.74 ms, A2 = 0.89, τ2 = 7.2 ms.
Fig. 6 B shows a typical recording at four different voltages. For a membrane potential of ±20 mV, the channel remains in the open state, whereas for the steps to −100 and +100 mV the channel closes relatively quickly. Thus, VDACpl is open at 0 mV and jumping to nonzero voltages therefore instantaneously generated a current. Fig. 6 C shows how the first open time (tO1) varies with voltage (open circles; data from 10 cells). It should be noted that for open times >100 ms a value of 100 ms is used, which compresses the curve and sets the upper limit to 100 ms (dashed line). These compressed values were then corrected as described in Methods and shown as filled symbols. Fig. 6 D shows the closed times plotted versus voltage. At voltages close to 0 mV measurable closed times are very few, and the mean value is distorted because of the limited time resolution and therefore not included.
A kinetic model for the transitions to and from the open state
To quantify the data we assumed the simplest possible model in Fig. 6 E, where, C1 and C2 denote two closed states. C1 is occupied at negative membrane voltages and C2 is occupied at positive voltages. O is the open state, and the αs and βs are rate constants described by
 |
(2) |
 |
(3) |
where kαi and kβi are the rate constants for αi and βi, respectively, at V = 0 mV, V is the absolute membrane voltage, zαi is the gating valence for α, zβi is the gating valence for β, and F, R, and T have their normal thermodynamic significances. i denotes transition 1 or 2.
The open time, τO, is thus
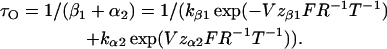 |
(4) |
This equation could easily be fitted to the data points in Fig. 6 C (solid symbols). The obtained values are shown in Table 1. To quantify the closed times we fitted closed dwell times obtained at negative voltages and positive voltages separately (Fig. 6 D). The data points between −100 and −60 mV were fitted with
 |
(5) |
and the data points between +40 and +100 mV were fitted with
 |
(6) |
TABLE 1.
| k (ms−1) | z (−) | |
|---|---|---|
| α1 | 55.2 | 1.53 |
| β1 | 0.00105 | 1.28 |
| α2 | 0.00042 | 1.10 |
| β2 | 10.4 | 1.38 |
The results are shown in Table 1. The voltage dependences of all four rate constants are plotted in Fig. 6 F.
Transitions between closed states
From the recordings, however, it is clear that there is more than only one closed state at negative voltages and one at positive voltages as suggested by the scheme in Fig. 6 E. In Fig. 6 G we have plotted closed times at −90 mV from four experiments, including truncated closings like tC2 in Fig. 6 A. There are two clear peaks in the diagram: One at 1 ms and one at 100 ms, suggesting that there are at least two closed states at negative voltages. The long-lived closed state is not an inactivated state (discussed below) because the following current trace is not blank or zero in the beginning as is the criteria for inactivation. Possibly there are even more closed states because we needed two exponential components to fit the data in the range 0.4–25 ms (Fig. 6 G). However, more data are needed to resolve this. Thus, the state diagram in Fig. 6 E should be extended to two closed states at negative voltages (C0 and C1) and two closed states at positive voltages (C2 and C3):
 |
(7) |
This model may affect the estimation of the rate constants α1 and β2 in Fig. 6 D. If, for instance, β0 is large, then only the fastest reopenings from C1 to O will be measured, thus making α1 too large. This deviation can be determined from the number of recordings with reopenings. About 50% of all traces have reopenings, which suggests that α1 and β0 are approximately equal. Thus α1 is underestimated by a factor of 2. The same also holds for β2. However, a factor of 2 is negligible in the current context (Fig. 6 F). α0 (and β3) must be very fast at positive (negative) voltages because a closed channel at −100 mV reopens almost instantaneously at positive voltages (data not shown).
Inactivation of VDACpl
In addition to the short-lived (C1, C2) and long-lived (C0, C3) closed states in Eq. 7, which quickly recovers to the open state at 0 mV, there are also some very long-lived closed states that are not opened by a step to 0 mV for several seconds. These states are occupied at both negative and positive voltages and will be referred to as inactivated states. To recover the channel from the inactivated state, voltages of opposite polarity are needed. Thus, the simplest criterion to differentiate between closed and inactivated states in this investigation is that a step to 0 mV quickly opens the closed channels but not the inactivated channels. The 400 ms to 0 mV we used between pulses opened a closed channel but not an inactivated one.
The inactivated states are normally reached after a long time in the closed states—a pulse of 1 s to +100 mV inactivated the channel with a probability of ∼50% (at −100 mV the probability was slightly lower). In addition, there are also even more long-lived inactivated states that could not easily be recovered with pulses of opposite polarity. This is the reason we did not use longer pulses than 100 ms in our quantitative analysis of VDACpl.
To study the inactivation in detail we performed the following experiments: The membrane potential was pulsed for 100 ms to +100 mV repeatedly every 15 s from a holding voltage of 0 mV. Fig. 7 A shows 10 consecutive pulses. During the first pulse, there are four open channels in the membrane patch in the beginning of the pulse—at the end they are all closed. With an increasing number of pulses, fewer channels are open and at the 10th pulse no channel is open. Thus, the repeated pulses to +100 mV seem to inactivate the channels for a long time. Similar effects were seen at negative voltages, but the inactivation was somewhat slower (data not shown).
FIGURE 7.

Repetitive positive voltage inactivates the channel. (A) Ten consecutive pulses to +100 mV from a holding voltage of 0 mV. Fifteen seconds between each pulse. The dashed lines denote the amplitude of the current levels separated by 39 pA. 0, 1, 2, 3, and 4 denote the number of open channels. (B) The number of open channels in panel A plotted versus accumulated time at +100 mV. The continuous line is a least-squares fitted exponential decay with a time constant of 370 ms. (C) Recovery from the inactivation in panel A. Consecutive pulses from +100 mV to −40 mV are recorded directly after (A). The next pulses to +100 and +80 mV are recorded from the next family. The holding voltage is 0 mV. The channel is opened when −40 mV is applied. Note also that the channel is nonconducting in the beginning of this trace. O denotes the open state, and C denotes the closed state. The dashed line denotes the zero level. (D) Consecutive recordings when +100 mV for 100 ms is directly followed by −100 mV for 100 ms. This pulse sequence is repeated every 20 s. Holding voltage is 0 mV. Modified from Elinder et al. (5).
The inactivation rate is relatively fast at +100 mV. Fig. 7 B shows the number of open channels plotted versus accumulated time spent at +100 mV (data from Fig. 7 A). The continuous line is a least-squares fitted exponential decay with a time constant of 370 ms. Because the curve reaches 0 in Fig. 7 B, no recovery occurs during the 15 s spent at 0 mV between the pulses. This justifies the use of accumulated time on the x axis. What is needed to recover the channel from the inactivation? To test this, we pulsed the membrane directly after the recordings in Fig. 7 A to more and more negative voltages. Fig. 7 C shows consecutive recordings at 2 Hz from +100 mV to −40 mV, from a holding voltage of 0 mV. At the voltages from +100 mV to −20 mV the channels are closed or inactivated completely. However, at −40 mV the channel is closed or inactivated in the beginning of the pulse but opens after ∼35 ms. This type of opening in the middle of the trace is only seen directly after the channel has been in the inactivated (i.e., long-lived closed) state. A clearly negative voltage (−40) is thus required to move one of the four channels from an inactivated state to an open state. After removal of the inactivation, the channel is now open at the beginning of pulses to +100 and +80 mV but closes during the pulse (two last traces in Fig. 7 C). Note, however, that three of the channels from Fig. 7 A are still inactivated. If each pulse to +100 mV is directly followed by a pulse to −100 mV, then no apparent inactivation is seen (Fig. 7 D).
A low-conducting channel in the inactivated state
Above we have described two subconductance levels, 28 and 220 pS. The 28-pS level was always seen after an opening to the main conductance level, and the following traces always lacked the main-conductance level, that is the channel is inactivated. Thus, we suggest that the 28-pS level is associated with the inactivation of the channel. Fig. 8 A shows that after a brief opening at +100 mV the channel is closed. After a further 30 ms there is an opening to the low subconductance channel. This trace is then followed by five traces (+80, +60, +40, +20, and 0 mV) without or with a very small current (a small steady-state current can be difficult to separate from the leakage current). When the voltage becomes negative (−20 mV in this experiment), the channel is opened. Note that the opening does not occur in the beginning of the pulse but after some pulse length at the negative voltage as was discussed above for the recovery from inactivation.
FIGURE 8.

Inactivation coincides with a low subconductance current. (A) An excised patch showing a low subconductance state after the initial closure. This is followed by four traces without large-conductance currents (not shown). A pulse to −20 mV opens the channel. (B) A similar recording as in (A) for a cell-attached patch. The potential (p) is here defined as bath potential minus pipette potential. Note that there is a small steady current at the beginning of the pulse at 0 mV. (C) Seven consecutive steps to voltages as indicated. The first trace is from B. (D) The current in the beginning of each trace in C. In traces 2–4 the channel is inactivated.
Fig. 8 B shows a similar recording from a cell-attached patch. (Even though the VDACpl is more frequently seen in excised patches, we detected it in ∼10% of cell-attached recording of apoptotic cells, (5).) In this case we do not know the absolute membrane potential. Pipette potential is −100 mV, but for simplicity we will denote bath potential minus pipette potential (p) here, that linearly relate to the membrane potential. Note that there is a steady outward current of 3 pA at 0 mV (p) (arrow in the beginning of the trace). This suggests that the reversal potential for the VDACpl in the main-conductance state is −7 mV (p) (3 pA/400 pS). Fig. 8 C shows the recovery from inactivation. Here the inactivated conducting state is occupied until pulse number 5 (denoted +20 (p)). The absolute membrane potential is not known in this particular experiment, but in other experiments we have measured resting potentials around −30 mV. This suggests that the absolute membrane potentials in the traces in Fig. 8 C are from +70 mV to −50 mV. The VDACpl thus inactivates at +70 mV, it is kept at −30 mV between the traces which recover it from inactivation, and the reversal potential is −37 mV. In Fig. 8 D we have plotted the steady-state current at 0 mV (p) just before each test step. When the channel is inactivated (i.e., traces 2–4 in Fig. 8 C) the current is also closed at 0 pA. The current in the other traces (2.5–3 pA) represents the current through open channels at 0 mV. Similar recordings were also done at negative voltages (data not shown).
A kinetic model for VDACpl gating
To model VDACpl kinetics, the scheme in Fig. 6 E must be extended. In Fig. 9 A we show a hypothetical kinetic scheme for the VDACpl. The C1↔O*↔C2 row in the middle corresponds to the scheme in Fig. 6 E. Addition of the states C0 and C3 makes the scheme equivalent to Eq. 7. I denotes inactivated states, and C denotes extra closed states. For simplicity we assume that the scheme is symmetrical. * denotes conducting states—O* with a conductance of 400 pS and I* with a conductance of 28 pS. The thick arrows indicate in general faster transitions. The dashed arrows indicate rare transitions. For the further calculations we simplify the scheme to Fig. 9 B. KC and KO denote equilibrium constants as KC = kC→I/kI→C and KO = kO→I/kI→O.
FIGURE 9.

A kinetic model of VDACpl. (A) A tentative 15-state diagram. O denotes the main-conductance state, C closed states, and I inactivated states. * denotes that the channel is conducting (the conductance in O* is 400 pS, in I* it is 28 pS). Thick arrows denote fast transitions and dashed arrows slow, less frequent, transitions. The specified rate constants are described by Eqs. 2 and 3 and Table 1. (B) A simplified seven-state diagram. (C) Calculations of the steady-state open probability. Experimental data (open circles) from Elinder et al. (5). The dotted curve is the prediction of the diagram in Fig. 6 E. The dashed curve is best fit to the diagram in (B). KC = 42, KO = 0.26. The continuous curve is KC = 1000 and KO = 0.05.
Starting with the well-defined C1↔O*↔C2 row (Table 1) we can easily calculate the open probability without the inactivated states in Fig. 9 B:
 |
(8) |
Fig. 9 C shows the open probability measured at the end of a 100-ms pulse (open symbols, from Elinder et al. (5)). The predicted curve (dotted line) does not fit well with experimental data. The channel is much more closed than what the model predicts. However, the extended model shown in Fig. 9 B can easily be fitted to the open probability data. The best fit is KC = 42 and KO = 0.26 (dashed line in Fig. 9 C). Because the open probability is somewhat overestimated (long activating pulses were avoided because of the problem with long-lasting inactivation), we constrained the open probability to 15% at −50 mV and then the best fit is KC = 1000 and KO = 0.05 (continuous line). The developed model can be used to compare the apoptosis-inducing VDACpl with other VDACpls and with the VDACmt.
Excision of the patch from the cell opened the VDACpl
In the previous study we showed that excision of the patch from the cell opened the VDACpl (5). To find out a possible mechanism, we investigated the effect of several intracellular substances. We found that ATP (4 mM) quickly and reversibly blocked the ion channel from the intracellular side. Thus, a simple mechanism for the activation upon excision can be depletion of ATP from the intracellular side with a consequent unblocking of the VDACpl pore and opening of the channel. In this section, we will explore the time course and behavior of the activation of the channel after excision.
We recorded complete voltage-clamp families at different time intervals before and after excision. Each voltage-clamp family consisted of 100-ms pulses to voltages between −100 and +100 mV in steps of 20 mV. The holding voltage was 0 mV, and the time between each pulse was 400 ms. Thus, each family took ∼5 s to record. Fig. 10 shows nine such families (columns). All families are individually offline linear leakage corrected to assure that at least one part of the current in at least one trace was adjusted to 0. In the first column, the membrane patch is still in the cell-attached mode. No VDACpl is activated. Excision of the membrane patch from the cell neither changed the seal resistance nor activated any channel immediately. In the third column (3.50 min after excision), there is an increased noise/flicker in almost all traces. Thirty seconds later (4.20 min after excision) there are fully matured channel openings at all voltages. At the negative voltages there is an increased leakage current (the closed current is not at the dashed line) as if the leakage conductance does not depend linearly on voltage. We do not know the reason for this deviation, and it is not seen in all experiments. The same pattern and behavior of the channel openings and closings are seen at the remaining recordings. The delay in channel activation (normally 2–4 min in the 20 patches investigated with VDACpl) suggests that a simple unblock of ATP from the channel pore cannot be the single mechanism of activation.
FIGURE 10.

Excision of the patch opens VDACpl. Nine families (columns) at different time intervals before and after excision. See Results section for leakage current compensation. Note that channel flickering occurs ∼4 min after excision and that fully matured channel openings are seen ∼30 s later. See Text for a detailed description. Scale: dashed line at +100 mV is 40 pA. The corresponding leakage (gigaseal) resistance was in the range 5–13 GΩ for the whole experiment. The corresponding channel resistance was 2.5 GΩ, which demonstrated with certainty that no channel opening was removed by overcompensation.
Fig. 11 A shows a higher magnification of the formation of a mature VDAC after excision during a specific time interval at +100 mV (from Fig. 10). One minute after excision it was still not activated but after that, from 2.40 to 4.40 min, the channel shows short openings with many opening flickers. It is also clearly seen how the amplitude of the currents are increasing during the different time interval. Finally, at 13.50 min after excision a clear fully mature VDAC is seen which is open in the beginning and closed in the end of the pulse. Fig. 11 B shows the higher temporal magnification of the currents at 3.50, 4.05, and 13.50 min after excision. Fig. 11 C shows a similar recording like Fig. 11 A at +60 mV. It is clear that the pattern of opening is the same after excision. Fig. 11 D shows the current histograms of Fig. 11 C. In the first panel (2.40 min after excision), the peak is sharp; in the second panel (3.50 min after excision), the peak has become broader; and in the third panel (4.05 min after excision), a clear subconductance state (close to the 55% level reported above) is present. After 4.20 min after excision an almost fully matured channel is shown, but the peak is still broad. From 4.40 min after excision and onward there are two relatively sharp peaks. Fig. 11 E shows the maximum current amplitudes (open symbols and continuous line) and the intermediate current amplitudes (solid symbols and dashed line) plotted versus time after excision. The current amplitude increases sharply within 3–5 min after excision.
FIGURE 11.

Amplitude of the currents increases sharply within 3–5 min after excision. (A) Higher magnification of the formation of a mature VDAC after excision during a specific time interval at +100 mV (taken from Fig. 10). The dashed line denotes the zero level. (B) Higher magnification of some of the currents from A. (C) A similar recording like A at +60 mV. (D) Current histograms from C. Fits of Eq. 1: (2.40): A = 1897, i = 0.5, s = 0.8, (3.50): A = 1938, i = −0.4, s = 1.7, (4.05): A = 1778, i = 11.4, s = 1.5, (4.20): A = 1851, i = 22.7, s = 2.6, (4.40): A1 = 1253, i1 = −0.3, s1 = 1.2, A2 = 675, i2 = 25.3, s2 = 2.2, (13.50): A1 = 1253, i1 = 0.4, s1 = 1.0, A2 = 665, i2 = 27.4, s2 = 2.0, (14.10): A1 = 305, i1 = 0.6, s1 = 0.9, A2 = 718, i2 = 17.7, s2 = 6.5, A3 = 933, i3 = 24.9, s3 = 1.8. (E) Maximum current peaks from D plotted versus time after excision.
DISCUSSION
In this investigation we have studied biophysical properties of the plasma membrane VDACpl activated during apoptosis in the mouse hippocampal cell line, HT22. This is the first characterization of this apoptosis-inducing channel, and the developed model is the most detailed published model for VDACpl. Whether or not VDACpl is identical to the VDACmt (in the mitochondrial outer membrane; see Introduction) is controversial (19–21). Because of this debate, we will focus on such a comparison in the Discussion. We will also discuss its role in neuronal apoptosis based on its biophysical properties.
Plasma membrane VDAC versus mitochondrial VDAC
Main-conductance and subconductance states
Most of the open time in this investigation (>99%) was spent in a main-conductance state of 400 pS. This conductance is close to what has been reported for other VDACpls in physiological solutions (see Table 2), but it is much larger than for other ion-selective ion channels (25). The VDACmt is in most cases studied in lipid bilayers with bath solutions of 1 M KCl. Therefore, the conductance is ∼4 nS (6,26). The VDACpl and the VDACmt have the same conductance if they are studied in physiological solutions (18).
TABLE 2.
Properties of VDAC and VDAC-like channels from published investigations
| Cell type | VDAC localization | Exp. | [Cl−] (mM) | γ (pS) | γSub (pS) | Volt. dep. | Select. (−/+) | Blockade | Activated by patch excision | |
|---|---|---|---|---|---|---|---|---|---|---|
| Present work | HT22 neuron | pl | PC | 140 | 402 | 28, 220 | bs | >5 | ATP, sucrose, Ab | yes |
| (16) | Rat astrocytes | pl | PC | 145 | 401 | 120, 280 | bs | high | ATP, dextran sulfate | yes |
| (15) | Rat astrocytes | pl | PC | 140 | 434 | bs | high | Ab | yes | |
| (14) | Rat astrocytes | pl | PC | 142 | 300* | 90, 180 | bs | high | L-644,711 | yes |
| (27) | Rat Schwann | pl | PC | 150 | 450 | 220 | bs | 5 | yes | |
| (11) | Rat muscle | pl | PC | 143 | 430 | bs | 5-30 | |||
| (18) | PC12 | pl | PC | 142 | 367 | bs | ||||
| (18) | PC12 | mt | PC | 142 | 321 | bs | ||||
| (6) | Bilayer | mt | BLB | 1000 | 4000 | bs | 2† |
pl, plasma membrane; mt, mitochondrial; Exp., experimental technique; PC, patch clamp; BLB, black lipid bilayer; [Cl−], chloride concentration in the pipette and the bath; γ, single-channel conductance; γSub, subconductance; bs, bell-shaped voltage dependence of open probability; (−/+), anion selectivity divided by cation selectivity; Ab, anti-VDAC antibody.
Hypoosmotic solution on one side, which probably reduces the conductance somewhat.
5 in physiological solutions.
Besides the main-conductance level of 400 pS, subconductance levels of 220 pS and 28 pS were occasionally seen in this investigation. Because of the rare existence it was difficult to get detailed information about the kinetics, selectivity, and pharmacological properties of these subconductance states. The 220-pS level was more prevalent shortly after excision, when the channel is transformed from a closed channel to a fully matured channel. Other reports on the VDACpl also show a subconductance state of this amplitude (Table 2). Sometimes, this subconductance state was associated with brief openings and brief closings (14,27; Fig. 11 C at 4.05 in this study). The 28-pS subconductance level was seen after the main-conductance level at the most positive and negative voltages and was linked to inactivation of the VDACpl (see Discussion about kinetics below). The VDACmt also has subconductance states. One is clearly seen in pure salt solutions in lipid bilayers at either positive or negative voltages (6). In this state the channel is conducting cations. Physiologically, this subconductance state is effectively blocked by the molecules transported through the channel in the outer mitochondrial membrane from the space between the inner and outer mitochondrial membranes to the cytosol. Finding if this “closed-channel conductance” is related to the “inactivation conductance” discovered in this investigation has to await further studies.
Selectivity and channel block
The apoptosis-inducing VDACpl is anion selective (5), and the data suggest that the anion/cation selectivity is ≥5:1. This is close to what has been reported for other VDACpls (Table 2). At first sight, this seems to be more than what has been reported for the VDACmt in symmetrical 1 M KCl (2:1; 6). However, the selectivity depends on the ionic strength (6,28). Physiological solutions increase the anion/cation selectivity to ∼5:1 (6,26) and, thus, the VDACpl and the VDACmt are both highly anion selective under similar conditions. Not only small ions pass the channel, but also large organic anions are fairly permeable (5,27).
We found that 30 μM Gd3+ blocked the apoptosis-inducing VDACpl almost completely. This has also been reported for the VDACmt (22) and supports the idea that the VDACpl and the VDACmt are the same channel. We have previously reported that ATP (4 mM) and sucrose (240 mM in a low ionic strength solution) also blocks the channel (5). ATP has been shown to block other VDACpl (16), but we are not aware of any other reports of sucrose block for other VDACpls or for the VDACmt.
Open probability and kinetics of opening and closing
VDAC is mainly open around 0 mV but closes at either positive or negative voltages. This bell-shaped open-probability curve was first reported in 1976 (29) and is a hallmark for VDACs (see Table 2). The closing and opening kinetics is relatively fast in the VDACpl, and the voltage dependence of the kinetics is surprisingly high. Although the opening kinetics in voltage-gated K and Na channels corresponds to a valence of 0.3–0.5 (30,31), all rates for opening and closing transitions in this investigation correspond to a valence of 1.1–1.5 (Table 1). This means that even though the closing is fast at −100 mV (∼10 ms; Fig. 6 F) the kinetics at 0 mV is relatively slow (1 s; Fig. 6 F). This high voltage dependence is remarkable. Classical voltage-gated Na, K, and Ca channels have in total 16–28 positive charges focused to well-defined voltage sensors (32), whereas the VDAC does not have an easily recognized voltage sensor. Even though the kinetics has not been studied in detail in the VDACpl, our data are compatible with other reports (11,14,27). The kinetics in the VDACpl is possibly somewhat faster than in the VDACmt, but it should be noted that at ±20 mV it is relatively slow in the VDACpl (∼1 s) and increasing the concentrations of the permeable ions could possibly slow down the closing kinetics as for slow inactivation of voltage-gated K channels (33).
Normally the channel closes during a 100-ms step to either −100 or +100 ms but is quickly opened when returning to 0 mV, but prolonged or repetitive steps to either positive or negative voltages stabilize the channel in an inactivated state. This means that the channel will stay in a non- (or low-) conducting state for a long time at 0 mV. Voltage steps of opposite polarity are needed to recover the channel from inactivation. The VDACmt has also been reported to have several closed states. After initial closure with fast reopening, the channel can convert to more long-lived closed states (6). An interesting observation in this investigation is that the inactivation is associated with the opening of a low-conductance state (see Fig. 9). The channel stays in this state during the inactivation. This provides a unique possibility to study transitions between essentially electrically silent (closed and inactivated) states.
Mechanism for activation
The VDACpl is predominantly closed in the cell-attached configuration. The channel is found in ∼1% of patches from control cells (0–2%) (5,14,16,27) and in ∼10% of the apoptotic cells (5). The channel activity dramatically increased several minutes after excision of the patch from the cell. This has been shown in a number of studies (see Table 2). The mechanism for this activation is not known but probably involves the loss of some intracellular substances. One possible source is ATP that reversibly blocks the channel (5,16). The transition from a closed to a fully matured (400 pS stable state) channel takes ∼30 s (Fig. 11). Channel flickering and occupancy of subconductance states were common during this brief period. This suggests that the nonactivated closed channel has a specific channel conformation, maybe a collapsed β-barrel structure. During activation an unstable semicollapsed structure is occupied for a short time. After some seconds the channel arrives into a fully activated state. From this state the channel can close (at negative and positive voltages) to a state that is different from the preactivated closed state (before excision).
Conclusion of VDACpl versus VDACmt
To conclude the VDACpl versus VDACmt controversy, we have shown that our apoptosis-inducing neuronal VDACpl is almost identical to the VDACpl from astrocytes, muscle cells, and Schwann cells. The electrophysiological properties are also very similar to the VDACmt. Thus, we suggest that VDACpl and VDACmt represent the same channel. This suggestion is also supported by the labeling of VDACpl with specific anti-VDAC antibodies (5).
The VDACpl and apoptosis
In our previous investigation (5), we showed that activation of the VDACpl induced apoptosis, but the role of VDACpl is not clear. The density of VDACpl seems to be high in the cells. On average we found about one active VDACpl per membrane patch of ∼1 μm2 in apoptotic cells. For a round cell with a diameter of 10 μm, there should be roughly 300 VDACpls in the membrane. To ascertain that these channels are closed in control cells there are at least three mechanisms: 1) Negative resting membrane voltage inactivating the VDACpls, 2) high intracellular concentrations of ATP, and 3) absence of an apoptotic signal (of unknown identity). Even though we do not know the exact mechanisms for the apoptotic process, we suggest that besides the apoptotic VDACpl-activating signal, there must be a reduction in ATP (as reported during apoptosis; 5) and a depolarization of the cell. We suggest that all these three mechanisms together with opening of K channels (2,3,5) affect each other to make the cell apoptotic. Opening of K channels and efflux of K+ is required for apoptosis (2,3). However, this opening would only let a small amount of K to leave the cell if it was not accompanied by other ions, such as Cl−. A possible consequence is that cells with high intracellular Cl− concentrations undergo apoptosis more easily because of the larger Cl− efflux.
We have previously shown that a block of the VDACpl with either VDAC-specific antibodies or sucrose prevents apoptosis (5). Another report also supports the idea that sucrose can slow apoptosis (34). We thus suggest that sucrose or related substances will be interesting tools in future studies to explore and prevent apoptosis.
Acknowledgments
We thank Peter Larsson, Peter Århem, Staffan Johansson, and Sivert Lindström for comments on the manuscript, and Sandra Ceccatelli and Roshan Tofighi for help with the HT22 cells.
This study was supported by grants from the Swedish Research Council (No. 13043), Linköpings Universitet, and the County Council of Östergötland.
References
- 1.Heidenreich, K. A. 2003. Molecular mechanisms of neuronal cell death. Ann. N. Y. Acad. Sci. 99:237–250. [DOI] [PubMed] [Google Scholar]
- 2.Bortner, C. D., F. M. Hughes Jr., and J. A. Cidlowski. 1997. A primary role for K+ and Na+ efflux in the activation of apoptosis. J. Biol. Chem. 272:32436–32442. [DOI] [PubMed] [Google Scholar]
- 3.Yu, S. P., C.-H. Yeh, S. L. Sensi, B. J. Gwag, L. M. T. Canzoniero, Z. S. Farhangrazi, H. S. Ying, M. Tian, L. L. Dugan, and D. W. Choi. 1997. Mediation of neuronal apoptosis by enhancement of outward potassium current. Science. 278:114–117. [DOI] [PubMed] [Google Scholar]
- 4.Maeno, E., Y. Ishizaki, T. Kanaseki, A. Hazama, and Y. Okada. 2000. Normotonic cell shrinkage because of disordered volume regulation is an early prerequisite to apoptosis. Proc. Natl. Acad. Sci. USA. 97:9487–9492. [DOI] [PMC free article] [PubMed] [Google Scholar]
- 5.Elinder, F., N. Akanda, R. Tofighi, S. Shimizu, Y. Tsujimoto, S. Orrenius, and S. Ceccatelli. 2005. Opening of plasma membrane voltage-dependent anion channel (VDAC) precedes caspase activation in neuronal apoptosis induced by toxic stimuli. Cell Death Differ. 12:1134–1140. [DOI] [PubMed] [Google Scholar]
- 6.Colombini, M., E. Blachly-Dyson, and M. Forte. 1996. VDAC, a channel in the outer mitochondrial membrane. In Ion Channels, Vol. 4. T. Narahashi, editor. Plenum Press, New York. 169–202. [DOI] [PubMed]
- 7.Benz, R. 1988. Structure and function of porins from Gram-negative bacteria. Annu. Rev. Microbiol. 42:359–393. [DOI] [PubMed] [Google Scholar]
- 8.Shimizu, S., M. Narita, and Y. Tsujimoto. 1999. Bcl-2 family proteins regulate the release of apoptogenic cytochrome c by the mitochondrial channel VDAC. Nature. 399:483–487. [DOI] [PubMed] [Google Scholar]
- 9.Zheng, Y., Y. Shi, C. Tian, C. Jiang, H. Jin, J. Chen, A. Almasan, H. Tang, and Q. Chen. 2004. Essential role of the voltage-dependent anion channel (VDAC) in mitochondrial permeability transition pore opening and cytochrome c release induced by arsenic trioxide. Oncogene. 23:1239–1247. [DOI] [PMC free article] [PubMed] [Google Scholar]
- 10.Baker, M. A., D. J. R. Lane, J. D. Ly, V. De Pinto, and A. Lawen. 2004. VDAC1 is a transplasma membrane NADH-ferricyanide reductase. J. Biol. Chem. 279:4811–4819. [DOI] [PubMed] [Google Scholar]
- 11.Blatz, A. L., and K. L. Magleby. 1983. Single voltage dependent chloride-selective channels of large conductance in cultured rat muscle. Biophys. J. 43:237–241. [DOI] [PMC free article] [PubMed] [Google Scholar]
- 12.Thinnes, F. P., H. Gotz, H. Kayser, R. Benz, W. E. Schmidt, H. D. Kratzin, and N. Hilschmann. 1989. Identification of human porins. II. Characterization and primary structure of a 31-lDa porin from human B lymphocytes (Porin 31HL). Biol. Chem. Hoppe Seyler. 370:1253–1264. [PubMed] [Google Scholar]
- 13.Hals, G. D., P. G. Stein, and P. T. Palade. 1989. Single channel characteristics of a high conductance anion channel in “sarcoballs”. J. Gen. Physiol. 93:385–410. [DOI] [PMC free article] [PubMed] [Google Scholar]
- 14.Jalonen, T. 1993. Single-channel characteristic of the large-conductance anion channel in rat cortical astrocytes in primary culture. Glia. 9:227–237. [DOI] [PubMed] [Google Scholar]
- 15.Dermietzel, R., T. K. Hwang, R. Buettner, A. Hofer, E. Dotzler, M. Kremer, R. Deutzmann, F. P. Thinnes, G. I. Fishman, D. C. Spray, and D. Siemen. 1994. Cloning and in situ localization of a brain-derived porin that constitutes a large-conductance anion channel in astrocytic plasma membranes. Proc. Natl. Acad. Sci. USA. 91:499–503. [DOI] [PMC free article] [PubMed] [Google Scholar]
- 16.Guibert, B., R. Dermietzel, and D. Siemen. 1998. Large conductance channel in plasma membranes of astrocytic cells is functionally related to mitochondrial VDAC-channels. Int. J. Biochem. Cell Biol. 30:379–391. [DOI] [PubMed] [Google Scholar]
- 17.Báthori, G., I. Szabó, I. Schmehl, F. Tombola, V. De Pinto, and M. Zoratti. 1998. Novel aspects of the electrophysiology of mitochondrial porin. Biochem. Biophys. Res. Commun. 243:258–263. [DOI] [PubMed] [Google Scholar]
- 18.Buettner, R., G. Papoutsolou, E. Scemes, D. C. Spray, and R. Dermietzel. 2000. Evidence for secretory pathway localization of a voltage-dependent anion channel isoform. Proc. Natl. Acad. Sci. USA. 97:3201–3206. [DOI] [PMC free article] [PubMed] [Google Scholar]
- 19.Yu, W. H., and M. Forte. 1996. Is there VDAC in cell compartments other than the mitochondria? J. Bioenerg. Biomembr. 28:93–100. [DOI] [PubMed] [Google Scholar]
- 20.Thinnes, F. P., and S. Reymann. 1997. New findings concerning vertebrate porin. Naturwissenschaften. 84:480–498. [DOI] [PubMed] [Google Scholar]
- 21.Bathori, G., I. Parolini, I. Szabo, F. Tombola, A. Messina, M. Oliva, M. Sargiacomo, V. De Pinto, and M. Zoratti. 2000. Extramitochondrial porin: facts and hypotheses. J. Bioenerg. Biomembr. 32:79–89. [DOI] [PubMed] [Google Scholar]
- 22.Gincel, D., H. Zaid, and V. Shoshan-Barmatz. 2001. Calcium binding and translocation by the voltage-dependent anion channel: a possible regulatory mechanism in mitochondrial function. Biochem. J. 358:147–155. [DOI] [PMC free article] [PubMed] [Google Scholar]
- 23.Elinder, F., and P. Århem. 2003. Metal ion effects on ion channel gating. Q. Rev. Biophys. 36:373–427. [DOI] [PubMed] [Google Scholar]
- 24.Elinder, F., and P. Århem. 1994. Effect of gadolinium on ion channels in the myelinated axon of Xenopus laevis: four sites of action. Biophys. J. 67:71–83. [DOI] [PMC free article] [PubMed] [Google Scholar]
- 25.Hille, B. 2001. Ionic Channels of Excitable Membranes. Sinauer Associates, Sunderland, MA.
- 26.Colombini, M. 1989. Voltage gating in the mitochondrial channel, VDAC. J. Membr. Biol. 111:103–111. [DOI] [PubMed] [Google Scholar]
- 27.Gray, P. T. A., S. Bevan, and J. M. Ritchie. 1984. High conductance anion-selective channels in rat cultured Schwann cells. Proc. R. Soc. Lond. B Biol. Sci. 221:395–409. [DOI] [PubMed] [Google Scholar]
- 28.Zambrowicz, E. B., and M. Columbini. 1993. Zero-current potentials in a large membrane channel: a simple theory accounts for complex behaviour. Biophys. J. 65:1093–1100. [DOI] [PMC free article] [PubMed] [Google Scholar]
- 29.Schein, S. J., M. Colombini, and A. Finkelstein. 1976. Reconstitution in planar lipid bilayers of a voltage-dependent anion-selective channel obtained from paramecium mitochondria. J. Membr. Biol. 30:99–120. [DOI] [PubMed] [Google Scholar]
- 30.Zagotta, W. N., T. Hoshi, J. Dittman, and R. W. Aldrich. 1994. Shaker potassium channel gating. II: Transitions in the activation pathway. J. Gen. Physiol. 103:279–319. [DOI] [PMC free article] [PubMed] [Google Scholar]
- 31.Keynes, R. D., and F. Elinder. 1998. Modelling the activation, opening, inactivation and reopening of the voltage-gated sodium channel. Proc. R. Soc. Lond. B Biol. Sci. 265:263–270. [DOI] [PMC free article] [PubMed] [Google Scholar]
- 32.Keynes, R. D., and F. Elinder. 1999. The screw-helical voltage gating of ion channels. Proc. R. Soc. Lond. B Biol. Sci. 266:843–852. [DOI] [PMC free article] [PubMed] [Google Scholar]
- 33.Lopez-Barneo, J., T. Hoshi, S. H. Heinemann, and R. W. Aldrich. 1993. Effects of external cations and mutations in the pore region on C-type inactivation of Shaker potassium channels. Receptors Channels. 1:61–71. [PubMed] [Google Scholar]
- 34.Olejnicka, B. T., K. Öllinger, and U. T. Brunk. 1997. A short exposure to a high-glucose milieu stabilizes the acidic vacuolar apparatus of insulinoma cells in culture to ensuing oxidative stress. APMIS. 105:689–698. [DOI] [PubMed] [Google Scholar]