Abstract
After stimulation by chemoattractant, Dictyostelium cells exhibit a rapid response. The concentrations of several intracellular proteins rise rapidly reaching their maximum levels approximately 5–10 seconds, after which they return to prestimulus levels. This response, which is found in many other chemotaxing cells, is an example of a step disturbance rejection, a process known to biologists as perfect adaptation. Unlike other cells, however, the initial first peak observed in the chemoattractant-induced response of Dictyostelium cells is then followed by a slower, smaller phase peaking approximately one to two minutes after the stimulus. Until recently, the nature of this biphasic response has been poorly understood. Moreover, the origin for the second phase is unknown. In this paper we conjecture the existence of a feedback path between the response and stimulus. Using a mathematical model of the chemoattractant-induced response in cells, and standard tools from control engineering, we show that positive feedback may elicit this second peak.
Keywords: chemotaxis, gradient sensing, positive feedback
1 Introduction
Chemotaxis, the directional migration in response to a spatial gradient of chemical stimuli, is a process found in many cells. Single-cell organisms, such as bacteria and amoebae rely on chemotaxis to search for nutrients [1, 2]. Multicellular organisms also depend on chemotaxis. For example, cells of the immune system, including neutrophils and fibroblasts, can use chemotaxis to search for pathogens [3]. Similarly, in developing vertebrate spinal cords, axons rely on combinations of attractive and repulsive cues to guide them along specific paths [4].
Many cells that carry out chemotaxis exhibit adaptation to spatially-uniform step changes in the concentration of chemoattractant stimuli. An adapting cell, when stimulated by a constant dose of chemoattractant, exhibits a large transient response. In time, however, the cell's response returns to its prestimulus levels. This adaptation amounts to step disturbance rejection, together with a signal detection and requires integral control feedback [5-7].
1.1 The chemoattractant-induced response of Dictyostelium
In this paper we study the adaptation property of the chemoattractant-mediated response in the social amoebae Dictyostelium [8, 9]. Individual Dictyostelium are usually found in soil feeding on bacteria. However, when faced by harsh environmental conditions, such as the loss of all nutrients, they undergo a fascinating developmental process. These cells acquire the ability to synthesize, secrete, and detect the chemoattractant cAMP (cyclic Adenosine MonoPhosphate). In about six hours, and relying on chemotaxis, upwards of 100,000 cells congregate and form a multicellular mound. Subsequent morphogenesis allows a fraction of the cells to survive by sporulation.
We now describe some of the biochemistry that is known about the chemoattractant-induced response in Dictyostelium cells. Readers who do not require these details can skip to Section 1.2. The binding of extracellular cAMP to the cAMP-receptors leads to the activation of several downstream processes ; see Fig. 1 and [10]. The receptor is coupled to a G-protein which, when activated, leads to a series of events involving a cascade of membrane lipids known as phosphoinositides. In particular, phosphorylation of the lipid PI(4,5)P2 (phosphatidylinositol 4,5-bisphosphate) by the kinase PI3K (phosphoinositide-3-kinase) to form PI(3,4,5)P3 (phosphatidylinositol 3,4,5-trisphosphate) and its dephosphorylation by the phosphatase PTEN (phosphatase and tensin homolog) are known to be crucial to the response of Dictyostelium cells to chemoattractant. Together, these enzymes elicit a localized accumulation of PI(3,4,5)P3 at the leading edge. This elevated concentration of PI(3,4,5)P3 induces a concomitant increase in actin polymerization (also referred to as F-actin), which is associated with pseudopod formation and motility.
Fig. 1.
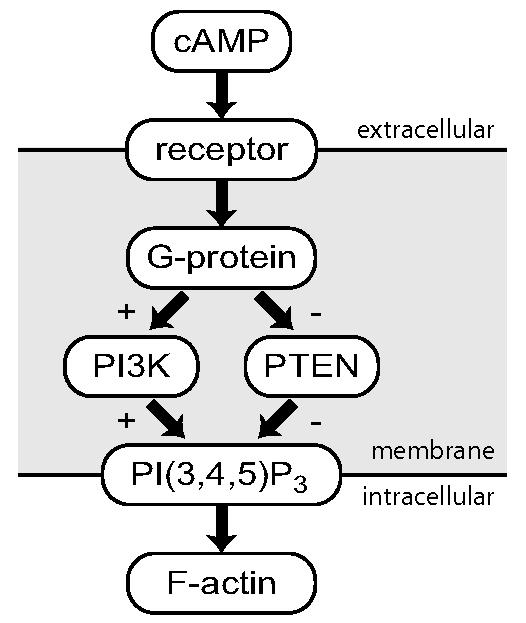
Signaling pathway. Upon binding of the chemoattractant cAMP to the receptor, the subunits of the G-protein dissociate. This response leads to parallel and complementary regulation of two enzymes. PI3K, moves to the cell membrane, where its role is to synthesize PI(3,4,5)P3. In contrast, PTEN, which destroys PI(3,4,5)P3 and which is originally on the cell membrane, is released. Both these localizations, and the corresponding formation of PI(3,4,5)P3, are transient. Finally, PI(3,4,5)P3 accumulation leads to the formation of F-actin.
1.2 Second peaks in the cAMP-mediated response: a role for feedback?
Experimental studies of in Dictyostelium have shown that a step change in the chemoattractant concentration generates a biphasic response [11-14]. The spatially uniform step change in stimulus first induces a large response that peaks, within 5–10 seconds, at levels approximately two times higher than prestimulus values; see Fig. 2. This first response disappears between 25–30 seconds. A slower, much smaller (≈10–20% higher than the prestimulus levels) second peak appears somewhere between 60–180 s after the original stimulus [14]. The existence of this secondary peak has led some biologists even to suggest that Dictyostelium cells do not fully adapt to constant cAMP levels [13].
Fig. 2.
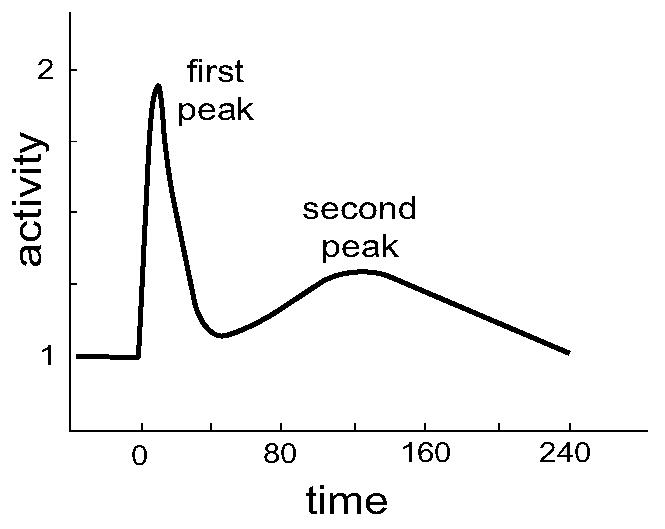
Existence of a second peak. This graph shows the typical biphasic response observed in Dictyostelium after a spatially-uniform, step change in chemoattratant stimulation. The data here is representative of experimental data from [14, 15].
Currently, the origin of the second peak is unknown, though it has been observed that its appearance correlates with the capacity of cells to extend lateral pseudopods in response to changes in the direction of a chemotactic gradient [14].
In this paper we use tools from control engineering to study these second peaks. We begin by presenting a general model that has been used to explain the adaptation property observed in Dictyostelium. We also present a series of variations that differ slightly in the way that their components are interconnected, but which maintain the perfect adaptation property. We then present our main results. We conjecture the existence of a feedback connection between the response and stimulus and then show that this feedback path can account for the biphasic response observed in cells. Finally, we discuss the implications of these models, including the possible existence of the feedback loop, and present some concluding remarks.
2 Mathematical models
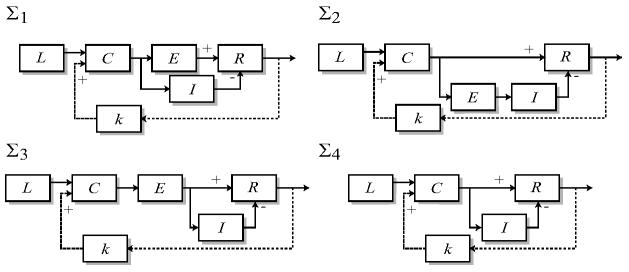
A number of mathematical models that describe the chemoattractant-induced response of Dictyostelium cells have recently appeared; see [16] for a review. Here we describe a model that has been suggested to explain the adaptation mechanism found in Dictyostelium [2, 17-20]. We begin by postulating the existence of a response regulator that can exist in both active and inactive forms; see Fig. 3. The response can be identified with components whose active concentrations exhibit the biphasic response seen in Fig. 2; for example, In Dictyostelium, the response R can represent the binding sites for PI3K and PTEN that exist on the cell membrane [19], or components that appear downstream of this process, such as PI(3,4,5)P3 or F-actin.
Fig. 3.
Models for adaptation. The response (R) of each of the four systems illustrated here exhibit perfect adaptation to step changes in the level of chemoattractant (L). They differ in the way that the excitation (E) and inhibition (I) subprocesses are regulated and contribute to the response. The proposed positive feedback loop (dotted line) has gain k and adds additively at the level of C. In relation to the biochemical description of Fig. 1, cAMP is represented by L whereas C can represent the G-proteins. The response R can be associated with the levels of PI3K or PTEN. The precise biochemical entities associated with E and I are unknown.
We assume that the activation and inactivation are regulated by a pair of processes. The excitation (E) process induces an increase in the level of the response, whereas the inhibition (I) process lowers the response. Using mass action dynamics, an equation for the system is
| (1) |
Here R(t) represents the concentration of the active response regulator and RT that of the total response regulator. The steady-state level of the response is given by
| (2) |
where KR = k−r/kr. We also assume that the excitation and inhibition processes are, in turn, regulated by the external signal C which is proportional to chemoattractant concentration:
| (3) |
| (4) |
It follows that the steady-state levels of both E and I are proportional to that of C. Hence, it is easy to see from (2) that the steady-state concentration of active response regulators is independent of chemoattractant concentration and equals the prestimulus level. It follows that the system is rejecting the step changes in chemoattractant and thereby displaying perfect adaptation.
Some observations about this system can be made. First, in analyzing the steady-state behavior of the system, we have assumed stability. It is possible to show that if the input satisfies C(t) ≥ ε > 0, then the system is uniformly bounded-input, bounded-output stable [20]. If we assume that the input is constant C > 0, then the system is uniformly exponentially stable.
Second, since perfect adaptation amounts to the rejection of step disturbances, we expect that this system can be expressed with an integrator in feedback; this is indeed the case [9, 20].
Third, though it is not relevant for the analysis of this paper, this system can be made to exhibit static spatial sensing if we allow for a diffusive inhibitor. That is, whenever a spatially inhomogeneous C is applied, the response also exhibits this property [17, 18].
Finally, note that to generate step increases in response to the chemotactic source — as is seen with the membrane-bound concentration of PI3K — we require that, transiently, the increase in E(t) be larger than that of I(t). If this is the case, C(t) also increases transiently causing an increase in the concentration of R(t). This is guaranteed, provided that k−e > k−i. Alternatively, a step decrease in the response — as is seen with the membrane-bound concentration of PTEN — is obtained when k−e < k−i.
2.1 Other perfectly adapting systems
The model presented above has been tested experimentally by measuring the response of Dictyostelium cells to varying combinations of temporal and spatial stimuli [21]. Strong agreement with the model has been observed [19]. However, there is still no direct evidence for the existence of this particular topology. In fact, as we now show, we can design other systems that also show perfect adaptation.
Typically we assume that so that we can replace
The combination of (1), (3) and (4) can now be written as:
Several modifications are possible. For example, the following two systems
and
both achieve perfect adaptation. They differ from Σ1 only in the roles that the excitation and source take as the “inputs” to either the inhibitor or response equations. For example, in Σ2, the inhibitor is stimulated by E rather than C. In Σ3, the response is stimulated by E rather than C. Since, at steady-state, both these signals are proportional to each other, there is no change in the fact that the level of C does not show up in the steady-state concentration of R. This ability to replace E and C interchangeably suggests that the excitation subprocess can be eliminated completely, leading to the following second order system.
This type of system has been referred to as a “sniffer” since our sense of smell is believed to operate in this manner [22].
The four systems described above exhibit step disturbance rejection. However, their behavior in the presence of feedback may not be equivalent. By examining this behavior, we may determine whether one topology gives rise to behavior that is closer to that observed in experiments.
3 Results
We consider the possibility that the observed second peak may be the manifestation of a lightly damped system. This would suggest that the behavior of the system is dominated by a pair of lightly damped poles. Moreover, we postulate that these poles may arise from a feedback between the response in these systems and the input. We first test this hypothesis through a root locus analysis on the transfer functions of the linearized systems about a biologically feasible operating point. We note that the linearization analysis is effective for small variations about the operating point. i.e., if we apply a small step input from the operating point to both the linearized and the nonlinear systems, we should expect similar behaviors.
Before analyzing the response of these systems under the effects of feedback, we note that through a change of variables, we can reduce these systems to a unitless system [17]. In particular, in system Σ1, denote r = R/RT as the fraction of active response regulators, τ = k−et as the dimensionless time, and e = (kr/k−e)E, and as dimensionless concentrations. The system reduces to:
where α = k−i/k−e and β = [(k−r/kr)(k−e/ke)]/(k−i/ki).
With this formulation we see that, for a given fixed input c0, the equilibrium satisfies
Linearizing this system, with input c and output y = r, about this equilibrium generates the transfer function
where γ = c0β.
From this transfer function we observe the presence of a zero at s = 0, which guarantees the asymptotic rejection of steps. We also see that, if α = 1, changes in the external signal are not detected because the excitation and inhibition processes are identical and their effects on the equation for r cancel each other. Thus, the external signal has no effect on the response. If α > 1 the inhibitor is faster than the excitation leading to a negative response from a positive input.
Using the changes of variables found in Table 3, systems Σ2–Σ4 can be processed similarly to obtain the transfer functions:
We note that, as expected, all the transfer functions have a zero at s = 0.
3.1 Effects of feedback
We now consider the effects of feedback on the response of this system. We assume that the stimulus c consists of both a contribution from the external source l and feedback from r:
| (5) |
where k is the gain of the feedback loop.
We recognize, however, that linearizing a system with feedback is not the same as applying feedback to the linearized system and that the latter does not give an accurate description of the nonlinear system near the operating point. Instead, it is necessary to apply the feedback before linearizing.
First, we apply feedback to the nonlinear system σ1 directly:
Second, we linearize while keeping the feedback gain k as a variable parameter. The resulting transfer function from input l to output r is:
where γ = β l0. Note that the numerator, and specifically the zero at s = 0, is not affected by the order of linearization and feedback.
We now use the root locus method to study the effect of the feedback gain k on the poles of Ḡ1(s). This is equivalent to studying the effect of a feedback gain on the open loop transfer function:
Note that G̃1(s) ≠ G1(s). Moreover, positive feedback on the original system appears as negative feedback in the root locus analysis, since the sign before k in the denominator of Ḡ1(s) is positive.
From a simple root locus plot (Fig. 4) we observe that, for both positive and negative feedbacks, a range of gains guarantee complex-valued closed-loop poles. When negative feedback is used, the two fastest poles join to form a complex pair while the slower pole remains real and migrates to the right, towards +∞. For stabilizing gain parameters, this results in slower responses as the (absolute) value of the feedback gain is increased. Thus, we might expect that the contribution of the complex poles is overshadowed by the slower pole and that no biphasic response would be observed. We found this to be the case.
Fig. 4.
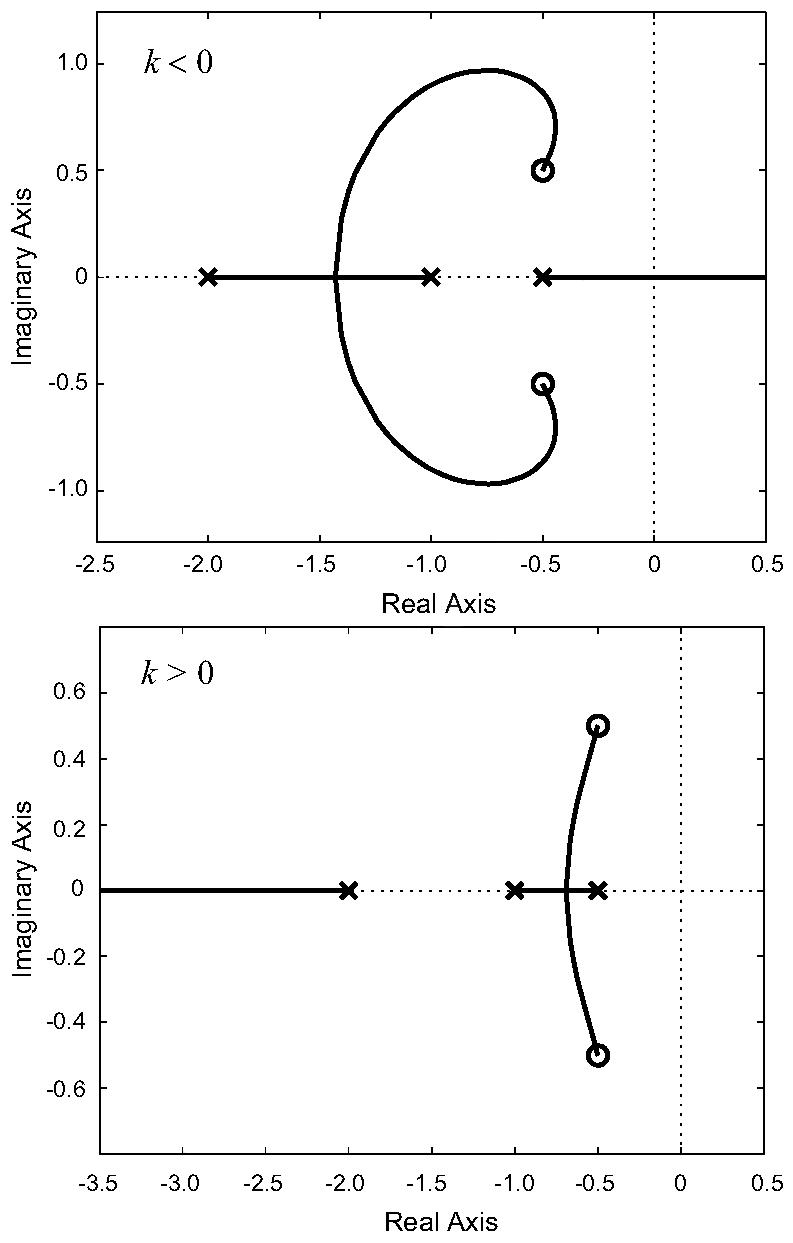
Root locus analysis. The plots show the root locus analysis for the open loop transfer function G̃1(s) assuming negative and positive feedback loops. For these plots we have assumed that α = 0.5, β = 2, l = 1. When negative feedback is used, the dominant pole is real. Two complex poles appear but they do not influence the step response greatly. With positive feedback, the complex poles are now closest to the imaginary axis. This elicits an under-damped response and may explain the appearance of a second peak.
Under positive feedback, it is the two slower poles that join and form a complex conjugate pair, while the fast (real) pole moves towards −∞. We now expect that the complex poles dominate and that they may elicit a biphasic response after a step input. This was confirmed, both for the linearized and nonlinear systems; see Fig. 5.
Fig. 5.
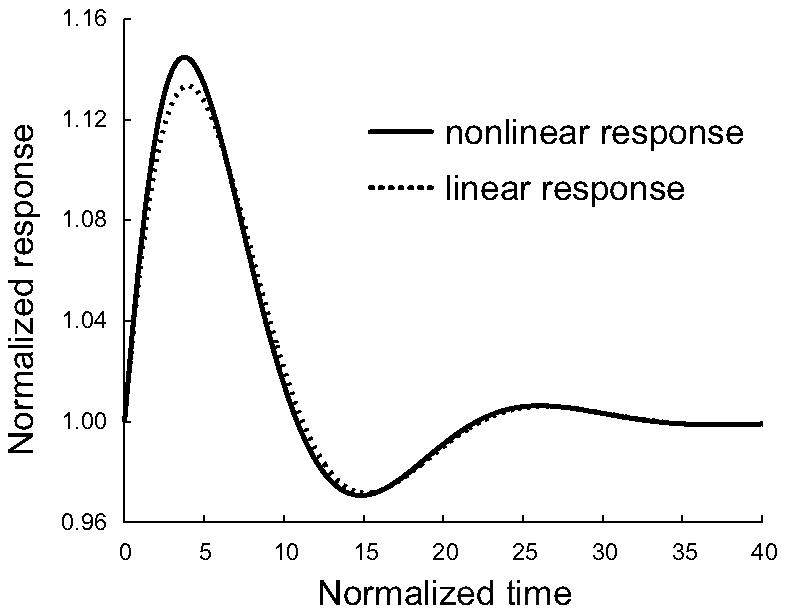
Step response of σ1. We simulated the effect of positive feedback on systems σ1. We did this for both the original nonlinear and the linearized system. Parameters are α = 0.1,β = 4,k = 40 and l = 1.
3.2 Effect of feedback on systems Σ2–Σ4
We now proceed to analyze systems Σ2–Σ4 as we did for Σ1. First we non-dimensionalize to get normalized systems σ2–σ4 using the variable changes shown in Table 3; these systems are given in the appendix. We then apply feedback and obtain the corresponding equilibria. Finally, we linearize these systems about these equilibria to obtain the transfer functions:
As expected, all transfer functions still have a zero at s = 0 that guarantees step disturbance rejection. However, these transfer functions differ from Ḡ1(s) in two respects. We observe that no value of α generates an identically-zero output as was seen in G1(s). Moreover, in contrast to Ḡ1(s), it is impossible to generate a negative response to a positive step.
To find poles of these systems, we can use root locus method on the following open loop transfer functions respectively:
By comparing the location of the open-loop poles and zeros of G̃2(s)−G̃4(s) with those of G̃1(s) we can predict their behavior under feedback.
System Σ3: G̃1(s) and G̃3(s) differ only in that the zeros of G̃(s) are slightly farther away from the imaginary axis and closer to the real axis than those of G̃3(s). Under feedback, this translates to the closed-loop pair of complex poles associated with Σ1 also being further from the imaginary axis and closer to the real axis than those of Σ3. Nevertheless, since the transfer functions for these two systems differ minimally, their root locus diagrams also differ minimally, and the systems are expected to give similar performance in terms of the size of the second peak, with Σ3 expected to have a slightly larger. Thus the two transfer functions generate approximately the same normalized closed-loop behavior.
System Σ4: This system is easy to analyze since it has only two open-loop poles. When k < 0, these poles are always real, and hence no oscillatory behavior is to be expected. However, when k > 0 the root locus for this system behaves similarly to that of G̃1(s).
System Σ2: The only transfer function which gives rise to a significantly different root locus than G̃1(s) is G̃2(s), because of the absence of zeros. It is easy to see that in both positive feedback and negative feedback cases, when the magnitude of the feedback gain k is sufficiently large, one pair of real poles meet and become a pair of complex poles. When k > 0, the complex closed-loop poles are to the right of the real closed-loop pole, and so dominate. In contrast, when k < 0 the real closed-loop pole dominates as it is to the right of the complex pair of closed-loop poles. Moreover, when k > 0, owing to the absence of zeros, the complex pair of closed-loop poles is free to cross the imaginary axis for sufficiently large feedback gain. This potentially gives rise to a Hopf Bifurcation in the nonlinear system, which may lead to sustained oscillations. We did indeed found this to be the case.
In summary, for all four systems, positive feedback was able to generate damped oscillations as it led to a pair of dominant complex-conjugate poles. Moreover, system Σ2 is expected to have the largest oscillations, potentially leading to a limit cycle.
3.3 Other considerations
The need to account for biphasic behavior in the cellular response is not the end of the story. In choosing our parameter values we must take care to match other physical characteristics of the cell as well. For example, the first peak of the response should be roughly 1.5–2 times the basal (steady state) level. We find that, while increasing feedback gain is able to produce much more pronounced second peaks, it comes at the price of reducing the size of the first peak. Preserving the size of the first peak, we find that the best second peak performance comes from system σ2 as shown in Fig. 6. In our analysis, the size of the second peak is smaller than that observed experimentally. One possible explanation is that higher feedback gains are needed and that the size of the first peak is constrained by saturations that we have not modeled. Nevertheless, the precise explanation will is not clear and may require both more quantitative experimental data as well as a more detailed model.
Fig. 6.
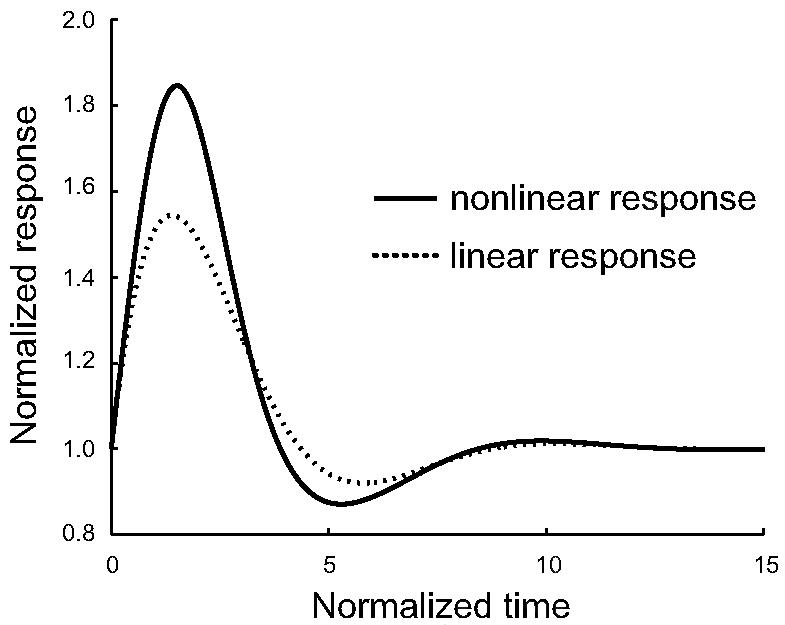
Step response to σ2. We simulated the effect of positive feedback on systems σ2–σ4. We did this for both the original nonlinear and the linearized system. Though all four systems had approximately the same response, the response shown here for σ2 produces the largest second peak. Parameters are α = 0.6,β = 1,k = 1 and l = 1.
It is interesting to note that, in this curve the response dips below the initial value in the time frame between the first and second peaks. Such behavior has been observed in some actin-polymerization curves; see, for example, [15, Fig. 5].
4 Discussion
Until recently, the nature of the second phase of chemoattractant-induced PI(3,4,5)P3 accumulation and actin polymerization in Dictyostelium cells has not been fully appreciated, possibly because it is difficult to observe unless conditions are carefully controlled [14]. Moreover, its origin is completely unknown.
In this paper we have shown, using straightforward tools from control engineering, that a possible source for the biphasic response is the existence of a positive feedback loop. To do so we have used a simple family of models that explains the adaptive chemoattractant-induced response observed in Dictyostelium cells. While other models have been proposed to account for this adaptation, experiments have demonstrated that the cellular response is consistent with the models used in this paper [19, 21].
Using linearization of this family of models and root-locus analysis we have shown that negative feedback can be used to obtain closed-loop systems with complex poles, but that these complex poles are relatively fast compared to the dominant real pole. Hence, any oscillatory contribution to the response from these poles is insignificant.
In contrast, by postulating a positive feedback connection between the response and stimulus, complex poles also arise, but these are slower than the real poles and hence dominate. Thus, biphasic responses can be obtained that are more reminiscent of the response curves observed experimentally. Moreover, the analysis also shows the possibility of obtaining limit cycle oscillations using this system. This is significant since, unstimulated cells also polymerize actin and migrate in random directions. Our results suggest that this migration may be mediated by positive feedback.
We have conjectured the presence of a positive feedback path based on the observed biphasic step response. However, even if such a feedback path is indeed present, it is not likely that its purpose be to generate such a time-domain response. More likely, positive feedback is present as a means of amplifying the effects of spatially heterogeneous external signals, so that shallow chemoattractant gradients can elicit sharp distinctions between the cell front and back. Moreover, such positive feedbacks can lead to bistable switches that can polarize the cell (so that, even in the absence of a spatial chemoattractant gradient, the cell maintains well defined fronts and backs). Mathematical models of chemotaxis that rely on such positive feedback to achieve amplification and polarization exist; see [16] and the references therein for a discussion.
The model presented here is quite simple and is not representative of the complexity of the chemotaxis pathway of Dictyostelium or any other cell. For example, in these cells it is believed that two separate, independent pathways regulate PI(3,4,5)P3 production, and that several nonlinearities are of importance [19]. Moreover, this system is spatially distributed and consequently should be analyzed using PDEs. Nevertheless, our analysis shows how simple tools from control engineering can be used to help decode an important cellular process. Based on our findings, we can go to investigate the effect of positive feedback pathways on a more realistic model of the chemoattractant-induced response.
Because the particular form of the positive feedback is not known, we have chosen the easiest to implement and analyze (5), though perhaps not the most realistic. In fact, Dictyostelium cells do synthesize and secrete chemoattractant which then finds its way to the receptor. This positive feedback fits the model described by (5) and is believed to lead to oscillatory behavior observed [9,23]. However, this is a much slower response, the oscillatory period is in the order of seven minutes, and not the fast second peak that we are trying to explain here. One possible explanation for the feedback suggested by (5) is that PI(3,4,5)P3 accumulation may lead to a greater availability of G-proteins which can then be stimulated by the chemoattractant-occupied receptors; see Fig. ??.
Our analysis also sheds light on the likely topology of some of the unknown components of the system. For example, based on the results of this paper, it is more likely that the topology be based on system Σ2 because this system gives rise to second peaks that are closest to those observed experimentally.
Having suggested the existence of a positive feedback loop, it is worth considering whether any evidence of such a loop has been reported experimentally, and what experiments could be used to detect its effect.
In human neutrophils, where the signaling pathway resembles that of Dictyostelium closely, it has been demonstrated that localization of PI(3,4,5)P3 induces actin polymerization localized to the leading pseudopods. This, in turn, stimulates PI(3,4,5)P3 synthesis, thereby completing a positive feedback loop [24-26].
The positive feedback loop found in neutrophils could correspond to that proposed for Dictyostelium cells here, for example, if the positive feedback pathway acts upstream of PI(3,4,5)P3. This can be tested experimentally by stimulating cells that have been treated by an inhibitor of actin polymerization, such as Latrunculin or Cytochalasin. These cells do have a strong initial response to chemoattractant [21]. If the feedback is actin-mediated, no second peak would be observed in these cells. This experiment has not been done but we believe that it would be easy to carry out.
The results of this paper also have wider implications beyond chemotaxis. In systems where biochemical interactions follow mass-action dynamics, along the form:
then the transfer function from the first component to the last, will have a series of real stable roots. To obtain complex poles requires the presence of feedback loops. However, one of the tendencies of these feedback loops is to lead the system to oscillatory behavior and the possible destabilization of an otherwise stable system. [27].
Table 1.
Parameter changes. Each of the systems Σ1–Σ4 can be non-dimensionalized using these parameter changes. In each row, the ratio between the dimensional (e.g. t) and nondimensional (e.g. τ) parameter is given. The bottom two rows give the values of α and β in terms of the original kinetic coefficients for the model equations found in the appendix.
| σ1 | σ2 | σ3 | σ4 | |
|---|---|---|---|---|
| τ/t | k−e | k−e | k−e | k−i |
| e/E | kr/k−e | kr/k−e | kr/k−e | – |
| i/I | kr/ki | |||
| r/R | 1/RT | k−e/ke | 1/RT | 1/RT |
| c/C | k−i/kr | |||
| α | k−i/k−e | k−i/k−e | ki/kr | – |
| β |
A Appendix
The system equations for the non-dimensionalized systems are given by:
Footnotes
This work was supported in part by the Whitaker Foundation, the National Science Foundation's Biocomplexity program, through grant number DMS-0083500, and NIH grant 71920.
References
- 1.Berg HC. Random Walks in Biology, Expanded Edition. Princeton UP; Princeton: 1993. [Google Scholar]
- 2.Parent CA, Devreotes PN. A cell's sense of direction. Science. 1999;284:765–70. doi: 10.1126/science.284.5415.765. [DOI] [PubMed] [Google Scholar]
- 3.Moser B, Wolf M, Walz A, Loetscher P. Chemokines: multiple levels of leukocyte migration control. Trends in Immunology. 2004;25:75–84. doi: 10.1016/j.it.2003.12.005. [DOI] [PubMed] [Google Scholar]
- 4.Dickson BJ. Molecular mechanisms of axon guidance. Science. 2002;298:1959–1964. doi: 10.1126/science.1072165. [DOI] [PubMed] [Google Scholar]
- 5.Yi TM, Huang Y, Simon MI, Doyle J. Robust perfect adaptation in bacterial chemotaxis through integral feedback control. Proc. National Academy Sciences USA. 2000;97:4649–4653. doi: 10.1073/pnas.97.9.4649. [DOI] [PMC free article] [PubMed] [Google Scholar]
- 6.Lauffenburger DA. Cell signaling pathways as control modules: Complexity for simplicity? Proc. National Academy Sciences USA. 2000;97:5031–5033. doi: 10.1073/pnas.97.10.5031. [DOI] [PMC free article] [PubMed] [Google Scholar]
- 7.Sontag ED. Adaptation and regulation with signal detection implies internal model. Systems and Control Letters. 2003;50:119–126. [Google Scholar]
- 8.Kessin R. Dictyostelium: Evolution, cell biology, and the development of multicellularity. Cambridge UP; Cambridge: 2001. [Google Scholar]
- 9.Iglesias PA. Feedback control in intracellular signaling pathways: Regulating chemotaxis in Dictyostelium discoideum. European J. Control. 2003;9:216–225. [Google Scholar]
- 10.Manahan CL, Iglesias PA, Long Y, Devreotes PN. Chemoattractant signaling in Dictyostelium discoideum. Annual Review of Cell and Developmental Biology. 2004;20:233–253. doi: 10.1146/annurev.cellbio.20.011303.132633. [DOI] [PubMed] [Google Scholar]
- 11.Condeelis J, Hall A, Bresnick A, Warren V, Hock R, Bennett H, Ogihara S. Actin polymerization and pseudopod extension during amoeboid chemotaxis. Cell Motility and the Cytoskeleton. 1988;10:77–90. doi: 10.1002/cm.970100113. [DOI] [PubMed] [Google Scholar]
- 12.Norgauer J, Krutmann J, Dobos GJ, Traynor-Kaplan AE, Oades ZG, Schraufstatter IU. Actin polymerization, calcium-transients, and phospholipid metabolism in human neutrophils after stimulation with interleukin-8 and N-formyl peptide. J. Investigations in Dermatology. 1994;102:310–314. doi: 10.1111/1523-1747.ep12371788. [DOI] [PubMed] [Google Scholar]
- 13.Postma M, Roelofs J, Goedhart J, Gadella TW, Visser AJ, Van Haastert PJ. Uniform cAMP stimulation of Dictyostelium cells induces localized patches of signal transduction and pseudopodia. Molecular Biology of the Cell. 2003;14:5019–5027. doi: 10.1091/mbc.E03-08-0566. [DOI] [PMC free article] [PubMed] [Google Scholar]
- 14.Chen L, Janetopoulos C, Huang YE, Iijima M, Borleis J, Devreotes PN. Two phases of actin polymerization display different dependencies on PI(3,4,5)P3 accumulation and have unique roles during chemotaxis. Molecular Biology of the Cell. 2003;14:5028–5037. doi: 10.1091/mbc.E03-05-0339. [DOI] [PMC free article] [PubMed] [Google Scholar]
- 15.Firtel RA. Dictyostelium PAKc is required for proper chemotaxis. Molecular Bioloy of the Cell. 2004;15:5456–5469. doi: 10.1091/mbc.E04-04-0323. [DOI] [PMC free article] [PubMed] [Google Scholar]
- 16.Iglesias PA, Levchenko A. Modeling the cell's guidance system. Science's STKE. 2002;2002:re12. doi: 10.1126/stke.2002.148.re12. [DOI] [PubMed] [Google Scholar]
- 17.Levchenko A, Iglesias PA. Models of eukaryotic gradient sensing: Application to chemotaxis of amoebae and neutrophils. Biophysical J. 2002;82:50–63. doi: 10.1016/S0006-3495(02)75373-3. [DOI] [PMC free article] [PubMed] [Google Scholar]
- 18.Kutscher B, Devreotes P, Iglesias PA. Local excitation, global inhibition mechanism for gradient sensing: An interactive applet. Science's STKE. 2004;2004:pl3. doi: 10.1126/stke.2192004pl3. [DOI] [PubMed] [Google Scholar]
- 19.Ma L, Janetopoulos C, Yang L, Devreotes PN, Iglesias PA. Two local excitation, global inhibition mechanisms acting complementarily in parallel can explain the chemoattractant-induced PI(3,4,5)P3 response in Dictyostelium. Biophysical J. 87:3764–3774. doi: 10.1529/biophysj.104.045484. [DOI] [PMC free article] [PubMed] [Google Scholar]
- 20.Paliwal S, Ma L, Krishnan J, Levchenko A, Iglesias PA. Responding to directional cues: A tale of two cells. Control Systems Magazine. 2004 August;24(4):77–90. [Google Scholar]
- 21.Janetopoulos C, Ma L, Devreotes PN, Iglesias PA. Chemoattractant-induced phosphatidylinositol 3,4,5-trisphosphate accumulation is spatially amplified and adapts, independent of the actin cytoskeleton. Proc. National Academy Sciences USA. 2004;101:8951–8956. doi: 10.1073/pnas.0402152101. [DOI] [PMC free article] [PubMed] [Google Scholar]
- 22.Tyson JJ, Chen KC, Novak B. Sniffers, buzzers, toggles and blinkers: dynamics of regulatory and signaling pathways in the cell. Current Opinion in Cell Biology. 2003;15:221–231. doi: 10.1016/s0955-0674(03)00017-6. [DOI] [PubMed] [Google Scholar]
- 23.Laub MT, Loomis WF. A molecular network that produces spontaneous oscillations in excitable cells of Dictyostelium. Molecular Biology of the Cell. 1998;9:3521–3532. doi: 10.1091/mbc.9.12.3521. [DOI] [PMC free article] [PubMed] [Google Scholar]
- 24.Niggli V. A membrane-permeant ester of phosphatidylinositol 3,4,5-trisphosphate (PIP3) is an activator of human neutrophil migration. FEBS Letters. 2000;473:217–221. doi: 10.1016/s0014-5793(00)01534-9. [DOI] [PubMed] [Google Scholar]
- 25.Weiner OD, Neilsen PO, Prestwich GD, Kirschner MW, Cantley LC, Bourne HR. A PtdInsP(3)- and Rho GTPase-mediated positive feedback loop regulates neutrophil polarity. Nature Cell Biology. 2002;4:509–513. doi: 10.1038/ncb811. [DOI] [PMC free article] [PubMed] [Google Scholar]
- 26.Srinivasan S, Wang F, Glavas S, Ott A, Hofmann F, Aktories K, Kalman D, Bourne HR. Rac and Cdc42 play distinct roles in regulating PI(3,4,5)P3 and polarity during neutrophil chemotaxis. J. Cell Biology. 2003;160:375–385. doi: 10.1083/jcb.200208179. [DOI] [PMC free article] [PubMed] [Google Scholar]
- 27.Goodwin BC. Oscillatory behavior in enzymatic control processes. Advances in Enzyme Regulation. 1965;3:425–428. doi: 10.1016/0065-2571(65)90067-1. [DOI] [PubMed] [Google Scholar]


