

Abstract
Background
Activation of naïve B lymphocytes by extracellular ligands, e.g. antigen, lipopolysaccharide (LPS) and CD40 ligand, induces a combination of common and ligand-specific phenotypic changes through complex signal transduction pathways. For example, although all three of these ligands induce proliferation, only stimulation through the B cell antigen receptor (BCR) induces apoptosis in resting splenic B cells. In order to define the common and unique biological responses to ligand stimulation, we compared the gene expression changes induced in normal primary B cells by a panel of ligands using cDNA microarrays and a statistical approach, CLASSIFI (Cluster Assignment for Biological Inference), which identifies significant co-clustering of genes with similar Gene Ontology™ annotation.
Results
CLASSIFI analysis revealed an overrepresentation of genes involved in ion and vesicle transport, including multiple components of the proton pump, in the BCR-specific gene cluster, suggesting that activation of antigen processing and presentation pathways is a major biological response to antigen receptor stimulation. Proton pump components that were not included in the initial microarray data set were also upregulated in response to BCR stimulation in follow up experiments. MHC Class II expression was found to be maintained specifically in response to BCR stimulation. Furthermore, ligand-specific internalization of the BCR, a first step in B cell antigen processing and presentation, was demonstrated.
Conclusion
These observations provide experimental validation of the computational approach implemented in CLASSIFI, demonstrating that CLASSIFI-based gene expression cluster analysis is an effective data mining tool to identify biological processes that correlate with the experimental conditional variables. Furthermore, this analysis has identified at least thirty-eight candidate components of the B cell antigen processing and presentation pathway and sets the stage for future studies focused on a better understanding of the components involved in and unique to B cell antigen processing and presentation.
Background
Naïve mature B cells in peripheral lymphoid organs respond to a variety of extracellular signals through the activation of signal transduction pathways initiated by the B cell antigen, pattern-recognition, cytokine and chemokine receptors. B cell responses to signaling depend on the combination of ligands present, and include activation, proliferation, migration, differentiation, isotype class switching, somatic hypermutation, anergy, and apoptosis [1,2]. Once activated, B cells can also serve as antigen presenting cells that preferentially present antigens recognized by their specific BCR. In contrast, dendritic cells and macrophages present varied antigens that are acquired less specifically through phagocytosis, macropinocytosis and receptor-mediated endocytosis via pattern-recognition receptors such as the mannose receptor.
BCR-specific antigen processing and presentation is initiated by BCR-mediated signal transduction triggered by antigenic stimulation [3,4]. Antigen is then internalized by receptor-mediated endocytosis and trafficked through endosomes for acidification and fusion with lysosomes containing pH-sensitive hydrolytic enzymes for antigen processing. Endolysosomes containing processed antigenic peptides fuse with Golgi-derived vesicles containing MHC class II molecules assembled with invariant chain (Ii). The CLIP fragment of Ii bound in the cleft of the class II aβ dimer is replaced by antigen-derived peptides and the complex trafficked to the cell surface through vesicle secretory pathways.
It is well known that B cell antigen processing and presentation mediated through the BCR far exceeds the efficiency of presentation of the same antigen by macrophages or dendritic cells [5]. The mechanism giving rise to this increased efficiency has not been fully determined but appears to be a unique aspect of BCR-mediated antigen capture and processing as opposed to changes in the basic antigen processing and presentation machinery [6]. One mechanism that may contribute to efficiency is accelerated trafficking of BCR/antigen complexes to Class II containing vesicles inside the cell [7]. However, the molecular mediators of this vesicle trafficking, especially those components uniquely involved in the highly efficient B cell antigen processing and presentation pathway, have remained largely unknown.
We analyzed a B cell microarray dataset comparing the responses of normal splenic B cells to 32 individual ligands. This study was designed to determine functionally important input signals to contribute to the understanding of normal B cell biology and differs from existing B cell microarray studies which largely compare normal B cells to B cell lymphomas to identify tumor-specific gene expression changes. By combining this gene expression microarray analysis with bioinformatics analyses and functional assays, we have identified a set of specific genes that appear to be involved in BCR-mediated antigen capture, vesicle function and vesicle trafficking during B cell antigen processing and presentation. These data provide a foundation for the molecular characterization of this important immunological process.
Results
Microarray analysis of ligand-treated B lymphocytes
Purified B lymphocytes were treated in culture with 32 different ligands over a timecourse of 30 min, 1 hr, 2 hr, and 4 hr. A detailed description of the data set has been published [8]. Following filtering, normalization and SAM analysis, genes that were differentially expressed by each ligand in comparison with time-matched, untreated controls were identified. Of the 32 ligands, CD40L, LPS, and AIG caused the most gene expression changes, especially at the 4 hr timepoint (Figure 1B). Further analysis focuses on these three immunologically-important ligands. Categorical values of 1, -1, and 0 (representing significantly upregulated, downregulated, or unchanged) were used to group genes together based on their expression response patterns (Table 1). Genes not differentially expressed under at least one treatment condition were omitted from further analysis. Based on 3 ligand combinations and a possibility of 3 outcomes for each ligand (1, -1, 0), there are a possible 33 or 27 gene clusters, with the (0, 0, 0) outcome excluded since only genes that were differentially expressed under at least one treatment condition were selected (26 possible gene clusters). In our dataset, we only observe 19 of these possible 26. A variety of different expression patterns were observed. For example, Gene Cluster #1 contains genes that are upregulated by all three ligands, whereas Gene Cluster #14 contains genes that are only upregulated in response to LPS.
Figure 1.
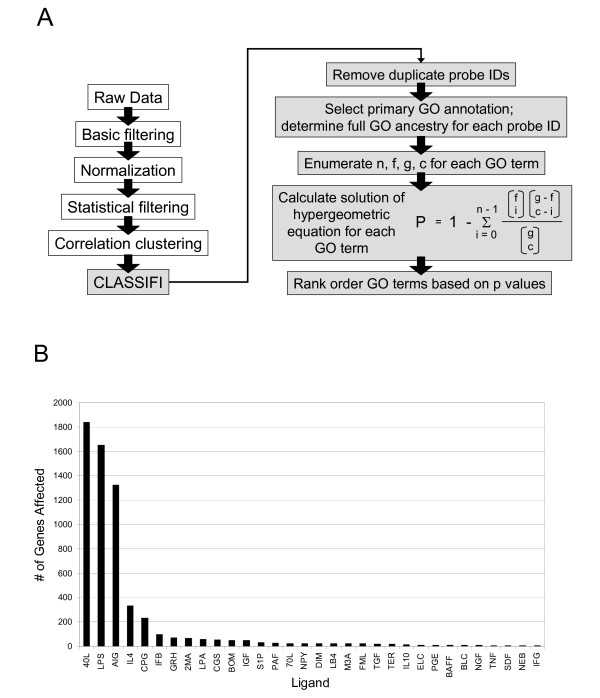
Experimental methodology and analysis of microarray data. (A) Schematic of steps performed during microarray data processing. Gray boxes indicate steps performed as part of the CLASSIFI component of the analysis. See text for details. (B) The number of genes whose expression was significantly changed at the 4 hr timepoint as determined by SAM is shown for each of 32 ligands. Abbreviations and descriptions for each ligand can be found at [22]. 40L = CD40L (anti-CD40), LPS = Lipopolysaccharide, and AIG = anti-IgM.
Table 1.
Clustering and CLASSIFI results for data from 3 ligands
| GO ID | g | f | c | n | expt | prob | GO type | GO term | Cluster ID | anti-CD40 | LPS | AIG |
| GO:0005634 | 2490 | 254 | 380 | 64 | 38.76 | 8.71E-06 | CC | Nucleus | 1 | 1 | 1 | 1 |
| GO:0009058 | 2490 | 141 | 180 | 25 | 10.19 | 1.36E-05 | BP | biosynthesis | 2 | 1 | 1 | |
| GO:0008372 | 2490 | 1409 | 1 | 1 | 0.566 | 5.66E-01 | CC | CC unknown | 3 | 1 | -1 | -1 |
| GO:0046072 | 2490 | 2 | 160 | 2 | 0.129 | 4.10E-03 | BP | dTDP metabolism | 4 | 1 | 1 | |
| GO:0009605 | 2490 | 30 | 3 | 2 | 0.036 | 4.18E-04 | BP | response to external stimulus | 5 | 1 | -1 | |
| GO:0016655 | 2490 | 14 | 331 | 11 | 1.861 | 4.94E-08 | MF | oxidoreductase activity, acting on NADH | 6 | 1 | ||
| GO:0005773 | 2490 | 12 | 11 | 4 | 0.053 | 1.00E-07 | CC | Vacuole | 7 | -1 | -1 | 1 |
| GO:0003779 | 2490 | 15 | 277 | 9 | 1.669 | 6.30E-06 | MF | actin binding | 8 | -1 | -1 | -1 |
| GO:0016758 | 2490 | 6 | 245 | 4 | 0.59 | 1.17E-03 | MF | Transferase activity, transferring hexosyl groups | 9 | -1 | -1 | |
| GO:0006417 | 2490 | 2 | 4 | 1 | 0.003 | 3.21E-03 | BP | regulation of protein biosynthesis | 10 | -1 | 1 | |
| GO:0008372 | 2490 | 1409 | 41 | 32 | 23.2 | 3.30E-03 | CC | CC unknown | 11 | -1 | -1 | |
| GO:0008047 | 2490 | 10 | 160 | 3 | 0.643 | 2.23E-02 | MF | enzyme activator activity | 12 | -1 | ||
| GO:0006397 | 2490 | 19 | 56 | 4 | 0.427 | 6.92E-04 | BP | mRNA processing | 13 | 1 | 1 | |
| GO:0005576 | 2490 | 156 | 183 | 33 | 11.47 | 7.28E-09 | CC | extracellular | 14 | 1 | ||
| GO:0046916 | 2490 | 1 | 4 | 1 | 0.002 | 1.61E-03 | BP | transition metal ion homeostasis | 15 | -1 | 1 | |
| GO:0003931 | 2490 | 3 | 38 | 2 | 0.046 | 6.74E-04 | MF | Rho small monomeric GTPase activity | 16 | -1 | -1 | |
| GO:0004032 | 2490 | 3 | 188 | 3 | 0.227 | 4.24E-04 | MF | aldehyde reductase activity | 17 | -1 | ||
| GO:0015672 | 2490 | 10 | 191 | 7 | 0.767 | 1.38E-06 | BP | monovalent inorganic cation transport | 18 | 1 | ||
| GO:0016892 | 2490 | 3 | 50 | 2 | 0.06 | 1.17E-03 | MF | endoribonuclease activity, producing other than | 19 | -1 |
Gene clusters (Cluster ID 1–19) resulting from categorical clustering of processed data from B cells stimulated with anti-CD40, LPS, and AIG. "1" = upregulated, "-1" = downregulated, and blank = no significant change. Following CLASSIFI analysis, the GO term giving rise to the lowest probability in each gene cluster is indicated. GO ID = a unique Gene Ontology identifier assigned to a GO term that corresponds to a defined molecular function (MF), biological process (BP), or cellular component (CC). g = number of probes in the data set, f = number of probes with associated GO ID in the data set, c = number of probes in the gene cluster, n = number of probes with associated GO ID in the gene cluster. Expt = the expected number of occurrences of a given GO ID in a given cluster of size (n) based on a random distribution. Prob = the probability that the GO ID co-cluster pattern has occurred by chance.
CLASSIFI analysis links gene clusters to cellular physiology
Microarray expression data can be full of experimental and biological noise, and many microarray probes are not well characterized. We developed a gene cluster classification method that circumvents these limitations and links biological function with gene expression patterns derived from microarray experiments. This method, termed CLASSIFI, uses Gene Ontology™ annotation to identify significant co-clustering of genes with similar biological properties, based on the postulate that genes involved in the same biological process would be coordinately expressed.
CLASSIFI utilizes the gene description database developed by the Gene Ontology™ (GO) Consortium [9] to reveal co-clustering of genes with similar biological properties. The GO annotates gene products with GO terms based upon their molecular function, biological process, and cellular component. These descriptive terms are structured in a directed acyclic graph of parent-child relationships, allowing a term to have multiple parents [10,11]. GO gene annotation has also been used by other groups as a tool for identifying biological processes relevant to gene expression profiling experiments [11-13].
CLASSIFI measures the probability of co-clustering for every gene ontology term designated to every gene in each gene cluster. Gene expression data clustering and gene cluster membership assignment generates the CLASSIFI input file (See Additional file 1). CLASSIFI captures all of the GO terms annotated to every probe and then calculates the probability of chance co-clustering of GO terms. The final CLASSIFI output is a list of every GO term, ranked within each gene cluster from lowest to highest probability (See Additional file 2).
The filtered data set contained 2545 probes, which led to the calculation of 5036 probabilities (See Additional file 3). The GO term with the lowest probability for each gene cluster is shown in Table 1. A significance cutoff of 1 × 10⁻⁵ was established using a Bonferroni correction with an alpha of 0.05 and an n of 5036 (see [14] and references therein). Six gene clusters give rise to GO terms with significant probabilities: Gene Cluster #1, 6, 7, 8, 14, and 18. Gene clusters identified by CLASSIFI to give significant probabilities exhibit predictable expression patterns that could be explained biologically, including gene clusters characterized by ligand-specific expression induction. Experimental noise may contribute to gene clusters with insignificant probabilities that show unusual expression patterns.
CLASSIFI results for some gene clusters are expected based on our current understanding of B cell physiology. For example, the GO term giving the lowest probability in Gene Cluster #1 is "nucleus". This gene cluster represents genes which are upregulated in response to all three ligands: AIG, CD40L, and LPS, and includes genes involved in transcription, replication and RNA processing. All three of these ligands induce cellular activation [1,2,15] and proliferation (data not shown), so we would expect these kinds of nuclear genes to be highly expressed in B cells stimulated with all three ligands. The GO term giving the lowest probability in Gene Cluster #6 is "oxidoreductase activity, acting on NADH or NADPH". It has recently been shown that stimulation through CD40 and other TNF family members results in the production of reactive oxygen species through NADPH [16]. Importantly, many of the GO terms giving the low probabilities in a given gene cluster are functionally related, e.g. monovalent inorganic ion transport, ion transport, transporter activity, and cation transport in Gene Cluster #18 (Table 2).
Table 2.
Excerpt of CLASSIFI results for six gene clusters giving significant probabilities
| GO ID | f | n | prob | GO type | GO term | Cluster ID |
| GO:0005634 | 254 | 64 | 8.71E-06 | CC | nucleus | 1 |
| GO:0005635 | 13 | 9 | 1.66E-05 | CC | nuclear membrane | 1 |
| GO:0006412 | 94 | 30 | 2.75E-05 | BP | protein biosynthesis | 1 |
| GO:0009059 | 94 | 30 | 2.75E-05 | BP | macromolecule biosynthesis | 1 |
| GO:0003743 | 20 | 10 | 2.68E-04 | MF | translation initiation factor activity | 1 |
| GO:0016655 | 14 | 11 | 4.94E-08 | MF | oxidoreductase activity, acting on NADH or NADPH, quinone or similar compound as acceptor | 6 |
| GO:0008137 | 14 | 11 | 4.94E-08 | MF | NADH dehydrogenase (ubiquinone) activity | 6 |
| GO:0015081 | 14 | 11 | 4.94E-08 | MF | sodium ion transporter activity | 6 |
| GO:0016651 | 16 | 11 | 4.61E-07 | MF | oxidoreductase activity, acting on NADH or NADPH | 6 |
| GO:0046873 | 16 | 11 | 4.61E-07 | MF | metal ion transporter activity | 6 |
| GO:0005773 | 12 | 4 | 1.00E-07 | CC | vacuole | 7 |
| GO:0016787 | 163 | 6 | 2.52E-05 | MF | hydrolase activity | 7 |
| GO:0005624 | 15 | 3 | 2.84E-05 | CC | membrane fraction | 7 |
| GO:0000267 | 18 | 3 | 5.05E-05 | CC | cell fraction | 7 |
| GO:0015991 | 3 | 2 | 5.31E-05 | BP | ATP hydrolysis coupled proton transport | 7 |
| GO:0003779 | 15 | 9 | 6.30E-06 | MF | actin binding | 8 |
| GO:0008092 | 22 | 9 | 3.08E-04 | MF | cytoskeletal protein binding | 8 |
| GO:0003785 | 6 | 4 | 1.88E-03 | MF | actin monomer binding | 8 |
| GO:0006357 | 10 | 5 | 2.58E-03 | BP | regulation of transcription from Pol II promoter | 8 |
| GO:0006355 | 79 | 17 | 4.85E-03 | BP | regulation of transcription, DNA-dependent | 8 |
| GO:0005576 | 156 | 33 | 7.28E-09 | CC | extracellular | 14 |
| GO:0005578 | 5 | 4 | 1.33E-04 | CC | extracellular matrix | 14 |
| GO:0004871 | 50 | 11 | 7.39E-04 | MF | signal transducer activity | 14 |
| GO:0004888 | 7 | 4 | 8.29E-04 | MF | transmembrane receptor activity | 14 |
| GO:0007166 | 25 | 7 | 1.59E-03 | BP | cell surface receptor linked signal transduction | 14 |
| GO:0015672 | 10 | 7 | 1.38E-06 | BP | monovalent inorganic cation transport | 18 |
| GO:0006811 | 23 | 10 | 2.65E-06 | BP | ion transport | 18 |
| GO:0005215 | 122 | 24 | 9.10E-06 | MF | transporter activity | 18 |
| GO:0006812 | 18 | 8 | 2.33E-05 | BP | cation transport | 18 |
| GO:0006754 | 4 | 4 | 3.36E-05 | BP | ATP biosynthesis | 18 |
The five GO IDs giving the lowest probability are listed for each of six gene clusters giving significant probabilities in Table 1. GO ID = a unique Gene Ontology identifier that corresponds to a defined molecular function, biological process, or cellular component (GO name). f = number of probes with the associated GO ID in the data set, n = number of probes with the associated GO ID in the gene cluster. prob = the probability that the GO ID co-cluster pattern has occurred by chance.
Experimental validation of CLASSIFI-derived biological predictions
CLASSIFI analysis should be viewed as a hypothesis-generating tool. While the statistical analysis is compelling, predictions that derive from the hypotheses should be verified experimentally. We were particularly interested in the AIG-specific Gene Cluster #18 because these genes represent biological processes that are unique to antigenic stimulation rather than the general activation responses induced by all three ligands. The GO term giving the lowest probability in Gene Cluster #18 is "monovalent inorganic cation transport" (GO:0015672). An examination of the genes annotated with this GO term revealed multiple components of the vacuolar ATPase H+ pump (Table 3). Since stimulation through the BCR induces internalization of the receptor-antigen complex and trafficking through the endocytic system, "monovalent inorganic cation transport" could reflect the acidification of vesicles as they progress from endosomes to lysosomes during endocytosis. This AIG-specific cluster also contained an overrepresentation of genes involved in general "transporter activity" (GO:0005215), which includes genes like Rab9, sorting nexin 5 (Snx5) and N-ethylmaleimide sensitive fusion protein attachment protein alpha (Napa) that are involved in endosome trafficking and vesicle fusion. These observations led us to consider the hypothesis that AIG might induce the expression of various components of the endocytic and vesicle transport pathways in a manner that is independent of its effects on the general metabolic activation and proliferation of B cells, and that this might be part of a B cell-specific antigen processing and presentation function.
Table 3.
Genes annotated with transport-related GO terms from Gene Cluster #18
| GO ID | Probe ID | Gene Name |
| GO:0015672 | C530010I21 | ATPase, H+ transporting, V0 subunit B |
| GO:0015672 | 2310069H14 | ATPase, H+ transporting, V1 subunit G isoform 1 |
| GO:0015672 | 5730403E06 | SIMILAR TO ATPASE, H+ TRANSPORTING, LYSOSOMAL |
| GO:0006811 | 2810002O05 | sideroflexin 1 |
| GO:0006811 | 1810048H22 | arsA (bacterial) arsenite transporter, ATP-binding, homolog 1 |
| GO:0006811 | 2310021D14 | chloride channel 7 |
| GO:0005215 | 1810011E08 | MICROSOMAL SIGNAL PEPTIDASE 23 KDA SUBUNIT (EC 3.4.-.-) |
| GO:0005215 | 2810433C04 | translocase of inner mitochondrial membrane 9 homolog (yeast) |
| GO:0005215 | 1500039N14 | N-ethylmaleimide sensitive fusion protein attachment protein alpha |
| GO:0005215 | 2210039G11 | fatty acid binding protein 5, epidermal |
| GO:0005215 | 5430437K12 | zinc finger protein 295 |
| GO:0005215 | 1810057M21 | thioredoxin reductase 1 |
| GO:0005215 | 2310004L13 | translocase of inner mitochondrial membrane 9 homolog (yeast) |
| GO:0005215 | 2610025H03 | fatty acid binding protein 5, epidermal |
| GO:0005215 | 5430413F24 | RAB9, member RAS oncogene family |
| GO:0005215 | 5830417J06 | 24-dehydrocholesterol reductase |
| GO:0005215 | 0910001N05 | sorting nexin 5 |
| GO:0005215 | 2410046L22 | FK506 binding protein 1a |
| GO:0005215 | 2010015D08 | vacuolar protein sorting 29 (S. pombe) |
| GO:0005215 | 3010014K12 | N-ethylmaleimide sensitive fusion protein attachment protein alpha |
List of characterized genes detected using specific cDNA probes (Probe ID) found in Gene Cluster #18 that are associated with GO terms "monovalent inorganic ion transport" (GO:0015672), "ion transport" (GO:0006811), and "transporter activity" (GO:0005215). N.B. GO:0015672 is a child of GO:0006811, which is a child of GO:0005215 in the GO hierarchy.
To ensure that the genes identified through the CLASSIFI analysis were meaningful, we first sought to verify their differential expression patterns. The microarray expression pattern of nine probes recognizing "transporter activity" genes in unstimulated and ligand-stimulated samples were evaluated (Figure 2A). In every case, expression of these genes was similar in all treatment conditions at 0.5 and 1 hr, but was higher in the AIG-treated samples at 2 hr and 4 hr. Examples in which the same gene is represented by two different probes show closely similar expression patterns, indicating the high quality of this microarray data set. To verify the ligand-specificity of expression, RT-PCR was used to examine the expression of a subset of these genes in independently-generated samples. Again, AIG induced enhanced expression of each of these genes compared to LPS and anti-CD40 (Figure 2B). RT-PCR results consistently confirm microarray expression data in this data set [8].
Figure 2.

Expression data from select intracellular transport-related genes. (A) Microarray results for expression patterns of several genes over a timecourse of 0.5 to 4 hr. The log2(Cy5/Cy3) values were compared to 0 hr untreated samples (t = 0). Three examples of genes represented by two different probes (probe Ids in parentheses) are shown in the two right columns. (B) Real-time RT-PCR analysis of four intracellular transport-related genes at 4 hours of stimulation that were included in the microarray data set. Data were normalized to mouse 18S rRNA as a reference and compared to untreated samples. ATP6v0bc" and ATP6v1c1, n = 2. Sorting nexin V and Vacuolar protein 29S, n = 1. (C) Real-time RT-PCR analysis of 4 intracellular transport-related genes at 4 hours of stimulation that were not included in the microarray data set.
CLASSIFI analysis is based on the postulate that genes involved in the same biological process are coordinately expressed. Thus, one prediction of this analysis is that other genes involved in the same biological process that were not included in the microarray probe data set would show the same expression pattern. We evaluated 4 such genes that encode ATPase H+ pump complex subunits by RT-PCR. All of these genes demonstrated a preferential upregulation in response to AIG (Figure 2C). These data not only provide experimental validation of the CLASSIFI approach to microarray data analysis, but also further supports the hypothesis that AIG induces vesicle processing and transport as a biological process.
In order to further test predictions that follow from the CLASSIFI analysis we sought to determine if the process of endocytosis is activated in a ligand/receptor-specific manner. An internalization assay was performed in which the BCR is fluorescently labeled with a non-stimulating anti-IgM-FITC antibody prior to AIG treatment. After allowing time for internalization, the cells are subjected to an acid wash to remove surface-bound label. Label that has been internalized is protected from the acid wash and can therefore be detected using flow cytometry. Using this method, we found that BCR internalization (arrow, Figure 3D) occurs with AIG stimulation, but not CD40L or LPS stimulation in WEHI-231 cells (Figure 3A, G). Substantial internalization was found as early as 15 minutes post-stimulation and continued past 4 hours. Using fluorescence microscopy, internalized BCR can be seen in AIG-treated cells by 10 minutes. No internalization of the BCR is detected with anti-CD40 or LPS treatment (Figure 3J). Ligand-specific internalization of the BCR was also detected in primary B cells (data not shown).
Figure 3.
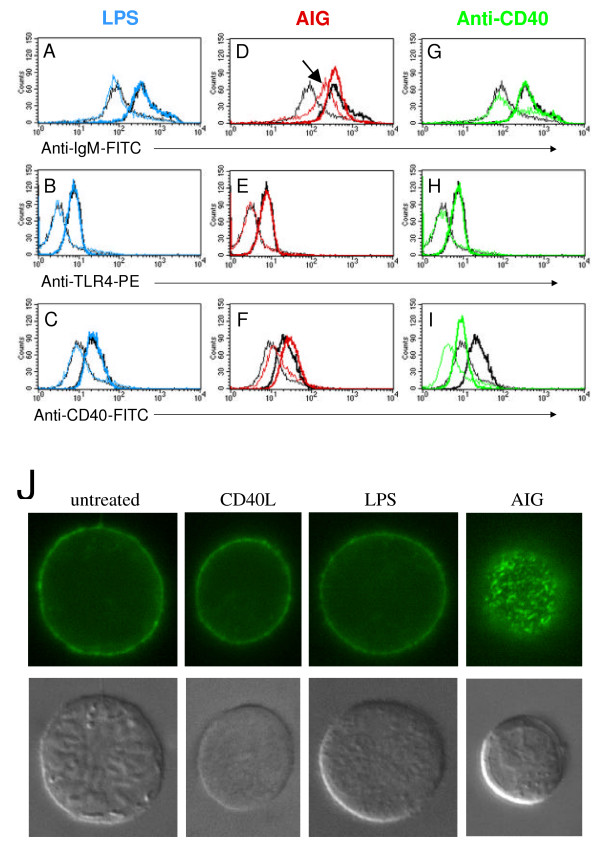
Internalization of cell surface receptors in WEHI-231. (A-I) Assay for internalization of BCR, CD40, and TLR4 was performed using WEHI-231 cells. Data from 1 hr stimulations are shown. Line thickness represents treatment of cells following labeling of receptor where thin = acid treated samples and thick = no acid treatment. Black = unstimulated, blue = LPS stimulated, red = AIG stimulated, green = anti-CD40 stimulated. Arrow denotes histogram of acid-treated cells in which labeled BCR is protected from the effects of acid treatment with AIG stimulation. (J) Localization of the BCR by fluorescence microscopy. BCR are labeled with a non-stimulating FITC-conjugated monoclonal anti-IgM antibody (green) and treated for 10 minutes as indicated. DIC images are shown in bottom row.
To test whether receptor internalization following AIG stimulation is specific to the BCR and not other cell surface receptors, we performed internalization assays in which TLR4 (Toll-Like Receptor 4 – the LPS receptor) or CD40 was labeled prior to AIG treatment. In both cases, no internalization of the labeled receptor was detected (Figure 3E, F), demonstrating that AIG induces specific internalization of the BCR. (The slight shift in CD40 staining probably results from the upregulation of CD40 in response to AIG treatment.) Finally, to test whether stimulation of TLR4 with LPS or CD40 with anti-CD40 induces TLR4 or CD40 internalization, we fluorescently labeled TLR4 or CD40, then treated cells with the corresponding ligands. In the case of TLR4 stimulation with LPS, no internalization is detected (Figure 3B). Anti-CD40 stimulation induces a rapid receptor shedding phenomenon [17] and so it is difficult to directly compare the results of these samples with the other treatment conditions. However, no evidence for internalization was found (Figure 3I). Thus, AIG induces a ligand-specific, receptor-specific endocytic process that is likely designed to capture specific antigen for processing and presentation.
Finally, MHC class II expression would be expected to be high in B cells undergoing antigen processing and presentation. We found that following overnight stimulation with anti-IgM, CD40L, and LPS, Class II expression on anti-IgM treated cells is sustained, while in CD40L and LPS treated cells Class II expression is significantly downregulated (Figure 4). This ligand-specificity for maintenance of Class II on the surface of anti-IgM-treated cells is interesting because it suggests that B cells constitutively express a high level of Class II on the cell surface in anticipation of antigen presentation, which is then down-regulated in stimulated cells unless they are stimulated through the BCR. This idea that B cells are primed to undergo antigen processing and presentation supports observations in the literature that antigen processing and presentation is accelerated with BCR stimulation. Further, our preliminary data indicate that B cells show enhanced stimulation of antigen-specific T cell clones in response to BCR stimulation (data not shown).
Figure 4.
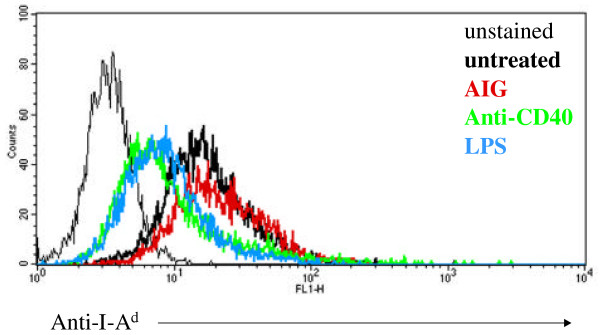
Class II MHC expression in AIG, anti-CD40, and LPS stimulated WEHI-231. Flow cytometric analysis of Class II I-Ad expression in WEHI-231 in response to overnight stimulation with AIG (red), anti-CD40 (green), and LPS (blue) or media alone (thick black line). Thin black line represents the unstained control.
Discussion
CLASSIFI analysis
In this paper we report the analysis of gene expression responses of B lymphocytes to a panel of extracellular ligands using CLASSIFI, a statistical approach that uses GO annotation to identify significant co-clustering of related genes, thus linking biological function with gene expression patterns derived from microarray experiments. CLASSIFI circumvents two traditional limitations associated with microarray expression analysis – the effects of experimental and biological noise, and the variable depth of knowledge of individual genes in the probe set. A well-characterized gene has relatively precise annotations that reach deep into the GO hierarchy, while a poorly-characterized gene is only annotated with high level terms. By capturing the entire ontology parentage of each gene, CLASSIFI overcomes limitations associated with variable depth-of-knowledge associated with most gene sets. In addition, the probability calculation used in CLASSIFI is relatively robust to the addition of experimental noise, allowing the use of less stringent data filtering approaches, which reduces the false negative discovery rate without the usual associated increase in false positives. Indeed, increasing the SAM FDR followed by CLASSIFI analysis increase the number of endocytosis-related genes while maintaining similar gene cluster classifications (data not shown).
Our analysis focused on the AIG-specific Gene Cluster #18, which was statistically classified as an intracellular transport-related gene cluster. Inspection of the entire gene list leads to the hypothesis that Gene Cluster #18 classification reflects the broader biological process of BCR-mediated endocytosis, vesicle acidification and trafficking, and antigen processing and presentation. CLASSIFI should be considered a hypothesis-generating tool that requires experimental validation. Several predictions of our hypothesis were confirmed experimentally, including ligand-specific endocytosis induction and MHC class II expression.
It should be noted that although we have used gene ontology annotation as a means of gene classification, any gene description scheme of interest could be used with the CLASSIFI approach to link experimental variables with legacy knowledge through gene expression microarray data.
Identification of putative components of BCR-mediated antigen capture, processing, and presentation (see Table 4 for reference to this section)
Table 4.
Manual curation of Gene Cluster #18 genes
| Protein description | Gene Sym Symbol | LocusLink ID | Function | Reference | |
| A | CD72 | Cd72 | 12517 | BCR coreceptor | 32–34 35 |
| dual specificity phosphatase 14 | Dusp14 | 56405 | lymphocyte signaling | 36 | |
| mitogen activated protein kinase kinase kinase kinase 1 | Map4k1 | 26411 | lymphocyte signaling | 37–39 | |
| mitogen activated protein kinase kinase 3 | Map2k3 | 26397 | lymphocyte signaling | 40, 41 | |
| serine/threonine kinase receptor associated protein | Strap | 20901 | TGFbeta signaling | 42 | |
| dishevelled associated activator of morphogenesis 1 | Daam1 | 208846 | Wnt signaling | 43 | |
| FK506 binding protein 1a | Fkbp1a | 14225 | BCR signaling/apoptosis | 44–46 | |
| nuclear factor of activated T-cells, cytoplasmic 2 interacting protein | Nfatc2ip | 18020 | BCR signaling/apoptosis | 44–46 | |
| sorting nexin 5 | Snx5 | 69178 | endocytosis | 47, 48 | |
| IQ motif containing GTPase activating protein 1 | Iqgap1 | 29875 | vesicle formation | 49, 50 | |
| amyotrophic lateral sclerosis 2 (juvenile) homolog (human) | Als2 | 74018 | endosome fusion/Rab GEF | 51, 52 | |
| RAB18, RAS family | Rab18 | 19330 | endocytosis/vesicle recycling | 53–56 56 | |
| RAB22, RAS family | Rab22a | 19334 | early endosome trafficking | 56, 57 | |
| Proton pump, subunit V0B (21 kDa) | Atp6v0b | 114143 | vesicle acidification | 58–60 | |
| Proton pump, subunit V1G1 (13 kDa) | Atp6v1g1 | 66290 | vesicle acidification | 58–60 | |
| Proton pump, subunit V1C1 (42 kDa) | Atp6v1c1 | 66335 | vesicle acidification | 58–60 | |
| similar to Proton pump, subunit V1F | 76610 | vesicle acidification | 58–60 | ||
| Proton pump accessory protein 2 | Atp6ap2 | 70495 | vesicle acidification | 61, 62 | |
| Chloride channel 7 | Clcn7 | 26373 | vesicle pH regulation | 63, 64 | |
| dystrobrevin binding protein 1 (dysbindin) | Dtnbp1 | 94245 | lysosome formation | 65 | |
| cystatin B | Cstb | 13014 | cathepsin protease inhibitor | 66–68 | |
| hexosaminidase A | Hexa | 15211 | hydrolase | 69–71 | |
| ceroid lipofuscinosis, neuronal 3, juvenile (Batten, Spielmeyer-Vogt disease) | Cln3 | 12752 | lysosome function | 72 | |
| HSP70 binding protein | Hspbp1 | 66245 | Ag processing/loading | 73 | |
| similar to HSPC135 | 66067 | chaperone (?), GTPase (?) | |||
| HSPC245 homolog | chaperone (?) | ||||
| N-ethylmaleimide sensitive fusion protein attachment protein alpha | Napa | 108124 | vesicle fusion | 74, 75 | |
| RAB9, RAS family | Rab9 | 56382 | vesicle tethering | 76, 77 | |
| activating transcription factor 1 | Atf1 | 11908 | MHC expression | 78 | |
| Sec61 alpha | Sec61a1 | 53421 | ER translocation | 79 | |
| signal sequence receptor, alpha | Ssr1 | 107513 | MHCII chaperone | 80 | |
| calmegin | Clgn | 12745 | MHC chaperone | 81, 82 | |
| similar to signal peptidase SPC22/23 | 76687 | secretory protein processing | 83 | ||
| vacuolar protein sorting 29 | Vps29 | 56433 | retrograde vesicle transport | 84, 85 | |
| reticulon 3 | Rtn3 | 20168 | exocytosis | 86, 87 | |
| tubulin, alpha 6 | Tuba6 | 22146 | cytoskeletal trafficking | 88, 89 | |
| CD63 | Cd63 | 12512 | MHCII coreceptor | 90–92 | |
| source of immunodominant MHC-associated peptides | Simp | 68292 | MHC peptide | 93 | |
| B | 24-dehydrocholesterol reductase | Dhcr24 | 74754 | Cholesterol biosynthesis | 94 |
| fatty acid binding protein 5, epidermal | Fabp5 | 16592 | Fatty acid intracellular transport | 95 | |
| phosphatidylethanolamine binding protein | Pbp | 23980 | Membrane lipid transport | 96 | |
| prostaglandin D2 synthase 2, hematopoietic | Ptgds2 | 54486 | |||
| peroxisome biogenesis factor 1 | Pex1 | 71382 | Peroxisomal protein tranport | 97 | |
| C | beclin 1 (coiled-coil, myosin-like BCL2-interacting protein) | Becn1 | 56208 | Tumor suppression | 98, 99 |
| caspase 4, apoptosis-related cysteine protease | Casp4 | 12363 | Apoptosis | 100–102 | |
| Cd27 binding protein (Hindu God of destruction) | Siva | 30954 | Apoptosis | 103, 104 | |
| D | polymyositis/scleroderma autoantigen 2 | Pmscl2 | 50912 | RNA processing autoantigen | 105 |
| Sjogren's syndrome/scleroderma autoantigen 1 homolog (human) | Sssca1 | 56390 | centromeric autoantigen | 106 | |
| amyotrophic lateral sclerosis 2 (juvenile) homolog (human) | Als2 | 74018 | endosome fusion/Rab GEF | 51, 52 |
Genes found in Gene Cluster #18 with functions related to (A) intracellular trafficking, BCR signaling, vesicle processing and function, and antigen processing and presentation, (C) apoptosis, and (D) B cell-related autoimmune disease. (B) Genes annotated with "transporter" activity whose roles are not yet known to be associated with intracellular trafficking.
Based on the genes responsible for Gene Cluster #18 classification (Table 3), we hypothesized that BCR engagement activates receptor-mediated endocytosis, vesicle acidification, vesicle trafficking, and antigen processing and presentation. We manually curated the AIG-specific cluster gene list and found a total of 38 genes, including those identified using CLASSIFI, that might be involved based on the molecular functions defined in other cell systems and biological processes from the literature (Table 4A). Figure 5 shows a schematic representation of the B cell antigen processing and presentation pathway indicating the putative roles played by these genes.
Figure 5.
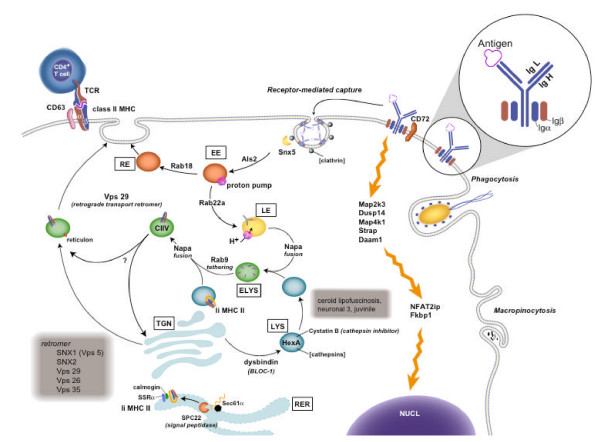
Gene Cluster #18 contains genes involved in several aspects of vesicle processing, intracellular trafficking, and antigen processing and presentation. A manual curation of the gene list comprising Gene Cluster #18 resulted in this detailed model of intracellular transport processes in B cells (refer to text for details). EE = early endosome, LE = late endosome, RE = recycling endosome, ELYS = endolysosome, LYS = lysosome, RER = endoplasmic reticulum, TGN = trans-Golgi network, NUCL = nucleus.
Several genes known to be involved in signal transduction were found in Gene Cluster #18; some have been demonstrated to play a role in BCR signaling while others are involved in signaling pathways in other cell types and are candidates for new BCR signaling components that stimulate the endocytic process (Table 4A). Activation of protein kinases, including members of the MAP kinase family, in response to BCR engagement is well documented; thus Strap, Map4k1 (Hpk1) and Map2k3 may also play a role in BCR signaling. Indeed, Map4k1 is expressed in hematopoietic cells and is required for activation-induced T cell death following TCR stimulation, and Map2k3 is required for IL-12 production by macrophages and dendritic cells, and antigen-mediated activation of T cells. CD72 has been found to regulate the cellular response to BCR signaling either through the recruitment of the SHP-1 phosphatase thereby dampening BCR signaling, or by cooperating with BCR signaling to prevent apoptosis in immature B cells. The Dusp14 dual specificity phosphatase has been found to associate with the CD28 co-receptor and dampen TCR-mediated signaling in T cells by inactivation of MAP kinases, suggesting that it may regulate BCR signaling in a similar fashion. Daam1 is involved in Wnt signaling in Xenopus embryogenesis. Strap binds to the TGF beta type I receptor and inhibits downstream signaling. Whether these proteins might play a role in regulating BCR signaling remains to be determined. The NF-ATc2 isoform has been found to participate in the BCR-induced apoptosis in B-cell-derived Burkitt's lymphoma cell lines, thus the presence of Nfatc2ip and Fkbp1 suggests that these interacting proteins may also be important in regulating Ca++/calmodulin/calcineurin/NFAT signaling in B cells.
A large proportion of genes in Gene Cluster #18 encode proteins with roles in endocytosis, vesicle trafficking, vesicle acidification, molecular processing and protein secretion. In most cases these roles have been defined in other cell systems. Since little is known about the molecular details of these processes in receptor-mediated antigen capture and MHC class II-dependent antigen processing and presentation in B cells, the possibility that Gene Cluster #18 has produced a putative list of proteins that coordinate these activities is intriguing.
Snx5, a member of the sorting nexin family, has been found to interact with clathrin in skeletal muscle. Clathrin has been implicated in facilitating membrane invagination during receptor-mediated endocytosis in B cells. The presence of Snx5 in this cluster suggests that it may help mediate this process. The Als2 protein acts as a guanine nucleotide exchange factor for Rab5 and Rac1, and stimulates early endosome fusion. Rab proteins are small GTPases with homology to Ras that play key roles in vesicle transport: Rab18 has been found to localize near the apical and basolateral plasma membrane in epithelial cells of the kidney and intestine and Rab22a has been found to localize to the plasma membrane and early endosomes. Iqgap1 is a scaffolding protein with multiple protein-protein interaction domains and a GTPase activation protein (Gap) domain that stimulates the hydrolytic activity of Ras family members. Iqgap1 has also been found to localize to areas of membrane ruffling and newly formed vesicles in astrocytoma cells.
Genes encoding homologs to several components of the vesicle-type proton pump were found in Gene Cluster #18, including Atp6v0b, Atp6v1g1, Atp6v1c1, and Atp6v1f and the proton pump accessory protein Atp6ap2. Additional proton pump components were also found to be induced in an AIG-specific manner by RT-PCR (Atp6v0c, Atp6va1, Atp6v1h and Atp6v1a1). Together with the vesicle-specific chloride channel Clcn7, these proteins are likely to play a role in the acidification of the endocytic vesicles in preparation for their fusion with lysosomes to facilitate antigen hydrolysis. Proton pump components can serve as a membrane anchor point for SNARE proteins. Napa appears to mediate the tethering of these vesicles in preparation for fusion. Rab9 also appears to play a role in vesicle fusion since mutations in Rab9 lead to the accumulation of lipid-rich vesicles.
Several proteins involved in lysosome formation and antigen processing were found in Gene Cluster #18. Dysbindin binds to dystobrevins and is a component of the biogenesis of lysosome-related organelles complex 1 in mouse liver, which regulates trafficking to lysosomal organelles. Mutations in the Cln3 gene leads to a lysosomal storage disorder associated with the accumulation of lipopigment-laden vesicles. Hexosaminidase A is a pH-sensitive hydrolase. A variety of cathepsins are involved in MHC Class II antigen processing and presentation. None of the probes for these genes passed our data filtering process, however the cathepsin inhibitor Cystatin B was found in Gene Cluster #18, suggesting that it might play a role in regulating cleavage site selection by modifying the relative activities of proteases involved in antigen processing and peptide loading. Hspbp1 may facilitate antigen processing by regulating the chaperone function of Hsp70, which has been associated with the presentation of myelin basic protein though MHC class II in multiple sclerosis.
Several genes involved in MHC class II expression were found in the AIG-specific gene cluster. Atf1 is a transcription factor that activates the promoter of the class II trans-activator (CIITA). Translocation of nascent MHC class II peptide chains into the lumen of the endoplasmic reticulum involves the function of the Sec61 translocation complex, the signal sequence receptor Ssr1 (a.k.a. TRAP alpha) and the signal peptidase SPC22. Calmegin (Clgn) is a Ca++ binding chaperone protein with significant homology to calreticulin and calnexin, an ER chaperone protein that regulates the assembly of MHC class II with the Ii invariant chain.
Vesicles containing peptide-loaded MHC class II are transported to the plasma membrane for fusion and exposure on the cell surface, perhaps by traveling back through the TGN into the secretory pathway. The Vsp29 protein has been found to facilitate this kind of retrograde TGN transport in yeast. In neurons, reticulon 3 is associated with synaptophysin in tubulovesicular structures and may play a role in the process of vesicle secretion. CD63, an MHC class II co-receptor, may play a role in regulating MHC receptor compartmentalization.
38 genes found in Gene Cluster #18 encode proteins that have some connection with signaling, antigen capture, vesicle transport, vesicle acidification or MHC class II expression, suggesting that activation of B cells through the BCR is inducing the expression of genes involved in MHC class II antigen processing and presentation. The activation of class II presentation by antigen receptor engagement in B cells has been described extensively. The findings reported here are novel in that microarray results combined with CLASSIFI analysis have provided a list of genes that may be involved in this important immunological process.
Finally, it is intriguing to note the presence of genes involved in the regulation of apoptosis and autoimmunity (Table 4C and 4D) in Gene Cluster #18, given the known function of the BCR in negative selection and the induction of autoimmunity.
Transcriptional positive feedback
The changes in mRNA levels for these genes involved in vesicle trafficking might be necessary to stimulate this biological process in AIG-stimulated B cells. However, the kinetics of the mRNA changes compared with the rapid induction of endocytosis suggests that this may not be the case. Elevated mRNA levels for these genes was found at 2 and 4 hr, but not at 0.5 or 1 hr post-stimulation. However, BCR endocytosis was maximally stimulated by 15 minutes. The rapid induction of endocytosis suggests that at least the initiation of this process is activated through post-transcriptional mechanisms. This finding suggests that the AIG-specific transcriptional reprogramming observed in response to BCR stimulation may reflect positive feedback regulation in which expression of proteins that have already been activated is increased either as a means to amplify or sustain the process. Perhaps components of this important biological process are present at low levels in resting cells, and levels increase in response to appropriate environmental cues. This kind of regulatory process might allow cells to respond rapidly to a broad set of variables in their changing environment while conserving energy and materials while in a resting state.
Conclusion
In this paper, we describe a bioinformatics analysis of a B cell microarray dataset using CLASSIFI to determine the biological significance of microarray gene clusters defined by ligand-specific B cell responses. Importantly, results from laboratory experimentation support the hypotheses derived from this microarray data mining exercise. This work is a model for immunologists and other biologists for utilizing the growing field of bioinformatics for microarray data mining, hypothesis generation and hypothesis testing. Furthermore, the results from this analysis provide a foundation for a more detailed understanding of the B cell antigen processing and presentation pathway.
Methods
Primary B cell isolation and culture
Isolation of primary splenic murine B cells was performed as described in the Alliance for Cellular Signaling (AfCS)/Nature Signaling Gateway website [18]. Briefly, splenocytes from 6–10 week old C57BL/6 mice were subjected to a magnetic bead negative selection procedure (Miltenyi Biotech, Auburn, CA) to remove CD43+ and Mac-1+ cells, resulting in an enriched population of resting B cells that was an average of 96% B220+, as determined by flow cytometry [19]. Purified B cells were cultured in supplemented Iscove's Modified Dulbecco's Medium [20] with 100 U/ml penicillin and 100 μg/ml streptomycin (Invitrogen, Carlsbad, CA) at 37°C under 5% CO2. For microarray and internalization experiments, cells were treated for 0.5 hr, 1 hr, 2 hr, and 4 hr with media alone, or with mu chain specific Goat anti-mouse immunoglobulin, (AIG) (Jackson Immunoresearch) at 45 μg/ml, hamster anti-mouse CD40 monoclonal antibody, clone HM40-3 (BD Pharmingen) at 9.73 μg/ml, or lipopolysaccharide (LPS) (Sigma-Aldrich) at 40 μg/ml. For real-time PCR experiments, cells were treated with anti-IgM at 20 μg/ml or anti-CD40 at 625 ng/ml.
Microarray analysis and clustering
Microarray-related experimental protocols can be found at the AfCS/Nature website at [21]; protocol IDs are: PP00000009-RNA extraction, PP00000019-sample preparation and hybridization. Briefly, RNA samples isolated from B cells treated with a panel of 32 ligands were compared with untreated samples using a microarray chip containing 15,494 cDNA probes printed on 15,832 spots representing 10,615 unique MGI gene matches (as of 12/31/03). 38% of the probes have not been assigned a gene name, 96% come from the RIKEN FANTOM collection, 3% from the Minoro Ko National Institute of Aging collection, and the rest from the Research Genetics and Genome Systems collections. RNA samples were used to generate Cy5- and Cy3-labeled cDNA targets (from sample RNAs and RBC-depleted total splenocyte RNA, respectively) and were hybridized together. All samples were run in triplicate except for 1 hr and 4 hr untreated controls, which were run in quadruplicate. Arrays were scanned using the Agilent Scanner G2505A (Agilent Technologies, Palo Alto, CA). Image files were analyzed using the Agilent G2566AA Feature Extraction software version A.6.1.1. The raw data from these experiments is available at [22]. Spot features on each array were filtered to remove those values that were saturated, non-uniform, or below background. Statistical filtering was accomplished using Significance Analysis of Microarrays (SAM) [23]. Features found by SAM to be differentially expressed between samples and time-matched untreated controls at a false discovery rate (FDR) of 1% were included for further analysis. Input for SAM were background-subtracted, dye bias- and interarray variance-normalized Cy5 fluorescence intensity values, which represent expression level of array features. Only features with more than two replicates were used in the SAM analysis. 100 random permutations were done for each comparison of treated to time-matched control samples. Values of +1, -1, or 0 were given to genes that were found by SAM to be significantly upregulated, downregulated, or unchanged (respectively) compared to time-matched untreated controls. These values were used to categorically group genes together based on their expression response patterns.
CLASSIFI analysis
Cluster Assignment for Biological Inference (CLASSIFI) was developed as a method for statistical evaluation of Gene Ontology™ (GO) term co-clustering (Figure 1A). CLASSIFI is predicated on the postulate that genes involved in the same biological process are coordinately expressed; examples of coordinate expression of interacting proteins in eukaryotes has been described [24-27]. Following data transformation, filtering, normalization, standard expression clustering approaches and gene cluster membership assignment, the following steps are performed in the CLASSIFI analysis: 1) remove duplicate probe IDs, 2) extract the primary GO annotations for each gene from a probe database, 3) capture the full GO ancestry for each primary GO annotation from the Gene Ontology™ database, and 4) calculate the solution for the cumulative hypergeometric distribution equation for every GO term in every gene cluster:
where g = number of probes in the data set, c = number of probes in the gene cluster, f = number of probes with a given ontology in the data set, n = number of probes with a given ontology in the gene cluster. The hypergeometric distribution calculates the probability (P) that genes with a particular GO term would co-cluster by chance given the proportion of genes annotated with this GO term in the entire data set. A web interface for use of the CLASSIFI method with data derived from cDNA, oligonucleotide and Affymetrix microarrays, along with detailed information about CLASSIFI input and output files can be found at the CLASSIFI website [28].
Quantitative real-time reverse-transcription-polymerase chain reaction
Total RNA was extracted as for the microarray experiments. 1 μg of total RNA was treated with DNaseI (Invitrogen), then reverse transcribed at 42°C for one hour in a 20 μl volume containing 1 μl MMLV reverse transcriptase (Invitrogen), 4 μl 5X buffer (Invitrogen), 0.5 mM dNTPs (Invitrogen), and 5 ng/μl pd(N)6 (Amersham). Following inactivation at 70°C for 20 min, PCR reactions were set up in a 20 μl volume using Sybr Green Master Maker (Applied Biosystems). Thermal cycling began with a denaturation step of 10 minutes at 95°C, followed by 40 cycles of 95°C for 15 seconds (denaturation) and 60°C for 1 minute (annealing and extension). PCR reactions were performed in the ABI Prism 7700 Sequence Detector (PE Biosystems, Foster City, CA), and data collected and analyzed with the Sequence Detector software (PE Biosystems). Standard curves were generated using RNA isolated from RBC-depleted mouse splenocytes. RT-PCR of mouse 18S rRNA levels was used for normalization. Data from treated samples were compared to untreated samples, giving values representing the fold change in gene expression relative to untreated samples. PCR primers were designed using Primer3 software [29]: ATP6v0Bc" forward (f) 5'gaaccccagcctctttgtaa3', reverse (r) 5'cccatcttcactctggaggt3'; ATP6v1c1 (f) 5'tgcttgccaaagaggtaaca3', (r) 5'tcgctgcatgtagtttctcc3'; sorting nexin V (f) 5'gggagaaggggaaggatcta3', (r) 5'catgggtggacacagtcttc3'; vacuolar protein 29S (f) 5'ctgcagaggcagtttgatgt3', (r) 5'ggcagaacctgggttaatgt3'; ATP6v0c (f) 5'atgtcagtcatgaggccaga3', (r) 5'agcgataagtactgccacca3'; ATP6v0a1 (f) 5'tccacccagtctgtaggtga3'. (r) 5'atcatgatcagggtgcagaa3'; ATP6v1h (f) 5'gatgctgctgtcccaactaa3', (r) 5'agaaatcatctgcccctgaa3'; ATP6v1a1 (f) 5'gaattatgatgcgtccgatg3', (r) 5'cgcctgggatagcagtagtt3'. Mouse 18S PCR primers sequences are from [30]: (f) 5'gtaacccgttgaaccccatt3', (r) 5'ccatccaatcggtagtagcg3'.
Internalization assays and flow cytometry
1 × 10⁶ WEHI-231 cells (a mouse B cell lymphoma line) were pre-stained for 10 min at 4°C with monoclonal antibodies to cell surface receptors: Rat anti-IgM-FITC clone R6-60.2 or clone II/40 (BD Pharmingen), Rat anti-CD40-FITC clone 3/23 (BD Pharmingen), or Rat anti-TLR4/MD2-PE clone MTS510 (eBiosciences). Following 2 washes in PBS/2% FBS/2 mM EDTA, cells were cultured and stimulated using the aforementioned ligand concentrations in RPMI supplemented with 10% FBS (Hyclone), 100 U/ml penicillin, 100 μg/ml streptomycin (Invitrogen, Carlsbad, CA), sodium pyruvate, HEPES, and 2-ME (Invitrogen). Following incubation at 37°C with 5% CO2 for various time periods, cells were harvested and incubated at 4°C for 5 minutes in 0.2 M Acetic acid/0.5 M NaCl to strip off staining antibodies [31], or in PBS/2% FBS/2 mM EDTA (control). Following 2 washes in 0.2 M Acetic acid/0.5 M NaCl or PBS/2% FBS/2 mM EDTA, respectively, samples were fixed in 1% paraformaldehyde. Data were acquired using a FACSCalibur™ flow cytometer and analyzed using CellQuest™ software (Becton Dickinson Immunocytometry Systems).
MHC class II expression was measured by flow cytometric analysis using FITC-conjugated antibody against I-Ad clone 39-10-8 (BD Pharmingen).
BCR localization by immunofluorescence microscopy
1 × 10⁶ WEHI-231 cells were harvested and resuspended in 100 μl PBS containing 2% FBS. 2 μl of rat anti-IgM-FITC clone R6-60.2 antibody was added, and cells incubated on ice for 10 minutes to allow BCR staining. R6-60.2 was determined to be non-stimulating because it did not flux calcium or induce detectable tyrosine phosphorylation in these cells (data not shown). Following one wash in PBS/2%FBS, cells were resuspended in 100 ul phenol-red free growth medium (Invitrogen) and kept on ice prior to stimulation. Cells were stimulated by addition of ligands at the following concentrations: AIG, 20 μg/ml; HM40-3, 9.73 μg/ml; or LPS, 40 μg/ml. Images were captured at room temperature immediately following ligand stimulation for up to 10 min. Using the Zeiss Axioplan 2 upright fluorescence microscope (Carl Zeiss, Inc, Thornwood, NY), images were captured with the 60X objective under oil immersion using the OpenLab™ software, version 4.0.1 (Improvision, Boston, MA). 2 images were captured for each field of view: one for detection of FITC fluorescence, and one for differential interference contrast (DIC) imaging of cells. Images were processed using OpenLab™.
Abbreviations
Ligand abbreviations:
2MA - 2-Methyl-thio-ATP
AIG - Antigen (Anti-Ig)
BAF - BAFF (B-cell activating factor)
BLC - BLC (B-lymphocyte chemoattractant)
BOM - Bombesin
40L - CD40 ligand
CGS - CGS-21680 hydrochloride (2-p-[2-Carboxyethyl]phenethylamino-5'-N-ethylcarboxamidoadenosine)
CPG - CpG-Containing Oligonucleotide
DIM - Dimaprit
ELC - ELC (Epstein Barr Virus-induced molecule-1 Ligand Chemokine)
FML - fMLP (formyl-Met-Leu-Phe)
GRH - Growth hormone-releasing hormone
IGF - Insulin-like growth factor 1
IFB - Interferon-beta
IFG - Interferon-gamma
I10 - Interleukin 10
I04 - Interleukin 4
LPS - Lipopolysaccharide
LB4 - Leukotriene B4 (LTB4)
LPA - Lysophosphatidic acid
M3A - MIP3-alpha (Macrophage inflammatory protein-3)
NEB - Neurokinin B
NPY - Neuropeptide Y
NGF - NGF (Nerve Growth Factor)
PAF - Platelet activating factor
PGE - Prostaglandin E2
SDF - SDF1 alpha (Stromal cell derived factor-1)
SLC - SLC (Secondary lymphoid-organ chemokine)
S1P - Sphingosine-1-phosphate
TER - Terbutaline
TNF - Tumor necrosis factor-alpha
TGF - Transforming growth factor-beta 1
Other Abbreviations:
BCR - B cell receptor
CLASSIFI - Cluster Assignment for Biological Inference
GO - Gene Ontology
SAM - Significance Analysis of Microarrays
TLR4 - Toll-Like Receptor 4
Authors' contributions
JL carried out the microarray clustering, CLASSIFI analysis and experimental validation, and drafted the manuscript. RSS and DM participated in the microarray analysis and CLASSIFI design and implementation. ER and RCH participated in experimental validation. JC and PY participated in implementing the CLASSIFI algorithm as a web-based application. BS and SS participated in the CLASSIFI design and implementation. SC participated in the microarray analysis. RHS conceived of the study and the CLASSIFI algorithm, participated in its design, coordinated the study and helped to draft the manuscript. All authors participated in critical review of the manuscript and give final approval for the submitted manuscript.
Supplementary Material
CLASSIFI input file. The CLASSIFI input file was generated following microarray data clustering. It lists probe IDs, Gene names, and Cluster IDs resulting from categorical clustering of processed data from B cells stimulated with anti-CD40, LPS, and AIG. This input file was uploaded at the CLASSIFI website [28], which provides a web interface for the use of CLASSIFI.
CLASSIFI output file. Complete output file resulting from CLASSIFI analysis of the data set. Clusterid = gene clusters resulting from categorical clustering of processed data from B cells stimulated with anti-CD40, LPS, and AIG. GO id = a unique Gene Ontology identifier that corresponds to a GO term, which is used to describe gene products based on molecular function, biological process, or cellular component. g = number of probes in the data set, f = number of probes with associated GO id in the data set, c = number of probes in the gene cluster, n = number of probes with associated GO id in the gene cluster. Expt = the expected number of occurrences of a given GO id in a given cluster of size (n) based on a random distribution. Prob = the probability that the GO id co-cluster pattern has occurred by chance.
CLASSIFI GO file. Complete list of all GO ids (representing the entire GO ancestry) associated with each probe ID.
Acknowledgments
Acknowledgements
We thank the Alliance for Cellular Signaling (AfCS) for providing materials, methods, and expertise in the development of this work. The following authors are members of the AfCS: RSS, DM, BS, RCH, SC, SS, and RHS.
Contributor Information
Jamie A Lee, Email: Jamie.lee@utsouthwestern.edu.
Robert S Sinkovits, Email: sinkovit@sdsc.edu.
Dennis Mock, Email: dmock@sdsc.edu.
Eva L Rab, Email: eva.rab@utsouthwestern.edu.
Jennifer Cai, Email: Jennifer.cai@utsouthwestern.edu.
Peng Yang, Email: YangPeng@PRAIntl.com.
Brian Saunders, Email: saunders@sdsc.edu.
Robert C Hsueh, Email: Robert.hsueh@utsouthwestern.edu.
Sangdun Choi, Email: schoi@caltech.edu.
Shankar Subramaniam, Email: shankar@sdsc.edu.
Richard H Scheuermann, Email: scheuerm@utsw.swmed.edu.
in collaboration with the Alliance for Cellular Signaling, Email: webmaster@signaling-gateway.org.
References
- Hsueh RC, Scheuermann RH. Tyrosine kinase activation in the decision between growth, differentiation, and death responses initiated from the B cell antigen receptor. Adv Immunol. 2000;75:283–316. doi: 10.1016/s0065-2776(00)75007-3. [DOI] [PubMed] [Google Scholar]
- DeFranco AL. Molecular aspects of B-lymphocyte activation. Annu Rev Cell Biol. 1987;3:143–78. doi: 10.1146/annurev.cb.03.110187.001043. [DOI] [PubMed] [Google Scholar]
- Bryant PW, Lennon-Dumenil AM, Fiebiger E, Lagaudriere-Gesbert C, Ploegh HL. Proteolysis and antigen presentation by MHC class II molecules. Adv Immunol. 2002;80:71–114. doi: 10.1016/S0065-2776(02)80013-X. [DOI] [PMC free article] [PubMed] [Google Scholar]
- Siemasko K, Clark MR. The control and facilitation of MHC class II antigen processing by the BCR. Curr Opin Immunol. 2001;13:32–6. doi: 10.1016/S0952-7915(00)00178-3. [DOI] [PubMed] [Google Scholar]
- Lanzavecchia A, Bove S. Specific B lymphocytes efficiently pick up, process and present antigen to T cells. Behring Inst Mitt. 1985:82–7. [PubMed] [Google Scholar]
- McGovern EM, Moquin AE, Caballero A, Drake JR. The effect of B cell receptor signaling on antigen endocytosis and processing. Immunol Invest. 2004;33:143–56. doi: 10.1081/IMM-120030733. [DOI] [PubMed] [Google Scholar]
- Brown BK, Li C, Cheng PC, Song W. Trafficking of the Igalpha/Igbeta heterodimer with membrane Ig and bound antigen to the major histocompatibility complex class II peptide-loading compartment. J Biol Chem. 1999;274:11439–46. doi: 10.1074/jbc.274.16.11439. [DOI] [PubMed] [Google Scholar]
- Zhu X, Hart R, Chang MS, Kim JW, Lee SY, Cao YA, Mock D, Ke E, Saunders B, Alexander A, et al. Analysis of the major patterns of B cell gene expression changes in response to short-term stimulation with 33 single ligands. J Immunol. 2004;173:7141–9. doi: 10.4049/jimmunol.173.12.7141. [DOI] [PubMed] [Google Scholar]
- Gene Ontology http://www.geneontology.org
- Ashburner M, Ball CA, Blake JA, Botstein D, Butler H, Cherry JM, Davis AP, Dolinski K, Dwight SS, Eppig JT, et al. Gene ontology: tool for the unification of biology. The Gene Ontology Consortium. Nature Genetics. 2000;25:25–9. doi: 10.1038/75556. [DOI] [PMC free article] [PubMed] [Google Scholar]
- Zhong S, Li C, Wong WH. Software for extracting gene annotation and gene ontology information for microarray analysis. Nucleic Acids Res. 2003;31:3483–6. doi: 10.1093/nar/gkg598. [DOI] [PMC free article] [PubMed] [Google Scholar]
- Draghici S, Khatri P, Martins RP, Ostermeier GC, Krawetz SA. Global functional profiling of gene expression. Genomics. 2003;81:98–104. doi: 10.1016/S0888-7543(02)00021-6. [DOI] [PubMed] [Google Scholar]
- Doniger SW, Salomonis N, Dahlquist KD, Vranizan K, Lawlor SC, Conklin BR. MAPPFinder: using Gene Ontology and GenMAPP to create a global gene-expression profile from microarray data. Genome Biol. 2003;4:R7. doi: 10.1186/gb-2003-4-1-r7. [DOI] [PMC free article] [PubMed] [Google Scholar]
- Bonferroni Correction http://mathworld.wolfram.com/BonferroniCorrection.html
- Kehry MR. CD40-mediated signaling in B cells. Balancing cell survival, growth, and death. J Immunol. 1996;156:2345–8. [PubMed] [Google Scholar]
- Ha YJ, Lee JR. Role of TNF receptor-associated factor 3 in the CD40 signaling by production of reactive oxygen species through association with p40phox, a cytosolic subunit of nicotinamide adenine dinucleotide phosphate oxidase. J Immunol. 2004;172:231–9. doi: 10.4049/jimmunol.172.1.231. [DOI] [PubMed] [Google Scholar]
- Contin C, Pitard V, Itai T, Nagata S, Moreau JF, Dechanet-Merville J. Membrane-anchored CD40 is processed by the tumor necrosis factor-alpha-converting enzyme. Implications for CD40 signaling. J Biol Chem. 2003;278:32801–9. doi: 10.1074/jbc.M209993200. Epub 2003 Jun 16. [DOI] [PubMed] [Google Scholar]
- Isolation of Resting B Lymphocytes from One or More Groups of Four Mouse Spleens http://www.signaling-gateway.org/data/cgi-bin/ProtocolFile.cgi?pid=PP00000001
- Hsueh RC, Roach TIA, Lin K-M, O'Connell TD, Han H, Yan Z. Purification and Characterization of Mouse Splenic B Lymphocytes. AfCS Research Reports. 2002.
- AfCS Solution Protocol http://www.signaling-gateway.org/data/cgi-bin/ProtocolFile.cgi?pid=PS00000056
- AfCS Protocols http://www.signaling-gateway.org/data/ProtocolLinks.html
- AfCS Ligand Screen Experiments http://www.signaling-gateway.org/data/cgi-bin/table.cgi?cellabbr=BC
- Tusher VG, Tibshirani R, Chu G. Significance analysis of microarrays applied to the ionizing radiation response. Proc Natl Acad Sci U S A. 2001;98:5116–21. doi: 10.1073/pnas.091062498. Epub 2001 Apr 17. [DOI] [PMC free article] [PubMed] [Google Scholar]
- Eisen MB, Spellman PT, Brown PO, Botstein D. Cluster analysis and display of genome-wide expression patterns. Proc Natl Acad Sci U S A. 1998;95:14863–8. doi: 10.1073/pnas.95.25.14863. [DOI] [PMC free article] [PubMed] [Google Scholar]
- Grigoriev A. A relationship between gene expression and protein interactions on the proteome scale: analysis of the bacteriophage T7 and the yeast Saccharomyces cerevisiae. Nucleic Acids Res. 2001;29:3513–9. doi: 10.1093/nar/29.17.3513. [DOI] [PMC free article] [PubMed] [Google Scholar]
- Ge H, Liu Z, Church GM, Vidal M. Correlation between transcriptome and interactome mapping data from Saccharomyces cerevisiae. Nat Genet. 2001;29:482–6. doi: 10.1038/ng776. [DOI] [PubMed] [Google Scholar]
- P Kemmeren, van Berkum NL, Vilo J, Bijma T, Donders R, Brazma A, Holstege FC. Protein interaction verification and functional annotation by integrated analysis of genome-scale data. Mol Cell. 2002;9:1133–43. doi: 10.1016/S1097-2765(02)00531-2. [DOI] [PubMed] [Google Scholar]
- CLASSIFI http://pathcuric1.swmed.edu/pathdb/CLASSIFI.html
- Primer3 http://frodo.wi.mit.edu/cgi-bin/primer3/primer3_www.cgi
- Schmittgen TD, Zakrajsek BA. Effect of experimental treatment on housekeeping gene expression: validation by real-time, quantitative RT-PCR. J Biochem Biophys Methods. 2000;46:69–81. doi: 10.1016/S0165-022X(00)00129-9. [DOI] [PubMed] [Google Scholar]
- Tebar F, Bohlander SK, Sorkin A. Clathrin assembly lymphoid myeloid leukemia (CALM) protein: localization in endocytic-coated pits, interactions with clathrin, and the impact of overexpression on clathrin-mediated traffic. Mol Biol Cell. 1999;10:2687–702. doi: 10.1091/mbc.10.8.2687. [DOI] [PMC free article] [PubMed] [Google Scholar]
- Wu HJ, Venkataraman C, Estus S, Dong C, Davis RJ, Flavell RA, S Bondada. Positive signaling through CD72 induces mitogen-activated protein kinase activation and synergizes with B cell receptor signals to induce X-linked immunodeficiency B cell proliferation. J Immunol. 2001;167:1263–73. doi: 10.4049/jimmunol.167.3.1263. [DOI] [PubMed] [Google Scholar]
- Hokazono Y, Adachi T, Wabl M, Tada N, Amagasa T, Tsubata T. Inhibitory coreceptors activated by antigens but not by anti-Ig heavy chain antibodies install requirement of costimulation through CD40 for survival and proliferation of B cells. J Immunol. 2003;171:1835–43. doi: 10.4049/jimmunol.171.4.1835. [DOI] [PubMed] [Google Scholar]
- Fujiwara N, Fusaki N, Hozumi N. CD72 stimulation modulates anti-IgM induced apoptotic signaling through the pathway of NF-kappaB, c-Myc and p27(Kip1) Microbiol Immunol. 2004;48:59–66. doi: 10.1111/j.1348-0421.2004.tb03488.x. [DOI] [PubMed] [Google Scholar]
- Adachi T, Flaswinkel H, Yakura H, Reth M, Tsubata T. The B cell surface protein CD72 recruits the tyrosine phosphatase SHP-1 upon tyrosine phosphorylation. J Immunol. 1998;160:4662–5. [PubMed] [Google Scholar]
- Marti F, Krause A, Post NH, Lyddane C, Dupont B, Sadelain M, PD King. Negative-feedback regulation of CD28 costimulation by a novel mitogen-activated protein kinase phosphatase, MKP6. J Immunol. 2001;166:197–206. doi: 10.4049/jimmunol.166.1.197. [DOI] [PubMed] [Google Scholar]
- Schulze-Luehrmann J, Santner-Nanan B, Jha MK, Schimpl A, Avots A, Serfling E. Hematopoietic progenitor kinase 1 supports apoptosis of T lymphocytes. Blood. 2002;100:954–60. doi: 10.1182/blood-2002-01-0089. [DOI] [PubMed] [Google Scholar]
- Hu E, Kim JB, Sarraf P, Spiegelman BM. Inhibition of adipogenesis through MAP kinase-mediated phosphorylation of PPARgamma. Science. 1996;274:2100–3. doi: 10.1126/science.274.5295.2100. [DOI] [PubMed] [Google Scholar]
- Hu MC, Qiu WR, Wang X, Meyer CF, Tan TH. Human HPK1, a novel human hematopoietic progenitor kinase that activates the JNK/SAPK kinase cascade. Genes Dev. 1996;10:2251–64. doi: 10.1101/gad.10.18.2251. [DOI] [PubMed] [Google Scholar]
- Tanaka N, Kamanaka M, Enslen H, Dong C, Wysk M, Davis RJ, Flavell RA. Differential involvement of p38 mitogen-activated protein kinase kinases MKK3 and MKK6 in T-cell apoptosis. EMBO Rep. 2002;3:785–91. doi: 10.1093/embo-reports/kvf153. Epub 2002 Jul 15. [DOI] [PMC free article] [PubMed] [Google Scholar]
- Lu HT, Yang DD, Wysk M, Gatti E, Mellman I, Davis RJ, Flavell RA. Defective IL-12 production in mitogen-activated protein (MAP) kinase kinase 3 (Mkk3)-deficient mice. Embo J. 1999;18:1845–57. doi: 10.1093/emboj/18.7.1845. [DOI] [PMC free article] [PubMed] [Google Scholar]
- Datta PK, Chytil A, Gorska AE, Moses HL. Identification of STRAP, a novel WD domain protein in transforming growth factor-beta signaling. J Biol Chem. 1998;273:34671–4. doi: 10.1074/jbc.273.52.34671. [DOI] [PubMed] [Google Scholar]
- Habas R, Kato Y, He X. Wnt/Frizzled activation of Rho regulates vertebrate gastrulation and requires a novel Formin homology protein Daam1. Cell. 2001;107:843–54. doi: 10.1016/S0092-8674(01)00614-6. [DOI] [PubMed] [Google Scholar]
- Healy JI, Dolmetsch RE, Timmerman LA, Cyster JG, Thomas ML, Crabtree GR, Lewis RS, Goodnow CC. Different nuclear signals are activated by the B cell receptor during positive versus negative signaling. Immunity. 1997;6:419–28. doi: 10.1016/S1074-7613(00)80285-X. [DOI] [PubMed] [Google Scholar]
- Peng SL, Gerth AJ, Ranger AM, Glimcher LH. NFATc1 and NFATc2 together control both T and B cell activation and differentiation. Immunity. 2001;14:13–20. doi: 10.1016/S1074-7613(01)00085-1. [DOI] [PubMed] [Google Scholar]
- Kondo E, Harashima A, Takabatake T, Takahashi H, Matsuo Y, Yoshino T, Orita K, Akagi T. NF-ATc2 induces apoptosis in Burkitt's lymphoma cells through signaling via the B cell antigen receptor. Eur J Immunol. 2003;33:1–11. doi: 10.1002/immu.200390000. [DOI] [PubMed] [Google Scholar]
- Teasdale RD, Loci D, Houghton F, Karlsson L, Gleeson PA. A large family of endosome-localized proteins related to sorting nexin 1. Biochem J. 2001;358:7–16. doi: 10.1042/0264-6021:3580007. [DOI] [PMC free article] [PubMed] [Google Scholar]
- Towler MC, Gleeson PA, Hoshino S, Rahkila P, Manalo V, Ohkoshi N, Ordahl C, Parton RG, Brodsky FM. Clathrin isoform CHC22, a component of neuromuscular and myotendinous junctions, binds sorting nexin 5 and has increased expression during myogenesis and muscle regeneration. Mol Biol Cell. 2004;15:3181–95. doi: 10.1091/mbc.E04-03-0249. Epub 2004 May 7. [DOI] [PMC free article] [PubMed] [Google Scholar]
- Mbele GO, Deloulme JC, Gentil BJ, Delphin C, Ferro M, Garin J, Takahashi M, Baudier J. The zinc- and calcium-binding S100B interacts and co-localizes with IQGAP1 during dynamic rearrangement of cell membranes. J Biol Chem. 2002;277:49998–50007. doi: 10.1074/jbc.M205363200. Epub 2002 Oct 10. [DOI] [PubMed] [Google Scholar]
- Roy M, Li Z, Sacks DB. IQGAP1 binds ERK2 and modulates its activity. J Biol Chem. 2004;279:17329–37. doi: 10.1074/jbc.M308405200. Epub 2004 Feb 17. [DOI] [PubMed] [Google Scholar]
- Topp JD, Gray NW, Gerard RD, Horazdovsky BF. Alsin is a Rab5 and Rac1 guanine nucleotide exchange factor. J Biol Chem. 2004;279:24612–23. doi: 10.1074/jbc.M313504200. Epub 2004 Mar 19. [DOI] [PubMed] [Google Scholar]
- Kunita R, Otomo A, Mizumura H, Suzuki K, Showguchi-Miyata J, Yanagisawa Y, Hadano S, Ikeda JE. Homo-oligomerization of ALS2 through its unique carboxy-terminal regions is essential for the ALS2-associated Rab5 guanine nucleotide exchange activity and its regulatory function on endosome trafficking. J Biol Chem. 2004;7:7. doi: 10.1074/jbc.M406120200. [DOI] [PubMed] [Google Scholar]
- Yu H, Leaf DS, Moore HP. Gene cloning and characterization of a GTP-binding Rab protein from mouse pituitary AtT-20 cells. Gene. 1993;132:273–8. doi: 10.1016/0378-1119(93)90207-J. [DOI] [PubMed] [Google Scholar]
- Lutcke A, Parton RG, Murphy C, Olkkonen VM, Dupree P, Valencia A, Simons K, Zerial M. Cloning and subcellular localization of novel rab proteins reveals polarized and cell type-specific expression. J Cell Sci. 1994;107:3437–48. doi: 10.1242/jcs.107.12.3437. [DOI] [PubMed] [Google Scholar]
- Schafer U, Seibold S, Schneider A, Neugebauer E. Isolation and characterisation of the human rab18 gene after stimulation of endothelial cells with histamine. FEBS Lett. 2000;466:148–54. doi: 10.1016/S0014-5793(99)01778-0. [DOI] [PubMed] [Google Scholar]
- Segev N. insight into functions through novel interactions. Curr Opin Cell Biol. 2001;13:500–11. doi: 10.1016/S0955-0674(00)00242-8. [DOI] [PubMed] [Google Scholar]
- Seabra MC, Mules EH, Hume AN. Rab GTPases, intracellular traffic and disease. Trends Mol Med. 2002;8:23–30. doi: 10.1016/S1471-4914(01)02227-4. [DOI] [PubMed] [Google Scholar]
- Smith AN, Lovering RC, Futai M, Takeda J, Brown D, Karet FE. Revised nomenclature for mammalian vacuolar-type H+ -ATPase subunit genes. Mol Cell. 2003;12:801–3. doi: 10.1016/S1097-2765(03)00397-6. [DOI] [PubMed] [Google Scholar]
- Sun-Wada GH, Yoshimizu T, Imai-Senga Y, Wada Y, Futai M. Diversity of mouse proton-translocating ATPase: presence of multiple isoforms of the C, d and G subunits. Gene. 2003;302:147–53. doi: 10.1016/S0378-1119(02)01099-5. [DOI] [PubMed] [Google Scholar]
- Nishi T, Forgac M. The vacuolar (H+)-ATPases–nature's most versatile proton pumps. Nat Rev Mol Cell Biol. 2002;3:94–103. doi: 10.1038/nrm729. [DOI] [PubMed] [Google Scholar]
- Demirci FY, White NJ, Rigatti BW, Lewis KF, Gorin MB. Identification, genomic structure, and screening of the vacuolar proton-ATPase membrane sector-associated protein M8-9 gene within the COD1 critical region (Xp11.4) Mol Vis. 2001;7:234–9. [PubMed] [Google Scholar]
- Ludwig J, Kerscher S, Brandt U, Pfeiffer K, Getlawi F, Apps DK, Schagger H. Identification and characterization of a novel 9.2-kDa membrane sector-associated protein of vacuolar proton-ATPase from chromaffin granules. J Biol Chem. 1998;273:10939–47. doi: 10.1074/jbc.273.18.10939. [DOI] [PubMed] [Google Scholar]
- Kornak U, Bosl MR, Kubisch C. Complete genomic structure of the CLCN6 and CLCN7 putative chloride channel genes(1) Biochim Biophys Acta. 1999;1447:100–6. doi: 10.1016/s0167-4781(99)00128-1. [DOI] [PubMed] [Google Scholar]
- Campos-Xavier AB, Saraiva JM, Ribeiro LM, Munnich A, Cormier-Daire V. Chloride channel 7 (CLCN7) gene mutations in intermediate autosomal recessive osteopetrosis. Hum Genet. 2003;112:186–9. doi: 10.1007/s00439-002-0861-9. Epub 2002 Nov 7. [DOI] [PubMed] [Google Scholar]
- Li W, Zhang Q, Oiso N, Novak EK, Gautam R, O'Brien EP, Tinsley CL, Blake DJ, Spritz RA, Copeland NG, et al. Hermansky-Pudlak syndrome type 7 (HPS-7) results from mutant dysbindin, a member of the biogenesis of lysosome-related organelles complex 1 (BLOC-1) Nat Genet. 2003;35:84–9. doi: 10.1038/ng1229. Epub 2003 Aug 17. [DOI] [PMC free article] [PubMed] [Google Scholar]
- Pennacchio LA, Myers RM. Isolation and characterization of the mouse cystatin B gene. Genome Res. 1996;6:1103–9. doi: 10.1101/gr.6.11.1103. [DOI] [PubMed] [Google Scholar]
- Pennacchio LA, Lehesjoki AE, Stone NE, Willour VL, Virtaneva K, Miao J, D'Amato E, Ramirez L, Faham M, Koskiniemi M, et al. Mutations in the gene encoding cystatin B in progressive myoclonus epilepsy (EPM1) Science. 1996;271:1731–4. doi: 10.1126/science.271.5256.1731. [DOI] [PubMed] [Google Scholar]
- Shannon P, Pennacchio LA, Houseweart MK, Minassian BA, Myers RM. Neuropathological changes in a mouse model of progressive myoclonus epilepsy: cystatin B deficiency and Unverricht-Lundborg disease. J Neuropathol Exp Neurol. 2002;61:1085–91. doi: 10.1093/jnen/61.12.1085. [DOI] [PubMed] [Google Scholar]
- Beccari T, Datti A, Orlacchio A, Farinelli S, Blasi E, Hoade J, Stirling JL. Calcium ionophore A-23187 inhibits the secretion of beta-hexosaminidase from the GG2EE mouse macrophage cell line. Biochem Int. 1992;27:783–91. [PubMed] [Google Scholar]
- Beccari T, Hoade J, Orlacchio A, Stirling JL. Cloning and sequence analysis of a cDNA encoding the alpha-subunit of mouse beta-N-acetylhexosaminidase and comparison with the human enzyme. Biochem J. 1992;285:593–6. doi: 10.1042/bj2850593. [DOI] [PMC free article] [PubMed] [Google Scholar]
- Lankar D, Vincent-Schneider H, Briken V, Yokozeki T, Raposo G, Bonnerot C. Dynamics of major histocompatibility complex class II compartments during B cell receptor-mediated cell activation. J Exp Med. 2002;195:461–72. doi: 10.1084/jem.20011543. [DOI] [PMC free article] [PubMed] [Google Scholar]
- Ezaki J, Takeda-Ezaki M, Koike M, Ohsawa Y, Taka H, Mineki R, Murayama K, Uchiyama Y, Ueno T, Kominami E. Characterization of Cln3p, the gene product responsible for juvenile neuronal ceroid lipofuscinosis, as a lysosomal integral membrane glycoprotein. J Neurochem. 2003;87:1296–308. doi: 10.1046/j.1471-4159.2003.02132.x. [DOI] [PubMed] [Google Scholar]
- Mycko MP, Cwiklinska H, Szymanski J, Szymanska B, Kudla G, Kilianek L, Odyniec A, Brosnan CF, Selmaj KW. Inducible heat shock protein 70 promotes myelin autoantigen presentation by the HLA class II. J Immunol. 2004;172:202–13. doi: 10.4049/jimmunol.172.1.202. [DOI] [PubMed] [Google Scholar]
- Chae TH, Kim S, Marz KE, Hanson PI, Walsh CA. The hyh mutation uncovers roles for alpha Snap in apical protein localization and control of neural cell fate. Nat Genet. 2004;36:264–70. doi: 10.1038/ng1302. Epub 2004 Feb 1. [DOI] [PubMed] [Google Scholar]
- Lemons PP, Chen D, Bernstein AM, Bennett MK, Whiteheart SW. Regulated secretion in platelets: identification of elements of the platelet exocytosis machinery. Blood. 1997;90:1490–500. [PubMed] [Google Scholar]
- Walter M, Davies JP, Ioannou YA. Telomerase immortalization upregulates Rab9 expression and restores LDL cholesterol egress from Niemann-Pick C1 late endosomes. J Lipid Res. 2003;44:243–53. doi: 10.1194/jlr.M200230-JLR200. Epub 2002 Nov 4. [DOI] [PubMed] [Google Scholar]
- Davies JP, Cotter PD, Ioannou YA. Cloning and mapping of human Rab7 and Rab9 cDNA sequences and identification of a Rab9 pseudogene. Genomics. 1997;41:131–4. doi: 10.1006/geno.1997.4644. [DOI] [PubMed] [Google Scholar]
- van der Stoep N, Quinten E, van den Elsen PJ. Transcriptional regulation of the MHC class II trans-activator (CIITA) promoter III: identification of a novel regulatory region in the 5'-untranslated region and an important role for cAMP-responsive element binding protein 1 and activating transcription factor-1 in CIITA-promoter III transcriptional activation in B lymphocytes. J Immunol. 2002;169:5061–71. doi: 10.4049/jimmunol.169.9.5061. [DOI] [PubMed] [Google Scholar]
- Romisch K. Surfing the Sec61 channel: bidirectional protein translocation across the ER membrane. J Cell Sci. 1999;112:4185–91. doi: 10.1242/jcs.112.23.4185. [DOI] [PubMed] [Google Scholar]
- Hirama T, Miller CW, Koeffler HP. Translocon-associated protein alpha transcripts are induced by granulocyte-macrophage colony-stimulating factor and exhibit complex alternative polyadenylation. FEBS Lett. 1999;455:223–7. doi: 10.1016/S0014-5793(99)00885-6. [DOI] [PubMed] [Google Scholar]
- Yamagata K, Nakanishi T, Ikawa M, Yamaguchi R, Moss SB, Okabe M. Sperm from the calmegin-deficient mouse have normal abilities for binding and fusion to the egg plasma membrane. Dev Biol. 2002;250:348–57. doi: 10.1016/S0012-1606(02)90803-1. [DOI] [PubMed] [Google Scholar]
- Romagnoli P, Germain RN. Inhibition of invariant chain (Ii)-calnexin interaction results in enhanced degradation of Ii but does not prevent the assembly of alpha beta Ii complexes. J Exp Med. 1995;182:2027–36. doi: 10.1084/jem.182.6.2027. [DOI] [PMC free article] [PubMed] [Google Scholar]
- Meyer HA, Hartmann E. The yeast SPC22/23 homolog Spc3p is essential for signal peptidase activity. J Biol Chem. 1997;272:13159–64. doi: 10.1074/jbc.272.20.13159. [DOI] [PubMed] [Google Scholar]
- Edgar AJ, Polak JM. Human homologues of yeast vacuolar protein sorting 29 and 35. Biochem Biophys Res Commun. 2000;277:622–30. doi: 10.1006/bbrc.2000.3727. [DOI] [PubMed] [Google Scholar]
- Murk JL, Humbel BM, Ziese U, Griffith JM, Posthuma G, Slot JW, Koster AJ, Verkleij AJ, Geuze HJ, Kleijmeer MJ. Endosomal compartmentalization in three dimensions: implications for membrane fusion. Proc Natl Acad Sci U S A. 2003;100:13332–7. doi: 10.1073/pnas.2232379100. Epub 2003 Nov 3. [DOI] [PMC free article] [PubMed] [Google Scholar]
- Oertle T, Klinger M, Stuermer CA, Schwab ME. A reticular rhapsody: phylogenic evolution and nomenclature of the RTN/Nogo gene family. Faseb J. 2003;17:1238–47. doi: 10.1096/fj.02-1166hyp. [DOI] [PubMed] [Google Scholar]
- Kumamaru E, Kuo CH, Fujimoto T, Kohama K, Zeng LH, Taira E, Tanaka H, Toyoda T, Miki N. Reticulon3 expression in rat optic and olfactory systems. Neurosci Lett. 2004;356:17–20. doi: 10.1016/j.neulet.2003.11.009. [DOI] [PubMed] [Google Scholar]
- Chu CC, Paul WE. Expressed genes in interleukin-4 treated B cells identified by cDNA representational difference analysis. Mol Immunol. 1998;35:487–502. doi: 10.1016/S0161-5890(98)00031-5. [DOI] [PubMed] [Google Scholar]
- Mootha VK, Bunkenborg J, Olsen JV, Hjerrild M, Wisniewski JR, Stahl E, Bolouri MS, Ray HN, Sihag S, Kamal M, et al. Integrated analysis of protein composition, tissue diversity, and gene regulation in mouse mitochondria. Cell. 2003;115:629–40. doi: 10.1016/S0092-8674(03)00926-7. [DOI] [PubMed] [Google Scholar]
- Duffield A, Kamsteeg EJ, Brown AN, Pagel P, Caplan MJ. The tetraspanin CD63 enhances the internalization of the H, K-ATPase beta-subunit. Proc Natl Acad Sci U S A. 2003;100:15560–5. doi: 10.1073/pnas.2536699100. Epub 2003 Dec 5. [DOI] [PMC free article] [PubMed] [Google Scholar]
- Engering A, Kuhn L, Fluitsma D, Hoefsmit E, Pieters J. Differential post-translational modification of CD63 molecules during maturation of human dendritic cells. Eur J Biochem. 2003;270:2412–20. doi: 10.1046/j.1432-1033.2003.03609.x. [DOI] [PubMed] [Google Scholar]
- Vogt AB, Spindeldreher S, Kropshofer H. Clustering of MHC-peptide complexes prior to their engagement in the immunological synapse: lipid raft and tetraspan microdomains. Immunol Rev. 2002;189:136–51. doi: 10.1034/j.1600-065X.2002.18912.x. [DOI] [PubMed] [Google Scholar]
- McBride K, Baron C, Picard S, Martin S, Boismenu D, Bell A, Bergeron J, Perreault C. The model B6(dom1) minor histocompatibility antigen is encoded by a mouse homolog of the yeast STT3 gene. Immunogenetics. 2002;54:562–9. doi: 10.1007/s00251-002-0502-4. Epub 2002 Oct 2. [DOI] [PubMed] [Google Scholar]
- Waterham HR, Koster J, Romeijn GJ, Hennekam RC, Vreken P, Andersson HC, FitzPatrick DR, Kelley RI, Wanders RJ. Mutations in the 3beta-hydroxysterol Delta24-reductase gene cause desmosterolosis, an autosomal recessive disorder of cholesterol biosynthesis. Am J Hum Genet. 2001;69:685–94. doi: 10.1086/323473. Epub 2001 Aug 22. [DOI] [PMC free article] [PubMed] [Google Scholar]
- Stremmel W, Pohl L, Ring A, Herrmann T. A new concept of cellular uptake and intracellular trafficking of long-chain fatty acids. Lipids. 2001;36:981–9. doi: 10.1007/s11745-001-0809-2. [DOI] [PubMed] [Google Scholar]
- Hemmaplardh D, Morgan RG, Morgan EH. Role of plasma membrane phospholipids in the uptake and release of transferrin and its iron by reticulocytes. J Membr Biol. 1977;33:195–212. doi: 10.1007/BF01869516. [DOI] [PubMed] [Google Scholar]
- Collins CS, Kalish JE, Morrell JC, McCaffery JM, Gould SJ. The peroxisome biogenesis factors pex4p, pex22p, pex1p, and pex6p act in the terminal steps of peroxisomal matrix protein import. Mol Cell Biol. 2000;20:7516–26. doi: 10.1128/MCB.20.20.7516-7526.2000. [DOI] [PMC free article] [PubMed] [Google Scholar]
- Yue Z, Jin S, Yang C, Levine AJ, Heintz N. Beclin 1, an autophagy gene essential for early embryonic development, is a haploinsufficient tumor suppressor. Proc Natl Acad Sci U S A. 2003;100:15077–82. doi: 10.1073/pnas.2436255100. Epub 2003 Dec 1. [DOI] [PMC free article] [PubMed] [Google Scholar]
- Yu L, Alva A, Su H, Dutt P, Freundt E, Welsh S, Baehrecke EH, Lenardo MJ. Regulation of an ATG7-beclin 1 program of autophagic cell death by caspase-8. Science. 2004;304:1500–2. doi: 10.1126/science.1096645. Epub 2004 May 6. [DOI] [PubMed] [Google Scholar]
- Lee CK, Smith E, Gimeno R, Gertner R, Levy DE. STAT1 affects lymphocyte survival and proliferation partially independent of its role downstream of IFN-gamma. J Immunol. 2000;164:1286–92. doi: 10.4049/jimmunol.164.3.1286. [DOI] [PubMed] [Google Scholar]
- Kang SJ, Wang S, Kuida K, Yuan J. Distinct downstream pathways of caspase-11 in regulating apoptosis and cytokine maturation during septic shock response. Cell Death Differ. 2002;9:1115–25. doi: 10.1038/sj.cdd.4401087. [DOI] [PubMed] [Google Scholar]
- Schauvliege R, Vanrobaeys J, Schotte P, Beyaert R. Caspase-11 gene expression in response to lipopolysaccharide and interferon-gamma requires nuclear factor-kappa B and signal transducer and activator of transcription (STAT) 1. J Biol Chem. 2002;277:41624–30. doi: 10.1074/jbc.M207852200. Epub 2002 Aug 26. [DOI] [PubMed] [Google Scholar]
- Prasad KV, Ao Z, Yoon Y, Wu MX, Rizk M, Jacquot S, Schlossman SF. CD27, a member of the tumor necrosis factor receptor family, induces apoptosis and binds to Siva, a proapoptotic protein. Proc Natl Acad Sci U S A. 1997;94:6346–51. doi: 10.1073/pnas.94.12.6346. [DOI] [PMC free article] [PubMed] [Google Scholar]
- Fortin A, MacLaurin JG, Arbour N, Cregan SP, Kushwaha N, Callaghan SM, Park DS, Albert PR, Slack RS. The proapoptotic gene SIVA is a direct transcriptional target for the tumor suppressors p53 and E2F1. J Biol Chem. 2004;279:28706–14. doi: 10.1074/jbc.M400376200. Epub 2004 Apr 22. [DOI] [PubMed] [Google Scholar]
- Bliskovski V, Liddell R, Ramsay ES, Miller MJ, Mock BA. Structure and localization of mouse Pmscl1 and Pmscl2 genes. Genomics. 2000;64:106–10. doi: 10.1006/geno.2000.6118. [DOI] [PubMed] [Google Scholar]
- Muro Y, Yamada T, Himeno M, Sugimoto K. cDNA cloning of a novel autoantigen targeted by a minor subset of anti-centromere antibodies. Clin Exp Immunol. 1998;111:372–6. doi: 10.1046/j.1365-2249.1998.00517.x. [DOI] [PMC free article] [PubMed] [Google Scholar]
Associated Data
This section collects any data citations, data availability statements, or supplementary materials included in this article.
Supplementary Materials
CLASSIFI input file. The CLASSIFI input file was generated following microarray data clustering. It lists probe IDs, Gene names, and Cluster IDs resulting from categorical clustering of processed data from B cells stimulated with anti-CD40, LPS, and AIG. This input file was uploaded at the CLASSIFI website [28], which provides a web interface for the use of CLASSIFI.
CLASSIFI output file. Complete output file resulting from CLASSIFI analysis of the data set. Clusterid = gene clusters resulting from categorical clustering of processed data from B cells stimulated with anti-CD40, LPS, and AIG. GO id = a unique Gene Ontology identifier that corresponds to a GO term, which is used to describe gene products based on molecular function, biological process, or cellular component. g = number of probes in the data set, f = number of probes with associated GO id in the data set, c = number of probes in the gene cluster, n = number of probes with associated GO id in the gene cluster. Expt = the expected number of occurrences of a given GO id in a given cluster of size (n) based on a random distribution. Prob = the probability that the GO id co-cluster pattern has occurred by chance.
CLASSIFI GO file. Complete list of all GO ids (representing the entire GO ancestry) associated with each probe ID.