

Abstract
Genomic comparisons provide evidence for ancient genome-wide duplications in a diverse array of animals and plants. We developed a birth–death model to identify evidence for genome duplication in EST data, and applied a mixture model to estimate the age distribution of paralogous pairs identified in EST sets for species representing the basal-most extant flowering plant lineages. We found evidence for episodes of ancient genome-wide duplications in the basal angiosperm lineages including Nuphar advena (yellow water lily: Nymphaeaceae) and the magnoliids Persea americana (avocado: Lauraceae), Liriodendron tulipifera (tulip poplar: Magnoliaceae), and Saruma henryi (Aristolochiaceae). In addition, we detected independent genome duplications in the basal eudicot Eschscholzia californica (California poppy: Papaveraceae) and the basal monocot Acorus americanus (Acoraceae), both of which were distinct from duplications documented for ancestral grass (Poaceae) and core eudicot lineages. Among gymnosperms, we found equivocal evidence for ancient polyploidy in Welwitschia mirabilis (Gnetales) and no evidence for polyploidy in pine, although gymnosperms generally have much larger genomes than the angiosperms investigated. Cross-species sequence divergence estimates suggest that synonymous substitution rates in the basal angiosperms are less than half those previously reported for core eudicots and members of Poaceae. These lower substitution rates permit inference of older duplication events. We hypothesize that evidence of an ancient duplication observed in the Nuphar data may represent a genome duplication in the common ancestor of all or most extant angiosperms, except Amborella.
Gene duplication has long been recognized to be a major force in evolution (Ohno 1970). Genome doubling (polyploidy) has had a profound influence on the evolutionary history of extant lineages. Ohno proposed that whole-genome duplications occurred in the early history of all vertebrates (Ohno 1970). While the hypothesis of whole-genome duplication in the earliest vertebrates has been somewhat controversial (Hughes 1999; Friedman and Hughes 2001; Makalowski 2001; Hughes and Friedman 2003), ancient polyploidy is supported by genetic and genomic investigations of individual gene families as well as large syntenic chromosomal segments (Abi-Rached et al. 2002; Gu et al. 2002; McLysaght et al. 2002; Dehal and Boore 2005). The importance of genome duplication in the evolution of amphibians (Bogart 1979) and the yeast Saccharomyces cerevisiae has been more widely accepted (Wolfe and Shields 1997; Friedman and Hughes 2001; Kellis et al. 2004).
Polyploidy is common in many plant lineages, particularly angiosperms (Stebbins 1950; Grant 1981; Soltis and Soltis 1999). The angiosperms in particular have been the subject of considerable speculation regarding the frequency of polyploidy. Classic studies estimated that 30%–50% of angiosperms are polyploids (Müntzing 1936; Darlington 1937; Stebbins 1950), and more recently most if not all extant angiosperms have been implicated as ancient polyploids (Grant 1963; Masterson 1994; Otto and Whitton 2000). Some of these inferences were based on comparisons of nuclear DNA content (C-value) or sequenced genome size, across a broad spectrum of species. However, the rapid reduction of duplicate genes immediately after polyploidization can drastically shrink genome size and gene content (Ohno 1970; deWet 1979; Liu and Wendel 2003). Despite the small size of the Arabidopsis thaliana genome (157 Mb) (Bennett et al. 2003), recent investigations have revealed two or more rounds of ancient genome duplications (Vision et al. 2000; Simillion et al. 2002; Bowers et al. 2003). Analysis of the rice genome also suggested ancient polyploidy in the early history of the grass family (Poaceae) (Paterson et al. 2004b; Yu et al. 2005). It now appears that perhaps all major lineages of eukaryotic genomes possess considerable numbers of duplicate genes that may have resulted from genome duplications (Ohno 1970; Lynch and Conery 2000).
Whole-genome duplication, tandem gene duplication, and segmental duplication all generate paralogous gene pairs. For species with complete genome sequences, such as Arabidopsis, rice, and now Populus, it is possible to differentiate whole-genome duplications from segmental and tandem duplications by mapping chromosomal locations of duplicate genes or blocks of genes (Simillion et al. 2002; Blanc et al. 2003; Bowers et al. 2003; Cannon et al. 2004; Paterson et al. 2004b). Lynch and Conery (2000) proposed a genomic-scale approach to estimate the age of gene duplication events and the fate of resulting paralogous gene pairs by evaluating the frequency distribution of per-site synonymous divergence levels (Ks) for pairs of duplicate genes. After gene duplication, some paralogs will be silenced and eventually be eliminated, while many of the preserved paralogs may be subject to changes in DNA sequence or gene expression, leading to sub- or neofunctionalization (Force et al. 1999; Adams et al. 2003; Wang et al. 2004b).
Synonymous substitutions are largely immune to the strong selective pressures that greatly impact the rate of protein divergence (Li and Grauer 1991; Lynch and Conery 2000), and when corrected for multiple substitutions that occur in highly diverged sequences, these nearly neutral substitutions in protein-coding regions can be used as a proxy for the amount of time that has passed since gene duplication. A genome-wide duplication event simultaneously creates thousands of paralogous pairs. Evidence of past genome duplications can be seen as peaks in the distribution of Ks values for sampled paralogous pairs (Lynch and Conery 2000; Blanc and Wolfe 2004; Schlueter et al. 2004). This method does not depend on genomic positional information, and can be applied to any species for which there are moderately large EST sets. Identification of duplicated blocks of genes in genome sequences, however, provides much stronger evidence of ancient polyploidy, although average Ks values (or Ka) (Vision et al. 2000) can still be used to date the origin of duplicated blocks. Using the large number of DNA sequences generated by EST and genome sequencing projects, Blanc and Wolfe (2004) investigated 14 model plant species (mostly crop species with known recent polyploid history) and found spikes in the distributions of older paralogous pairs (with higher Ks values) in nine species. Schlueter et al. (2004) advanced the analysis of Ks distributions by applying a finite mixture model (McLachlan et al. 1999) to sets of paralogous pairs identified in large EST databases for eight major crop species, including soybean, Medicago, tomato, potato, maize, Sorghum, rice, and barley, and inferred multiple independent genome duplications in Fabaceae, Solanaceae, and Poaceae over the last 14–60 million years. In general, this method is only suitable for duplicated genes with similar codon usage, because Ks is affected by codon usage bias (Bierne and Eyre-Walker 2003; Wang et al. 2004a).
All of the plants previously investigated using Ks distributions (Blanc and Wolfe 2004; Schlueter et al. 2004) belong to either derived monocot (a single family, the Poaceae) or eudicot lineages. Most species examined were either crop species or close relatives, where a predisposition to polyploidy might have increased the chances of having traits important for domestication and agriculture (but see Hilu 1993). Until recently, there has been very little sequence data available for phylogenetically pivotal taxa representing the basal lineages of the eudicots, monocots, or all angiosperms, and the genome histories of these lineages are therefore poorly understood. Here and throughout this paper we use the term “basal” when referring to a lineage that is sister to a larger clade containing all other members of a particular group. An understanding of ancient genome duplication in the basal-most angiosperm lineages is especially important in understanding the role of polyploidy in the origin and early diversification of flowering plants (e.g., Buzgo et al. 2005; De Bodt et al. 2005; Zahn et al. 2005a, b). We use sets of 9000–10,000 ESTs generated for species representing basal angiosperms and basal eudicot lineages (Albert et al. 2005) to assess the frequency of ancient genome duplications across all major extant angiosperm lineages (Table 1) and to evaluate whether these data can elucidate the timing of ancient genome duplication events in early angiosperm history.
Table 1.
Genome sizes and base chromosome numbers for the angiosperm and gymnosperm species in this study

The relationships among the organisms and the major lineages are indicated in Figure 6. The sources for genome size data are the Royal Botanic Gardens, Kew Plant C-value database (RBG, Kew; http://www.rbgkew.org.uk/cval/homepage.html) and this study—the DNA content determined by flow cytometry as described in Wang et al. (2005).
To facilitate the interpretation of Ks distributions, we have modeled the gene birth-and-death process both with and without genome-wide duplication events. Our model provides a predicted age distribution for any sample of duplicate genes while accounting for empirical estimation errors in Ks. The model was used to generate predicted Ks distributions for sets of paralogous pairs under the null hypothesis that the given gene births and deaths occurred at constant rates. Null distributions were modeled using parameter values and error corrections estimated for each data set (see Methods). When the null hypothesis of a constant birth-and-death process was rejected, the log-transformed Ks distribution for each taxon was analyzed using a mixture model to identify subpopulations of paralogous pairs generated through one or more large-scale duplication events (McLachlan et al. 1999; Schlueter et al. 2004). Our results provide evidence of ancient polyploidy throughout the major angiosperm lineages, and support the possibility that a genome-scale duplication event occurred prior to the rapid diversification of flowering plants (Darwin 1903).
Results
Model parameters and their influence on the observed age distribution of paralogs
To add statistical rigor to the interpretation of Ks distributions for paralogous pairs, we modeled the expected age and Ks distributions under a constant-rate birth–death model (see Methods). Whereas recent studies have shown that evidence of paleopolyploidy is often (but not always) discernible in Ks plots for paralogous pairs (Blanc and Wolfe 2004; Schlueter et al. 2004; Maere et al. 2005), the accumulation of single gene duplications, variation in the rates of gene death, and error in Ks estimates have not been studied quantitatively. We model the rate of gene death, the time since gene (or genome) duplication, and the error in Ks estimates in analyses of paralogous pairs. Our null model assumes gene birth and death are independent events, each with a constant rate over time. Under this model, the expected age distribution for paralogous pairs is a declining exponential with a decay parameter corresponding to the rate of gene death. Ks distributions derived from simulations under this model are influenced by the random nature of nucleotide substitution and the error in Ks estimation. To formally test for deviation from a constant-rates’ model using empirical data, we generate a null distribution for the frequency of Ks values using parameters estimated from the data for the rate of gene death and the error in Ks estimation.
Our model was also used to simulate Ks distributions for paralogous pairs arising from a mixture of single gene duplications and ancient polyploidy events. Empirical estimates of variation in Ks were based on analyses of A. thaliana paralogous pairs. Figure 1 shows Ks distributions for data simulated with different rates of gene death and different times since a genome duplication event. These Ks distributions contain two components; the first one is always a declining exponential distribution corresponding to “background” single gene duplications, and the second component represents paralogous pairs arising from a polyploidy event. Very recent genome duplications may be obscured by background gene duplications because the modal Ks values do not appear as distinct peaks. Conversely, increases in the number of gene deaths and variance in Ks with time render older genome duplications less detectable than younger events, with no significant duplication signal recovered for events with an expected Ks of 1.5 (Fig. 1C,F,I). High gene death rates also eroded the impact of genome duplications on Ks distributions (Fig. 1G,H,I). These results corroborate previous evidence that ancient genome duplication events are not always detectable in analyses of Ks distributions (Blanc and Wolfe 2004; Paterson et al. 2004a).
Figure 1.

Effect of gene death rate and time of genome duplication on the Ks distribution for paralogs. A single genome duplication was simulated, where time since duplication (corresponding to Ks = 0.5 in A,D, and G; 1.0 in B,E, and H; or 1.5 in C,F, and I) is indicated by a star. The death rate of duplicate pairs (δ) increases from the top row to the bottom row (δ = 0.67 for A,B,C, as estimated from Arabidopsis data; 1.34 for D,E,F; and 2.68 for G,H,I). In each graph, the observed frequency of paralogs from background gene duplication is plotted with a dashed line, while the distribution deriving from genome duplication is plotted with a dotted line. The Ks distribution of all paralogs is drawn with a solid line.
Evidence of genome duplications in diverse lineages of flowering plants
Model validation: Duplications detected in eudicots
EST sets from A. thaliana, Glycine max (soybean), and Solanum lycopersicum (tomato) were used to validate our test of the constant-birth–death-rate model. The genome duplication histories for these species have been elucidated in several previous analyses (Shoemaker et al. 1996; Blanc et al. 2000; Grant et al. 2000; Ku et al. 2000; Vision et al. 2000; Bowers et al. 2003). To make these analyses comparable to analyses of the other EST sets in this study, we randomly sampled sets of 6000 unigenes, or ∼10,000 ESTs, from a much larger set of available ESTs for each of these taxa (see Methods).
To determine whether inference of genome-wide duplication events depends on the method of synonymous substitution estimation, we compared four methods of Ks estimation, including the original Nei-Gojobori (NG) method (Nei and Gojobori 1986), the modified Nei-Gojobori (modified NG) method (Zhang et al. 1998), the Goldman and Yang maximum likelihood (ML) method (Goldman and Yang 1994), and the YN00 (YN) method (Yang and Nielsen 2000). Results were similar across all Ks estimation procedures in analyses of the Arabidopsis data set (Fig. 2A). Analyses of replicate subsamples from the random Arabidopsis unigenes gave very similar results to analyses of all paralogous pairs (Fig. 2B; Lynch and Conery 2000; Blanc et al. 2003; Maere et al. 2005), suggesting that 6000 unigenes are sufficient for estimating Ks distributions for the other species in this study (Table 2).
Figure 2.

Ks distribution from a sample of Arabidopsis unigenes and the diagnostic test according to the constant birth–death model (null model). (A) Ks estimates from four methods show strong agreement. (ML) Maximum likelihood method by Goldman and Yang; (NG) Nei-Gojobori method; (mNG) modified Nei-Gojobori method; (YN) Yang and Nielsen method. These sample sizes are comparable to the unigenes available for the species sequenced in this study. (B) Ks distributions for paralogs from four replicate unigene samples of 6000 sequences each. (C) The density plot of observed Ks distribution and simulated data based on the null model with parameter δ = 0.67. (D) The Q-Q plot of observed versus expected Ks values shows the poor fit of the null hypothesis that gene birth and death rates are constant (P ≪ 0.0001).
Table 2.
Summary of EST data sets and paralogous pairs identified in this study
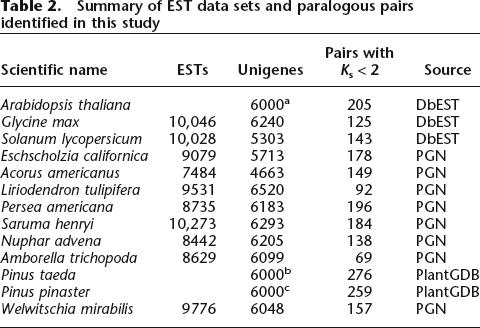
aSampled from 6369 unigenes.
bSampled from 52,527 unigenes.
cSampled from 8076 unigenes.
We estimated the rate parameter for Arabidopsis data (δ = 0.67) assuming a constant-birth–death model (the null model) and tested the expected distribution against the observed distribution using a χ2 test (Fig. 2C). The null model was rejected (P ≪ 0.0001), and the quantile–quantile plot showed obvious deviation from the expected distribution of Ks values (bootstrapped Kolmogorov-Smirnov test, P ≪ 0.0001) (Fig. 2D). Next, we applied the mixture model to estimate the median age (in Ks equivalent units) of duplicate genes from recent or older duplication events (Table 3). This analysis, using ML distances, identified two significant components, a background component with median Ks = 0.2889, and a prominent second component including 79% of the paralogous pairs with a median Ks = 0.7510 that corresponded to the polyploidy peak detected by Blanc and Wolfe (2004). Similar results were obtained when the YN, NG, and modified NG Ks estimates were used, thus only ML distance estimates are reported for all other analyses since they are typically less biased and have lower error rates, especially for more divergent sequences (Yang and Nielsen 2000). We obtained similar results to those reported in previous studies (Blanc and Wolfe 2004; Schlueter et al. 2004), with much smaller subsamples of ESTs (Fig. 2B).
Table 3.
Mixture model estimates for Ks distributions in each species

Initial tests against the null model (no genome duplication) were conducted, then a mixture analysis was applied to each species. The final mixture model was selected according to the Bayesian Information Criterion (BIC) and restriction on the mean/variance structure for Ks (see Methods). (n) Sample size; P, number of mixture components, −lnL, log likelihood for the mixture model. For each mixture model, the proportions for each component (subpopulation) sum to 1.
We next analyzed public EST sets from selected libraries of soybean and tomato. Soybean ESTs were sampled from flower, young seedling, root, and other vegetative tissue libraries. Mixture model analysis suggests that 71% of the paralogs were likely to have arisen from a large-scale duplication (Table 3), which appears as a significant peak in the Ks distribution with estimated median Ks = 0.6705 (Fig. 3A). This species is a relatively recent tetraploid (Shoemaker et al. 1996; Blanc and Wolfe 2004; Schlueter et al. 2004). Thus many of the duplicate pairs assigned to the first component in the mixture model are likely derived from polyploidization rather than background single gene duplications.
Figure 3.

Ks distributions of paralogs in selected angiosperm species, with fitted densities from mixture model analysis, suggest paleopolyploidy in eudicots and monocots. Each fitted line indicates a subpopulation in the mixture. The first (leftmost) component corresponds to paralogs from background gene duplications; other peaks indicate estimated median Ks for ancient duplications. (A) Glycine max (soybean). (B,C) Solanum lycopersicum (tomato), data from floral tissue (B) and nonfloral tissue (C). (D) A basal eudicot, Eschscholzia californica (California poppy). (E) A basal monocot, Acorus americanus.
The results for tomato also suggest large-scale duplications, which account for >90% of paralogs. Moreover, the distributions for paralogous gene pairs sampled from two tissue sources (floral vs. nonfloral organs) were similar (Fig. 3B,C) and in agreement with previous analyses based on all duplicate gene pairs in this species (median Ks = 0.277 and 0.632) (Schlueter et al. 2004). Together, our tests found strong signals of deviation from the null model, and as expected, mixture model analyses suggested ancient polyploidy events in Arabidopsis, Glycine, and Solanum. Taken together, these results suggest that unbiased Ks distributions can be obtained from as few as 6000 unigenes sampled from complex cDNA libraries derived from developing floral organs.
Ancient polyploidy in a basal eudicot
Eschscholzia californica (California poppy, Papaveraceae) is a member of Ranunculales, the sister lineage to all other eudicots (Soltis et al. 2000; Zanis et al. 2002; Borsch et al. 2003). Analysis of the Ks distribution of 178 pairs of Eschscholzia paralogs rejected the constant birth and death model (P ≪ 0.0001), and two components in the distribution were identified by the mixture model. The second component dominated the distribution, with 89% of the duplicate pairs (Fig. 3D), providing the first strong evidence of probable ancient genome duplication in a basal eudicot. Phylogenetic analyses of duplicated AGAMOUS and AP3 homologs (Kramer et al. 1998; Kramer and Irish 1999; Zahn et al. 2005a) have suggested that this duplication event occurred after the split between Ranunculales and core eudicots. Thus, the genome-wide duplication evident in the Eschscholzia paralogous pairs was probably independent of the genome duplications that have been inferred from analyses of the Arabidopsis genome (Vision et al. 2000; Bowers et al. 2003; Maere et al. 2005).
Basal monocot
Acorus americanus (Acoraceae, Acorales) represents the sister lineage to all other monocots (Duvall et al. 1993; Soltis et al. 2000, 2002; Zanis et al. 2002; Borsch et al. 2003; Hilu et al. 2003). Three components were identified in the paralogous pairs by the mixture model approach. The second component, accounting for 33% of all duplicates, was shown as a sharp peak in the Ks distribution, while the third component, containing 65% of the duplicates, appeared as a broader peak (Fig. 3E). Based on the distinct modes observed in the raw Ks distribution, we hypothesize that the second and third components estimated in the mixture model represent two distinct large-scale duplication events. This hypothesis will be tested in future phylogenetic analyses of well-sampled gene families.
Magnoliids
Both shared and lineage-specific genome duplications were inferred from analyses of unigenes from three magnoliid species: Liriodendron tulipifera (Magnoliaceae, Magnoliales), Persea americana (Lauraceae, Laurales), and Saruma henryi (Aristolochiaceae, Piperales). A total of 92 paralogous pairs was detected in the Liriodendron unigene set. The constant-birth–death model was rejected (P < 0.001), and a mixture of two components was identified in the Ks distribution, with the second component being dominant (Fig. 4A). The null birth–death model was also rejected in the P. americana (avocado) analysis (P ≪ 0.0001) with 196 paralogous gene pairs. The optimal mixture model also included two components very similar to those seen for Liriodendron (Fig. 4B; Table 3).
Figure 4.

Ks distributions of paralogs and orthologs among magnoliids suggest independent duplications and possibly shared genome duplication events in Laurales (Persea) and Magnoliales (Liriodendron). (A,B,C) The Ks distributions for (A) Liriodendron, (B) Persea, and (C) Saruma, with fitted lines based on the mixture model analysis. (D) The Ks distribution for Liriodendron and Persea, without scaling for rate differences between lineages. (E) Ks distribution for paralogs in Liriodendron after rate calibration (adj = adjusted), compared with that of Persea, suggesting recent independent duplication and older shared genome-scale duplications. (F) Ks distribution for orthologs of two magnoliid species. (Ltu) Liriodendron; (Pam) Persea; (She) Saruma. (G) Phylogeny of one representative orthologous gene set used for relative rate estimates. The branch lengths show the estimated relative rates of synonymous evolution in respective species.
To determine whether the duplication events inferred from the Ks distributions of Liriodendron and Persea represented events in a common ancestor, we first computed the median Ks of putatively orthologous gene pairs (408 pairs identified as reciprocal best hits in BLAST searches) and compared the median Ks for orthologs with Ks values for paralogous pairs within each species. The Ks distribution of putative ortholog pairs showed a single major component (median = 0.8057, variance = 0.0858) (Fig. 4F), inferred to be slightly older than the probable genome duplication observed in Persea (median = 0.6464, variance = 0.1197; P < 0.0001, Wilcoxon test). The timing of the duplication event inferred from the Liriodendron Ks distribution (median = 0.7616, variance = 0.1328) relative to the divergence of the Persea and Liriodendron lineages was ambiguous (P = 0.35), and direct comparison of the Persea and Liriodendron Ks distributions may have been confounded by unequal substitution rates.
To account for possible variation in synonymous substitution rates between the Persea and Liriodendron lineages, we aligned putatively orthologous genes from Liriodendron, Persea, and Saruma and estimated Ks values for each lineage on a phylogeny. We examined 19 putative orthologous gene sets in the three species with alignments of at least 400 bp for all taxa (see Methods; Supplemental Table S2) and found that Ks on the lineage leading to Liriodendron was slower on average than the rate on the lineage leading to Persea. For example, in the tree for the orthologous set shown in Figure 4G, the branch length (in Ks units) for the branch leading to Persea is 1.31 times that leading to Liriodendron. The ratio of synonymous substitutions on the Persea branch relative to the Liriodendron branch ranged from 0.86 to 2.68, and the ratio was greater than one in 16 of 19 cases (Supplemental Table S2). When Liriodendron paralog Ks values were multiplied by the median branch-length ratio, 1.29, the peak in the scaled Liriodendron Ks distributions matched an older, but nonsignificant peak in the Persea Ks distribution (Fig. 4E). Taken together, these analyses suggest that the prominent peak in the Liriodendron Ks distribution (median = 0.82) represents a duplication event in the common ancestral genome of Magnoliales and Laurales that had not been identified as a distinct component in the mixture model for the Persea Ks distribution. In line with the comparison of Ks values for Persea paralogs and putative Liriodendron–Persea orthologs, we interpret the dominant peak in the Persea Ks distribution to represent a genome-scale duplication event that occurred after the divergence of Magnoliales and Laurales. This hypothesis needs to be tested with additional data.
Saruma henryi is a member of Piperales, which (with Canellales) is sister to the Magnoliales/Laurales clade (Soltis et al. 2000, 2002; Zanis et al. 2002; Borsch et al. 2003). The Ks distribution of Saruma paralogs showed a distinct peak with median Ks = 0.7927 (Fig. 4C; Table 3). This is lower than the median Ks for 202 Saruma–Liriodendron ortholog pairs (0.9555, P = 0.0001) and the median Ks for 254 putative Saruma–Persea ortholog pairs (1.0121, P < 0.0001) (Fig. 4F). We therefore surmise that the peak in the Ks distribution of Saruma paralogous pairs represents a large-scale duplication in Piperales after divergence from the Magnoliales and Laurales lineages.
Basal-most angiosperms
Amborella trichopoda (Amborellaceae) and the water lilies (Nymphaeales) are either successive sister lineages to all other extant angiosperms, or together form a clade that is sister to the rest of the angiosperms (Zanis et al. 2002; Stefanovic et al. 2004; Leebens-Mack et al. 2005). The Ks distribution for a total of 69 Amborella paralogous pairs appeared to follow an exponential distribution, but the uniform birth–death process was rejected (P < 0.01; Figure 5A). However, the mixture model analysis identified only one component containing all of the gene pairs (Table 3). Nymphaeales are represented by Nuphar advena. A total of 138 paralogous pairs was identified, and the resulting Ks distribution did not fit the constant birth–death model (P < 0.01). Three mixture components were estimated from the Ks distribution. The second component, accounting for 56% of the paralogous pairs, provided strong evidence for ancient polyploidy in the history of the Nuphar genome (Fig. 5B). The third component, with a median Ks of 1.3273, may represent the oldest genome duplication to be detected in analyses of angiosperm Ks distributions. The median Ks for the third component was not distinguishable from the median Ks value for putative Amborella–Nuphar orthologs (Fig. 5C) (median Ks[orthologs] = 1.24, variance = 0.1918, based on 113 putatively orthologous sequence pairs; P = 0.05, two-sample t-test on the log Ks[orthologs] and log Ks[third component of Nuphar paralogs]). Therefore, the third component in the Nuphar Ks distribution may correspond to a polyploidy event that occurred at approximately the time of divergence between the Amborella and Nuphar lineages (see Discussion).
Figure 5.

Ks distributions suggest possible genome duplications in basal angiosperms, and no evidence for genome duplication events in Amborella and some gymnosperm species. (A) Ks distribution in Amborella, a basal-most angiosperm. No significant large-scale duplication is detected. (B) Three distinct components in the Ks distribution for Nuphar, also a basal-most angiosperm, suggest at least two large-scale genome duplications. (C) Ks distribution for putative orthologs between Amborella and Nuphar. (D) Pinus taeda (loblolly pine) paralogous pairs follow the null model (see Methods). (E) Ks distribution for paralogs in a gymnosperm, Welwitschia.
Gymnosperms
We obtained 52,527 unigenes for Pinus taeda (loblolly pine) from PlantGDB (Dong et al. 2004), and a random sample of 6000 unigenes was drawn to match the sample size for other species we investigated. The Ks distribution showed a clear monotonous decay of paralogs with increasing age and no detectable sign of genome duplication in recent history (P = 0.16) (Fig. 5D). The frequency distribution for all paralogous pairs was essentially identical. The analysis of Pinus pinaster yielded a similar exponential distribution (Table 3).
The constant-birth–death model was rejected for Welwitschia (P < 0.01), and a mixture analysis of the Ks distribution identified two components (Fig. 5E). The second component, corresponding to the heavy right-hand tail of the distribution, may represent one or more ancient duplication events, or a reduced rate of gene death for older duplicates.
Discussion
In this paper, we introduce a model-based statistical test that accounts for estimation error in Ks values in terms of deviation from a constant rate of gene birth and death. This represents a refinement of previous studies using Ks distributions, which have yielded significant insights into genome duplications (Force et al. 1999; Lynch and Conery 2000; Blanc and Wolfe 2004; Schlueter et al. 2004). The birth–death model developed here for duplicated genes is a natural extension of stochastic birth-and-death models that have been widely used in population and phylogenetic approaches to studies of gene family evolution (Karev et al. 2004). Simulations based on this model have allowed us to investigate how specified death rates and duplication times result in Ks distributions with (or without) secondary peaks or heavy tails (e.g., Fig. 1). The model can be extended to incorporate variable rates of gene birth or death over time, and in the extreme, an instant burst of gene birth corresponding to a whole-genome duplication. Although our results could not exclude partial and segmental duplication events, the birth–death model was validated with genomes with known duplication histories where detection of whole–genome events was expected.
We found that three major factors influence the frequency and observed divergence of paralogous pairs arising from genome-wide duplications. The time since the duplication event, the rate of gene death, and the background rate of gene birth all influence observed Ks distributions. Very recent genome duplication events are associated with Ks values for resulting paralogous pairs that are indistinguishable from those of background single-gene duplications using EST data. For example, polyploidy is not clearly evident in the Ks distribution for hexaploid wheat because there has been little divergence among the parental or homeologous gene copies, and the range of divergence for allelic variants was not distinct from that of paralogs arising from recent gene duplications (Blanc and Wolfe 2004). At the same time, evidence of very ancient genome duplications is eroded as synonymous substitutions reach saturation and variance in Ks increases. This may be evident in Ks plots for wheat, maize, rice, and barley, for which evidence for a genome duplication event some 50–60 million years ago (Mya) in the common ancestor of all major grain lineages has been obscured (Blanc and Wolfe 2004; Paterson et al. 2004a). Detection of very old duplication events in Ks distributions is especially difficult in species with high synonymous substitution rates. Conversely, evidence for the oldest detectable genome-wide duplications will be found in Ks distributions for species with the slowest substitution rates (see below).
Concurrent expansion of a few gene families could lead to moderate deviations from our null model. This is especially true if ancient duplication events are overrepresented in sets of sampled paralogous pairs, or if major adaptive radiations of individual gene families preceded or accompanied the diversifications of the organismal lineages under study. In this study, we avoided over-counting of ancient gene duplications by constraining genes to be included in only one paralogous pair. Our analysis of duplicated Arabidopsis genes verified that this approach produced Ks distributions similar to those of previous studies that implemented more elaborate corrections for gene family expansions (Maere et al. 2005). Moreover, sampled paralogous genes were not particularly biased toward large gene families. Whereas most sampled duplicate genes belonged to the housekeeping functional categories, such as protein synthesis, proteolysis, and energy metabolism (Supplemental Table S1), none of the duplicate gene sets was dominated by a single gene family. Several transcription factor families were also identified in our paralog pairs, but again, no family accounted for more than a few percent of the duplicate gene pairs.
Our results for Persea (Lauraceae) and Liriodendron (Magnoliaceae) corroborate previous evidence of ancient polyploidy from isozyme studies (Soltis and Soltis 1990). Soltis and Soltis (1990) found that 25%–29% of the loci investigated were duplicated in both families, and hence could have arisen via polyploidy. All members of Magnoliaceae examined shared the same isozyme duplications (PGI, TPI, 6PGD), while the species of Lauraceae shared a similar suite of isozyme duplications (PGM, TPI, 6PGD, GDH). These were interpreted as evidence for paleopolyploid events occurring very early in the evolutionary history of Magnoliaceae and Lauraceae. The Persea and Liriodendron paralogous genes suggest polyploidy in a common ancestor at least 100 Mya (Bell et al. 2005) followed by a second round of polyploidy in the Persea lineage (Fig. 4E), but this hypothesis must be tested with analyses of additional gene family phylogenies. If this scenario is correct, the duplicated isozyme loci observed in the Magnoliaceae and Lauraceae may have arisen from a polyploidy event that predated the separation of the two families (cf. Brysting and Borgen 2000).
Over time, nucleotide substitutions can become saturated, and therefore lineages with slow synonymous substitution rates will provide a deeper view into genome history relative to lineages with faster substitution rates. It is estimated that the synonymous substitution rate in palm (2.61 × 10⁻⁹ synonymous substitutions/per year) (Gaut et al. 1996) is only about half that reported for grasses, eudicots (Lynch and Conery 2000), and grass–eudicot comparisons (Wolfe et al. 1987). We infer a similarly slow substitution rate for other basal angiosperms based on the Magnoliales–Laurales divergence as a calibration point. We estimated a synonymous site divergence of Ks = 0.7 for Liriodendron and Persea ortholog pairs (Fig. 4F). Using a divergence date estimate of ∼116 Mya for the Magnoliales–Laurales split (Bell et al. 2005), we estimate an average synonymous substitution rate of 3.02 × 10⁻⁹ synonymous substitutions/year. The low substitution rate in Liriodendron and Persea may be explained in part by their longer generation times (these lineages are trees and shrubs) relative to model eudicot and grass species.
We found that the median for the oldest component in the Nuphar Ks distribution is close to the median Ks for putative Amborella–Nuphar orthologs (median Ks = 1.24) (Fig. 5C). This level of divergence is compatible with the synonymous divergence for the very early duplication in Arabidopsis (i.e., γ duplication) (Bowers et al. 2003; De Bodt et al. 2005; Maere et al. 2005). Direct dating of the early Nuphar peak based on the Ks data is challenging because of uncertainty in the branching relationships between Amborella, Nuphar, and the rest of the angiosperms, and the possibility of additional rate variation as was seen for magnoliids. We adopted two approaches to date the earliest event in Nuphar. First, using the median Ks Amborella–Nuphar ortholog divergence of 1.24 and a calibration range of 134–165 Mya (Leebens-Mack et al. 2005) gives a rate of 4.66–3.79 × 10⁻⁹ substitutions per silent site per year. Therefore, Ks = 1.33 (the early Nuphar duplication event) would predict an age range between 143 and 173 Mya for the split between these two lineages. An alternative calculation, using the magnoliid calibration of 3.02 × 10⁻⁹ substitutions per silent site per year, leads to an estimate of 220 Mya for the divergence of lineages leading to Amborella and Nuphar.
This range of age estimates supports two alternative interpretations of the Nuphar and Amborella paralog Ks distributions. The third component in the Nuphar Ks distribution may represent polyploidy in a common ancestor of all angiosperms (Fig. 6), in agreement with recent analyses of MADS-box gene families (Kim et al. 2004; Buzgo et al. 2005; Zahn et al. 2005a). This scenario would require that evidence of ancient polyploidy has been sufficiently eroded as to be undetected in analyses of EST samples from Amborella and various other angiosperm species owing to gene death and/or saturation of synonymous substitutions as discussed above. For example, the nonsignificant peaks around Ks = 1.5 in the Liriodendron and Persea Ks distributions (Fig. 4A,B) may provide weak evidence of polyploidy early in angiosperm history. Alternatively, the earliest duplication peak detected in the Nuphar analysis may trace back to a genome duplication in the common ancestor of Nuphar and all extant angiosperm lineages other than Amborella (Fig. 6). This scenario would be consistent with the hypothesis that Amborella is sister to all other extant angiosperms (e.g., solid line on Fig. 6), and the extremely low proportion of duplicate genes found in the Amborella unigene set. This scenario also would narrow the timing of a genome duplication to ∼10 Myr separating the branching points for Amborella and all other extant angiosperm lineages (Leebens-Mack et al. 2005). As discussed above, however, there have been instances where known genome duplication events have not been detected in Ks distributions (Fig. 1; Blanc and Wolfe 2004; Paterson et al. 2004b), thus lack of evidence for ancient polyploidy in the Amborella Ks distribution does not exclude the possibility of polyploidy in an ancestral genome. More sequence data, and ultimately whole genome sequences, will be needed from Amborella, water lilies, and other early branching angiosperm species to select among these alternative scenarios for polyploid origins of angiosperms.
Figure 6.

Phylogenetic summary of paleopolyploidy events estimated by the mixture model approach and their distribution among angiosperm and gymnosperm lineages. Scaled graph in center with Xs corresponding to median Ks of pairs from background gene duplications, while small ovals indicate the median Ks of possible concentrated duplications in the history of particular lineages. The phylogenetic tree at left shows the likely placement of detected genome-scale duplications. Uncertainty in phylogenetic timing of what may be a single duplication event at the base of the angiosperms is indicated with a wide oval that covers possible branching points compatible with the Ks evidence. Hollow ovals indicate duplications identified in previous studies using paralogous genes or genomic data from those lineages.
While genomic sequences have revealed evidence of polyploidy in Poaceae and core eudicots, the secondary peaks found in paralog Ks distributions for representatives of virtually all major angiosperm lineages support the notion that genome duplications are common in angiosperm history and gene birth and death are important processes in plant evolution (Lynch and Conery 2000). The evidence now supports the hypothesis proposed initially decades ago by Stebbins (1950) that angiosperms have experienced repeated rounds of polyploidization throughout their evolutionary history. Many questions follow: How many polyploidy events separate different plant lineages? What is the typical fate of genes generated through these duplication events? And perhaps most intriguingly, have polyploidy events been important engines of angiosperm diversification? Genome-scale sequencing of phylogenetically crucial angiosperm species would provide the data necessary to directly test whether the rapid diversification of flowering plants following their origin (Darwin 1903) was associated with one or more polyploidy events.
Methods
EST sequencing and assembly
EST sequences from floral cDNA libraries of seven species (Amborella trichopoda, yellow water lily [Nuphar advena], avocado [Persea americana], yellow-poplar [Liriodendron tulipifera], wild ginger [Saruma henryi]), sweet flag [Acorus americanus], and California poppy [Eschscholzia californica]) are available through the Plant Genome Network (http://www.pgn.cornell.edu). cDNA library construction, EST sequencing, and assembly were described previously (Albert et al. 2005).
Public EST sets from selected libraries for Arabidopsis thaliana, soybean (Glycine max, Williams 82), and tomato (Solanum lycopersicum, cultivar TA496) were downloaded from the GenBank dbEST section, trimmed using seqclean, and assembled using CAP3 with the percent identity parameter P = 90 and overlap length 40 bp. A. thaliana ESTs were from four libraries (root, flower, green silique, and 2- to 6-wk above-ground organs). To minimize the allelic variations in the EST sequence collection, the unigenes were mapped to the Arabidopsis genome, and redundant unigenes matching the same genomic locus were discarded. Only the sequences that matched the protein-coding regions were retained. From this screened unigene set, we drew replicate samples with 6000 unigenes in each sample. The sample size of 6000 Arabidopsis unigenes approximates the number of unigenes from new EST data sets we analyzed. To see if library sources influence estimates, we analyzed two samples of tomato ESTs, one from floral cDNA libraries and one from vegetative cDNA libraries. The soybean ESTs were sampled from cDNA libraries of flower, young seedling, root, and other vegetative organs. Unigenes for gymnosperms Pinus taeda and Pinus pinaster were downloaded from PlantGDB (Dong et al. 2004), which were built with public ESTs from all libraries. For each species, we sampled 6000 unigenes for Ks analysis.
Ks calculation for paralogs and orthologs
Paralogous pairs of sequences were identified from best reciprocal matches in all-by-all BLASTN searches. For data sets with trace files, we discarded bases with Phred (Ewing and Green 1998; Ewing et al. 1998) quality values lower than 20. Only sequence pairs with alignment lengths >300 bp were used for Ks calculations. Translated sequences of unigenes generated by ESTScan (Iseli et al. 1999) were aligned using MUSCLE v3.3 (Edgar 2004). Nucleotide sequences were then forced to fit the amino acid alignments. The Ks value for each sequence pair was calculated using the Goldman and Yang maximum likelihood method (Goldman and Yang 1994) implemented in codeml with the F3×4 model (Yang 1997). In order to assess whether the shape of Ks distributions was dependent on the estimation procedure, the Nei-Gojobori method, the modified Nei-Gojobori method, and the YN00 method (Yang and Nielsen 2000) were also applied on the Arabidopsis set. The Ks frequency in each interval size of 0.05 within the range [0, 2.0] was plotted.
The age distribution of paralogs under a constant birth–death model (the null model)
We modeled the birth and death of paralogs formed by gene duplications under a constant-rate birth–death model in order to test whether an observed frequency distribution of Ks values indicates deviation from this process. The duplicate genes are generated by a Poisson process at rate β, and the number of duplicate pairs decreases by age at an exponential rate δ. We can estimate the age distribution of surviving paralogs (survivors), total N, by considering the process as sampling gene birth over time [0, t], and decide if each birth was a survivor.
The distribution for the number of survivors of age t is
where γ = β/δ, and F(t) = 1 − exp(−δt), the cumulative density function of exponential (δ). From this we deduce that the population size N(∞) = Po(γ). Furthermore, the survivors’ age distribution is an empirical distribution of a sample of exponentially distributed random variables, generated with the parameter δ.
To obtain an estimate of the true age, we must consider the error of Ks with respect to the true age of paralogs. If the true age is T, then we can calculate Ks (with error) as
 |
where s|t is the standard error for Ks at T = t, and z is a standard normal random variable. The error can be estimated from the empirical standard error given by the PAML software.
The mean of s is expected to correlate with the time t, since older Ks estimates have larger variances. The conditional distribution of s can be approximated by exponential (2/t). The maximum likelihood estimate of the parameter δ from the data was obtained using a grid-based method, and a simulated sample under the null model was compared to the observed using a χ2 test. A quantile–quantile plot (Q-Q plot) was used to visualize the difference between observed data and a simulated data set according to the null model. A strong deviation from the 45° line in the Q-Q plot suggests that the two distributions differ, and a bootstrapped Kolmogorov-Smirnov test (http://sekhon.polisci.berkeley.edu/matching/ks.boot.html) was applied to compare the observed and expected Ks distributions. The modeling and simulation scripts are available as Supplemental data.
Finite mixture model of genome duplications
In order to explore further how genome-wide duplication events influence the age distribution of paralogs and Ks distributions, we defined “background duplication” as gene duplication under the constant-rate birth–death process, and a “genome duplication” as an instant spike of gene birth overlaid on top of the background. We modeled changes in Ks distributions with increasing time since a duplication event, while assuming a constant rate of gene loss (death rate) and a constant background gene duplication rate (birth rate). Each simulation included a genome duplication (which led to new duplicates n) at time t. About 5% of duplicates were allowed to escape the death process.
In all instances when we rejected the constant rates hypothesis, we surmised that the observed Ks distributions actually reflect a compound distribution generated by variable birth and/or death rates from the time of duplication. For example, a genome duplication event would generate an immediate spike in the birth of paralogs. Mixture models treat the distribution of interest as a mixture of several component distributions in various proportions. The EMMIX software is suitable for mixed populations, where each component can be described by a Gaussian density (McLachlan et al. 1999) (see http://www.maths.uq.edu.au/∼gjm/emmix/emmix.html for the Users’ Guide). Following Schlueter et al. (2004), we modeled the log-transformed Ks distribution of paralogs. (The actual distribution is a mixture of log-transformed exponentials and normals.) Observations with Ks < 0.005 were excluded to avoid fitting a component to infinity (Schlueter et al. 2004). This truncation might also reduce the proportion of gene pairs attributed to background duplication. We modeled the mixed populations with one to four components and repeated the EM algorithm 100 times with random starting values, as well as 10 times with k-mean start values. One restriction imposed on the variance structure of Ks is that variance increases with the mean according to the empirical estimates. The observed data could therefore often be fitted to more than one component, with different means, variances, and mixture proportions. The mixture model with the best fit was identified using the Bayesian Information Criterion (Schwarz 1978). The mean and variance for each component (subpopulation of log Ks values) for the selected model were back-transformed to the original scale for plotting and interpretation.
Calibrating rate of synonymous substitution across lineages
When comparing Ks distributions among taxa, variation in the substitution rates among lineages must be taken into account. We used a phylogenetic approach to estimate lineage-specific synonymous substitution rates on branches leading to the magnoliids L. tulipifera, P. americana, and S. henryi. Orthologous genes from A. thaliana, rice, and the three magnoliid species were classified by InParanoid (Remm et al. 2001). Protein alignments of Arabidopsis and rice gene models (the TIGR Arabidopsis thaliana database, the TIGR rice database) were first constructed, then DNA alignments were forced to protein alignments by codon positions. A maximum likelihood tree was estimated using the HKY model in PHYML v.2.4.3 (Guindon and Gascuel 2003) for each putative ortholog set including at least 400 aligned nucleotide positions. A per-site estimate of Ks was then made for each magnoliid branch in gene phylogenies consistent with organismal relationships ([Liriodendron, Persea] Saruma) using codeml in the PAML package (Yang 1997). The ratio of Ks values on the Persea branch relative to the Liriodendron branch was then estimated for each gene.
Two supplemental tables and R-scripts for birth–death simulations are available as Supplemental material. Teri Solow and Lukas Muller provided the EST sequence assembly for eight species (A. americanus, A. trichopoda, E. californica, L. tulipifera, N. advena, P. americana, S. henryi, and Welwitschia mirabilis), now available through the Plant Genome Network (http://pgn.cornell.edu/).
Acknowledgments
We thank Jongmin Nam for providing code for Ks computation; Lena Scheaffer, Yi Hu, and Shelia Plock for technical support on cDNA library construction and sequencing; Lukas Mueller, Dan Ilut, Teri Solow, and Steve Tanksley for the PGN Database; and anonymous reviewers for critical comments on the manuscript. This work was supported by NSF Plant Genome award DBI-0115684.
Footnotes
[Supplemental material is available online at www.genome.org. ]
Article published online before print. Article and publication date are at http://www.genome.org/cgi/doi/10.1101/gr.4825606
References
- Abi-Rached L., Gilles A., Shiina T., Pontarotti P., Inoko H., Gilles A., Shiina T., Pontarotti P., Inoko H., Shiina T., Pontarotti P., Inoko H., Pontarotti P., Inoko H., Inoko H. Evidence of en bloc duplication in vertebrate genomes. Nat. Genet. 2002;31:100–105. doi: 10.1038/ng855. [DOI] [PubMed] [Google Scholar]
- Adams K.L., Cronn R., Percifield R., Wendel J.F., Cronn R., Percifield R., Wendel J.F., Percifield R., Wendel J.F., Wendel J.F. Genes duplicated by polyploidy show unequal contributions to the transcriptome and organ-specific reciprocal silencing. Proc. Natl. Acad. Sci. 2003;100:4649–4654. doi: 10.1073/pnas.0630618100. [DOI] [PMC free article] [PubMed] [Google Scholar]
- Albert V.A., Soltis D.E., Carlson J.E., Farmerie W.G., Wall P.K., Ilut D.C., Solow T.M., Mueller L.A., Landherr L.L., Hu Y., Soltis D.E., Carlson J.E., Farmerie W.G., Wall P.K., Ilut D.C., Solow T.M., Mueller L.A., Landherr L.L., Hu Y., Carlson J.E., Farmerie W.G., Wall P.K., Ilut D.C., Solow T.M., Mueller L.A., Landherr L.L., Hu Y., Farmerie W.G., Wall P.K., Ilut D.C., Solow T.M., Mueller L.A., Landherr L.L., Hu Y., Wall P.K., Ilut D.C., Solow T.M., Mueller L.A., Landherr L.L., Hu Y., Ilut D.C., Solow T.M., Mueller L.A., Landherr L.L., Hu Y., Solow T.M., Mueller L.A., Landherr L.L., Hu Y., Mueller L.A., Landherr L.L., Hu Y., Landherr L.L., Hu Y., Hu Y., et al. Floral gene resources from basal angiosperms for comparative genomics research. BMC Plant Biol. 2005;5:5. doi: 10.1186/1471-2229-5-5. [DOI] [PMC free article] [PubMed] [Google Scholar]
- Bell C.D., Soltis D.E., Soltis P.S., Soltis D.E., Soltis P.S., Soltis P.S. The age of the angiosperms: A molecular timescale without a clock. Evolution Int. J. Org. Evolution. 2005;59:1245–1258. [PubMed] [Google Scholar]
- Bennett M.D., Leitch I.J., Price H.J., Johnston J.S., Leitch I.J., Price H.J., Johnston J.S., Price H.J., Johnston J.S., Johnston J.S. Comparisons with Caenorhabditis (approximately 100 Mb) and Drosophila (approximately 175 Mb) using flow cytometry show genome size in Arabidopsis to be approximately 157 Mb and thus approximately 25% larger than the Arabidopsis Genome Initiative estimate of approximately 125 Mb. Ann. Bot. (Lond.) 2003;91:547–557. doi: 10.1093/aob/mcg057. [DOI] [PMC free article] [PubMed] [Google Scholar]
- Bierne N., Eyre-Walker A., Eyre-Walker A. The problem of counting sites in the estimation of the synonymous and nonsynonymous substitution rates: Implications for the correlation between the synonymous substitution rate and codon usage bias. Genetics. 2003;165:1587–1597. doi: 10.1093/genetics/165.3.1587. [DOI] [PMC free article] [PubMed] [Google Scholar]
- Blanc G., Wolfe K.H., Wolfe K.H. Widespread paleopolyploidy in model plant species inferred from age distribution of duplicate genes. Plant Cell. 2004;16:1667–1678. doi: 10.1105/tpc.021345. [DOI] [PMC free article] [PubMed] [Google Scholar]
- Blanc G., Barakat A., Guyot R., Cooke R., Delseny M., Barakat A., Guyot R., Cooke R., Delseny M., Guyot R., Cooke R., Delseny M., Cooke R., Delseny M., Delseny M. Extensive duplication and reshuffling in the Arabidopsis genome. Plant Cell. 2000;12:1093–1101. doi: 10.1105/tpc.12.7.1093. [DOI] [PMC free article] [PubMed] [Google Scholar]
- Blanc G., Hokamp K., Wolfe K.H., Hokamp K., Wolfe K.H., Wolfe K.H. A recent polyploidy superimposed on older large-scale duplications in the Arabidopsis genome. Genome Res. 2003;13:137–144. doi: 10.1101/gr.751803. [DOI] [PMC free article] [PubMed] [Google Scholar]
- Bogart J.P. Evolutionary implications of polyploidy in amphibians and reptiles. Basic Life Sci. 1979;13:341–378. doi: 10.1007/978-1-4613-3069-1_18. [DOI] [PubMed] [Google Scholar]
- Borsch T., Hilu K.W., Quandt D., Wilde V., Neinhuis C., Barthlott W., Hilu K.W., Quandt D., Wilde V., Neinhuis C., Barthlott W., Quandt D., Wilde V., Neinhuis C., Barthlott W., Wilde V., Neinhuis C., Barthlott W., Neinhuis C., Barthlott W., Barthlott W. Noncoding plastid trnT–trnF sequences reveal a well resolved phylogeny of basal angiosperms. J. Evol. Biol. 2003;16:558–576. doi: 10.1046/j.1420-9101.2003.00577.x. [DOI] [PubMed] [Google Scholar]
- Bowers J.E., Chapman B.A., Rong J., Paterson A.H., Chapman B.A., Rong J., Paterson A.H., Rong J., Paterson A.H., Paterson A.H. Unravelling angiosperm genome evolution by phylogenetic analysis of chromosomal duplication events. Nature. 2003;422:433–438. doi: 10.1038/nature01521. [DOI] [PubMed] [Google Scholar]
- Brysting A.K., Borgen L., Borgen L. Isozyme analysis of the Cerastium alpinum C-arcticum complex (Caryophyllaceae) supports a splitting of C. arcticum Lange. Plant Syst. Evol. 2000;220:199–221. [Google Scholar]
- Buzgo M., Soltis P.S., Kim S., Soltis D.E., Soltis P.S., Kim S., Soltis D.E., Kim S., Soltis D.E., Soltis D.E. The making of a flower. Biologist. 2005;52:149–154. [Google Scholar]
- Cannon S.B., Mitra A., Baumgarten A., Young N.D., May G., Mitra A., Baumgarten A., Young N.D., May G., Baumgarten A., Young N.D., May G., Young N.D., May G., May G. The roles of segmental and tandem gene duplication in the evolution of large gene families in Arabidopsis thaliana. BMC Plant Biol. 2004;4:10. doi: 10.1186/1471-2229-4-10. [DOI] [PMC free article] [PubMed] [Google Scholar]
- Darlington C.D.1937. . Recent advances in cytology. P. Blakiston’s Son & Co., Philadelphia, PA. [Google Scholar]
- Darwin C.D.1903. . More letters of Charles Darwin. John Murray, London. [Google Scholar]
- De Bodt S., Maere S., Van de Peer Y., Maere S., Van de Peer Y., Van de Peer Y.2005Genome duplication and the origin of angiosperms. Trends Ecol. Evol. 20: 591–597. [DOI] [PubMed] [Google Scholar]
- Dehal P., Boore J.L., Boore J.L. Two rounds of whole genome duplication in the ancestral vertebrate. PLoS Biol. 2005;3:e314. doi: 10.1371/journal.pbio.0030314. [DOI] [PMC free article] [PubMed] [Google Scholar]
- deWet J.M. Origins of polyploids. Basic Life Sci. 1979;13:3–15. doi: 10.1007/978-1-4613-3069-1_1. [DOI] [PubMed] [Google Scholar]
- Dong Q., Schlueter S.D., Brendel V., Schlueter S.D., Brendel V., Brendel V. PlantGDB, plant genome database and analysis tools. Nucleic Acids Res. 2004;32:D354–D359. doi: 10.1093/nar/gkh046. [DOI] [PMC free article] [PubMed] [Google Scholar]
- Duvall M.R., Learn G.H., Jr., Eguiarte L.E., Clegg M.T., Learn G.H., Jr., Eguiarte L.E., Clegg M.T., Eguiarte L.E., Clegg M.T., Clegg M.T. Phylogenetic analysis of rbcL sequences identifies Acorus calamus as the primal extant monocotyledon. Proc. Natl. Acad. Sci. 1993;90:4641–4644. doi: 10.1073/pnas.90.10.4641. [DOI] [PMC free article] [PubMed] [Google Scholar]
- Edgar R.C. MUSCLE: A multiple sequence alignment method with reduced time and space complexity. BMC Bioinformatics. 2004;5:113. doi: 10.1186/1471-2105-5-113. [DOI] [PMC free article] [PubMed] [Google Scholar]
- Ewing B., Green P., Green P. Base-calling of automated sequencer traces using phred. II. Error probabilities. Genome Res. 1998;8:186–194. [PubMed] [Google Scholar]
- Ewing B., Hillier L., Wendl M.C., Green P., Hillier L., Wendl M.C., Green P., Wendl M.C., Green P., Green P. Base-calling of automated sequencer traces using phred. I. Accuracy assessment. Genome Res. 1998;8:175–185. doi: 10.1101/gr.8.3.175. [DOI] [PubMed] [Google Scholar]
- Force A., Lynch M., Pickett F.B., Amores A., Yan Y.L., Postlethwait J., Lynch M., Pickett F.B., Amores A., Yan Y.L., Postlethwait J., Pickett F.B., Amores A., Yan Y.L., Postlethwait J., Amores A., Yan Y.L., Postlethwait J., Yan Y.L., Postlethwait J., Postlethwait J. Preservation of duplicate genes by complementary, degenerative mutations. Genetics. 1999;151:1531–1545. doi: 10.1093/genetics/151.4.1531. [DOI] [PMC free article] [PubMed] [Google Scholar]
- Friedman R., Hughes A.L., Hughes A.L. Gene duplication and the structure of eukaryotic genomes. Genome Res. 2001;11:373–381. doi: 10.1101/gr.155801. [DOI] [PMC free article] [PubMed] [Google Scholar]
- Gaut B.S., Morton B.R., McCaig B.C., Clegg M.T., Morton B.R., McCaig B.C., Clegg M.T., McCaig B.C., Clegg M.T., Clegg M.T. Substitution rate comparisons between grasses and palms: Synonymous rate differences at the nuclear gene Adh parallel rate differences at the plastid gene rbcL. Proc. Natl. Acad. Sci. 1996;93:10274–10279. doi: 10.1073/pnas.93.19.10274. [DOI] [PMC free article] [PubMed] [Google Scholar]
- Goldman N., Yang Z., Yang Z. A codon-based model of nucleotide substitution for protein-coding DNA sequences. Mol. Biol. Evol. 1994;11:725–736. doi: 10.1093/oxfordjournals.molbev.a040153. [DOI] [PubMed] [Google Scholar]
- Grant V.1963. . The origin of adaptations. Columbia University Press, New York. [Google Scholar]
- Grant V.1981. . Plant speciation. Columbia University Press, New York. [Google Scholar]
- Grant D., Cregan P., Shoemaker R.C., Cregan P., Shoemaker R.C., Shoemaker R.C. Genome organization in dicots: Genome duplication in Arabidopsis and synteny between soybean and Arabidopsis. Proc. Natl. Acad. Sci. 2000;97:4168–4173. doi: 10.1073/pnas.070430597. [DOI] [PMC free article] [PubMed] [Google Scholar]
- Gu X., Wang Y., Gu J., Wang Y., Gu J., Gu J. Age distribution of human gene families shows significant roles of both large- and small-scale duplications in vertebrate evolution. Nat. Genet. 2002;31:205–209. doi: 10.1038/ng902. [DOI] [PubMed] [Google Scholar]
- Guindon S., Gascuel O., Gascuel O. A simple, fast, and accurate algorithm to estimate large phylogenies by maximum likelihood. Syst. Biol. 2003;52:696–704. doi: 10.1080/10635150390235520. [DOI] [PubMed] [Google Scholar]
- Hilu K.W. Polyploidy and the evolution of domesticated plants. Am. J. Bot. 1993;80:2521–2528. [Google Scholar]
- Hilu K.W., Borsch T., Mueller K., Soltis D.E., Soltis P.S., Savolainen V., Chase M.W., Powell M., Alice L.A., Evans R., Borsch T., Mueller K., Soltis D.E., Soltis P.S., Savolainen V., Chase M.W., Powell M., Alice L.A., Evans R., Mueller K., Soltis D.E., Soltis P.S., Savolainen V., Chase M.W., Powell M., Alice L.A., Evans R., Soltis D.E., Soltis P.S., Savolainen V., Chase M.W., Powell M., Alice L.A., Evans R., Soltis P.S., Savolainen V., Chase M.W., Powell M., Alice L.A., Evans R., Savolainen V., Chase M.W., Powell M., Alice L.A., Evans R., Chase M.W., Powell M., Alice L.A., Evans R., Powell M., Alice L.A., Evans R., Alice L.A., Evans R., Evans R., et al. Angiosperm phylogeny based on matK sequence information. Am. J. Bot. 2003;90:1758–1776. doi: 10.3732/ajb.90.12.1758. [DOI] [PubMed] [Google Scholar]
- Hughes A.L. Phylogenies of developmentally important proteins do not support the hypothesis of two rounds of genome duplication early in vertebrate history. J. Mol. Evol. 1999;48:565–576. doi: 10.1007/pl00006499. [DOI] [PubMed] [Google Scholar]
- Hughes A.L., Friedman R., Friedman R. 2R or not 2R: Testing hypotheses of genome duplication in early vertebrates. J. Struct. Funct. Genomics. 2003;3:85–93. [PubMed] [Google Scholar]
- Iseli C., Jongeneel C.V., Bucher P., Jongeneel C.V., Bucher P., Bucher P.1999ESTScan: A program for detecting, evaluating, and reconstructing potential coding regions in EST sequences. Proc. Int. Conf. Intell. Syst. Mol. Biol. 138–148. [PubMed] [Google Scholar]
- Karev G.P., Wolf Y.I., Berezovskaya F.S., Koonin E.V., Wolf Y.I., Berezovskaya F.S., Koonin E.V., Berezovskaya F.S., Koonin E.V., Koonin E.V. Gene family evolution: An in-depth theoretical and simulation analysis of non-linear birth-death-innovation models. BMC Evol. Biol. 2004;4:32. doi: 10.1186/1471-2148-4-32. [DOI] [PMC free article] [PubMed] [Google Scholar]
- Kellis M., Birren B.W., Lander E.S., Birren B.W., Lander E.S., Lander E.S. Proof and evolutionary analysis of ancient genome duplication in the yeast Saccharomyces cerevisiae. Nature. 2004;428:617–624. doi: 10.1038/nature02424. [DOI] [PubMed] [Google Scholar]
- Kim S., Yoo M.-J., Albert V.A., Farris J.S., Soltis P.S., Soltis D.E., Yoo M.-J., Albert V.A., Farris J.S., Soltis P.S., Soltis D.E., Albert V.A., Farris J.S., Soltis P.S., Soltis D.E., Farris J.S., Soltis P.S., Soltis D.E., Soltis P.S., Soltis D.E., Soltis D.E. Phylogeny and diversification of B-function MADS-box genes in angiosperms: Evolutionary and functional implications of a 260-million-year-old duplication. Am. J. Bot. 2004;91:2102–2118. doi: 10.3732/ajb.91.12.2102. [DOI] [PubMed] [Google Scholar]
- Kramer E.M., Irish V.F., Irish V.F. Evolution of genetic mechanisms controlling petal development. Nature. 1999;399:144–148. doi: 10.1038/20172. [DOI] [PubMed] [Google Scholar]
- Kramer E.M., Dorit R.L., Irish V.F., Dorit R.L., Irish V.F., Irish V.F. Molecular evolution of genes controlling petal and stamen development: Duplication and divergence within the APETALA3 and PISTILLATA MADS-box gene lineages. Genetics. 1998;149:765–783. doi: 10.1093/genetics/149.2.765. [DOI] [PMC free article] [PubMed] [Google Scholar]
- Ku H.M., Vision T., Liu J., Tanksley S.D., Vision T., Liu J., Tanksley S.D., Liu J., Tanksley S.D., Tanksley S.D. Comparing sequenced segments of the tomato and Arabidopsis genomes: Large-scale duplication followed by selective gene loss creates a network of synteny. Proc. Natl. Acad. Sci. 2000;97:9121–9126. doi: 10.1073/pnas.160271297. [DOI] [PMC free article] [PubMed] [Google Scholar]
- Leebens-Mack J., Raubeson L.A., Cui L., Kuehl J.V., Fourcade M.H., Chumley T.W., Boore J.L., Jansen R.K., dePamphilis C.W., Raubeson L.A., Cui L., Kuehl J.V., Fourcade M.H., Chumley T.W., Boore J.L., Jansen R.K., dePamphilis C.W., Cui L., Kuehl J.V., Fourcade M.H., Chumley T.W., Boore J.L., Jansen R.K., dePamphilis C.W., Kuehl J.V., Fourcade M.H., Chumley T.W., Boore J.L., Jansen R.K., dePamphilis C.W., Fourcade M.H., Chumley T.W., Boore J.L., Jansen R.K., dePamphilis C.W., Chumley T.W., Boore J.L., Jansen R.K., dePamphilis C.W., Boore J.L., Jansen R.K., dePamphilis C.W., Jansen R.K., dePamphilis C.W., dePamphilis C.W. Identifying the basal angiosperm node in chloroplast genome phylogenies: Sampling one’s way out of the Felsenstein zone. Mol. Biol. Evol. 2005;22:1948–1963. doi: 10.1093/molbev/msi191. [DOI] [PubMed] [Google Scholar]
- Li W.H., Grauer D., Grauer D.1991. . Fundamentals of molecular evolution. Sinauer Associates, Sunderland, MA. [Google Scholar]
- Liu B., Wendel J.F., Wendel J.F. Epigenetic phenomena and the evolution of plant allopolyploids. Mol. Phylogenet. Evol. 2003;29:365–379. doi: 10.1016/s1055-7903(03)00213-6. [DOI] [PubMed] [Google Scholar]
- Lynch M., Conery J.S., Conery J.S. The evolutionary fate and consequences of duplicate genes. Science. 2000;290:1151–1155. doi: 10.1126/science.290.5494.1151. [DOI] [PubMed] [Google Scholar]
- Maere S., De Bodt S., Raes J., Casneuf T., Van Montagu M., Kuiper M., de Van Peer Y., De Bodt S., Raes J., Casneuf T., Van Montagu M., Kuiper M., de Van Peer Y., Raes J., Casneuf T., Van Montagu M., Kuiper M., de Van Peer Y., Casneuf T., Van Montagu M., Kuiper M., de Van Peer Y., Van Montagu M., Kuiper M., de Van Peer Y., Kuiper M., de Van Peer Y., de Van Peer Y. Modeling gene and genome duplications in eukaryotes. Proc. Natl. Acad. Sci. 2005;102:5454–5459. doi: 10.1073/pnas.0501102102. [DOI] [PMC free article] [PubMed] [Google Scholar]
- Makalowski W. Are we polyploids? A brief history of one hypothesis. Genome Res. 2001;11:667–670. doi: 10.1101/gr.188801. [DOI] [PubMed] [Google Scholar]
- Masterson J. Stomatal size in fossil plants: Evidence for polyploidy in majority of angiosperms. Science. 1994;264:421–424. doi: 10.1126/science.264.5157.421. [DOI] [PubMed] [Google Scholar]
- McLachlan G.J., Peel D., Basford K.E., Adams P., Peel D., Basford K.E., Adams P., Basford K.E., Adams P., Adams P. The EMMIX software for the fitting of mixtures of normal and t-components. J. Stat. Softw. 1999;4:2. [Google Scholar]
- McLysaght A., Hokamp K., Wolfe K.H., Hokamp K., Wolfe K.H., Wolfe K.H. Extensive genomic duplication during early chordate evolution. Nat. Genet. 2002;31:200–204. doi: 10.1038/ng884. [DOI] [PubMed] [Google Scholar]
- Müntzing A. The evolutionary significance of autopolyploidy. Hereditas. 1936;21:263–378. [Google Scholar]
- Nei M., Gojobori T., Gojobori T. Simple methods for estimating the numbers of synonymous and nonsynonymous nucleotide substitutions. Mol. Biol. Evol. 1986;3:418–426. doi: 10.1093/oxfordjournals.molbev.a040410. [DOI] [PubMed] [Google Scholar]
- Ohno S.1970. . Evolution by gene duplication. Springer-Verlag, New York. [Google Scholar]
- Otto S.P., Whitton J., Whitton J. Polyploid incidence and evolution. Annu. Rev. Genet. 2000;34:401–437. doi: 10.1146/annurev.genet.34.1.401. [DOI] [PubMed] [Google Scholar]
- Paterson A.H., Bowers J.E., Chapman B.A., Bowers J.E., Chapman B.A., Chapman B.A. Ancient polyploidization predating divergence of the cereals, and its consequences for comparative genomics. Proc. Natl. Acad. Sci. 2004a;101:9903–9908. doi: 10.1073/pnas.0307901101. [DOI] [PMC free article] [PubMed] [Google Scholar]
- Paterson A.H., Bowers J.E., Chapman B.A., Peterson D.G., Rong J., Wicker T.M., Bowers J.E., Chapman B.A., Peterson D.G., Rong J., Wicker T.M., Chapman B.A., Peterson D.G., Rong J., Wicker T.M., Peterson D.G., Rong J., Wicker T.M., Rong J., Wicker T.M., Wicker T.M. Comparative genome analysis of monocots and dicots, toward characterization of angiosperm diversity. Curr. Opin. Biotechnol. 2004b;15:120–125. doi: 10.1016/j.copbio.2004.03.001. [DOI] [PubMed] [Google Scholar]
- Remm M., Storm C.E., Sonnhammer E.L., Storm C.E., Sonnhammer E.L., Sonnhammer E.L. Automatic clustering of orthologs and in-paralogs from pairwise species comparisons. J. Mol. Biol. 2001;314:1041–1052. doi: 10.1006/jmbi.2000.5197. [DOI] [PubMed] [Google Scholar]
- Schlueter J.A., Dixon P., Granger C., Grant D., Clark L., Doyle J.J., Shoemaker R.C., Dixon P., Granger C., Grant D., Clark L., Doyle J.J., Shoemaker R.C., Granger C., Grant D., Clark L., Doyle J.J., Shoemaker R.C., Grant D., Clark L., Doyle J.J., Shoemaker R.C., Clark L., Doyle J.J., Shoemaker R.C., Doyle J.J., Shoemaker R.C., Shoemaker R.C. Mining EST databases to resolve evolutionary events in major crop species. Genome. 2004;47:868–876. doi: 10.1139/g04-047. [DOI] [PubMed] [Google Scholar]
- Schwarz G. Estimating the dimension of a model. Ann. Statist. 1978;6:461–464. [Google Scholar]
- Shoemaker R.C., Polzin K., Labate J., Specht J., Brummer E.C., Olson T., Young N., Concibido V., Wilcox J., Tamulonis J.P., Polzin K., Labate J., Specht J., Brummer E.C., Olson T., Young N., Concibido V., Wilcox J., Tamulonis J.P., Labate J., Specht J., Brummer E.C., Olson T., Young N., Concibido V., Wilcox J., Tamulonis J.P., Specht J., Brummer E.C., Olson T., Young N., Concibido V., Wilcox J., Tamulonis J.P., Brummer E.C., Olson T., Young N., Concibido V., Wilcox J., Tamulonis J.P., Olson T., Young N., Concibido V., Wilcox J., Tamulonis J.P., Young N., Concibido V., Wilcox J., Tamulonis J.P., Concibido V., Wilcox J., Tamulonis J.P., Wilcox J., Tamulonis J.P., Tamulonis J.P., et al. Genome duplication in soybean (Glycine subgenus soja). Genetics. 1996;144:329–338. doi: 10.1093/genetics/144.1.329. [DOI] [PMC free article] [PubMed] [Google Scholar]
- Simillion C., Vandepoele K., Van Montagu M.C., Zabeau M., Van de Peer Y., Vandepoele K., Van Montagu M.C., Zabeau M., Van de Peer Y., Van Montagu M.C., Zabeau M., Van de Peer Y., Zabeau M., Van de Peer Y., Van de Peer Y. The hidden duplication past of Arabidopsis thaliana. Proc. Natl. Acad. Sci. 2002;99:13627–13632. doi: 10.1073/pnas.212522399. [DOI] [PMC free article] [PubMed] [Google Scholar]
- Soltis D.E., Soltis P.S., Soltis P.S. Isozyme evidence for ancient polyploidy in primitive angiosperms. Syst. Bot. 1990;15:328–337. [Google Scholar]
- Soltis D.E., Soltis P.S., Soltis P.S. Polyploidy: Recurrent formation and genome evolution. Trends Ecol. Evol. 1999;14:348–352. doi: 10.1016/s0169-5347(99)01638-9. [DOI] [PubMed] [Google Scholar]
- Soltis P.S., Soltis D.E., Zanis M.J., Kim S., Soltis D.E., Zanis M.J., Kim S., Zanis M.J., Kim S., Kim S. Basal lineages of angiosperms: Relationships and implications for floral evolution. Int. J. Plant Sci. 2000;161:S97–S107. [Google Scholar]
- Soltis D.E., Soltis P.S., Zanis M.J., Soltis P.S., Zanis M.J., Zanis M.J. Phylogeny of seed plants based on evidence from eight genes. Am. J. Bot. 2002;89:1670–1681. doi: 10.3732/ajb.89.10.1670. [DOI] [PubMed] [Google Scholar]
- Stebbins G.L.1950. . Variation and evolution in plants. Columbia University Press, New York. [Google Scholar]
- Stefanovic S., Rice D.W., Palmer J.D., Rice D.W., Palmer J.D., Palmer J.D. Long branch attraction, taxon sampling, and the earliest angiosperms: Amborellaor monocots? BMC Evol. Biol. 2004;4:35. doi: 10.1186/1471-2148-4-35. [DOI] [PMC free article] [PubMed] [Google Scholar]
- Vision T.J., Brown D.G., Tanksley S.D., Brown D.G., Tanksley S.D., Tanksley S.D. The origins of genomic duplications in Arabidopsis. Science. 2000;290:2114–2117. doi: 10.1126/science.290.5499.2114. [DOI] [PubMed] [Google Scholar]
- Wang H.C., Singer G.A., Hickey D.A., Singer G.A., Hickey D.A., Hickey D.A. Mutational bias affects protein evolution in flowering plants. Mol. Biol. Evol. 2004a;21:90–96. doi: 10.1093/molbev/msh003. [DOI] [PubMed] [Google Scholar]
- Wang J.P., Lindsay B.G., Leebens-Mack J., Cui L., Wall K., Miller W.C., dePamphilis C.W., Lindsay B.G., Leebens-Mack J., Cui L., Wall K., Miller W.C., dePamphilis C.W., Leebens-Mack J., Cui L., Wall K., Miller W.C., dePamphilis C.W., Cui L., Wall K., Miller W.C., dePamphilis C.W., Wall K., Miller W.C., dePamphilis C.W., Miller W.C., dePamphilis C.W., dePamphilis C.W. EST clustering error evaluation and correction. Bioinformatics. 2004b;20:2973–2984. doi: 10.1093/bioinformatics/bth342. [DOI] [PubMed] [Google Scholar]
- Wang W., Tanurdzic M., Luo M., Sisneros N., Kim H.R., Weng J.K., Kudrna D., Mueller C., Arumuganathan K., Carlson J., Tanurdzic M., Luo M., Sisneros N., Kim H.R., Weng J.K., Kudrna D., Mueller C., Arumuganathan K., Carlson J., Luo M., Sisneros N., Kim H.R., Weng J.K., Kudrna D., Mueller C., Arumuganathan K., Carlson J., Sisneros N., Kim H.R., Weng J.K., Kudrna D., Mueller C., Arumuganathan K., Carlson J., Kim H.R., Weng J.K., Kudrna D., Mueller C., Arumuganathan K., Carlson J., Weng J.K., Kudrna D., Mueller C., Arumuganathan K., Carlson J., Kudrna D., Mueller C., Arumuganathan K., Carlson J., Mueller C., Arumuganathan K., Carlson J., Arumuganathan K., Carlson J., Carlson J., et al. Construction of a bacterial artificial chromosome library from the spikemoss Selaginella moellendorffii: A new resource for plant comparative genomics. BMC Plant Biol. 2005;5:10. doi: 10.1186/1471-2229-5-10. [DOI] [PMC free article] [PubMed] [Google Scholar]
- Wolfe K.H., Shields D.C., Shields D.C. Molecular evidence for an ancient duplication of the entire yeast genome. Nature. 1997;387:708–713. doi: 10.1038/42711. [DOI] [PubMed] [Google Scholar]
- Wolfe K.H., Li W.H., Sharp P.M., Li W.H., Sharp P.M., Sharp P.M. Rates of nucleotide substitution vary greatly among plant mitochondrial, chloroplast, and nuclear DNAs. Proc. Natl. Acad. Sci. 1987;84:9054–9058. doi: 10.1073/pnas.84.24.9054. [DOI] [PMC free article] [PubMed] [Google Scholar]
- Yang Z. PAML: A program package for phylogenetic analysis by maximum likelihood. Comput. Appl. Biosci. 1997;13:555–556. doi: 10.1093/bioinformatics/13.5.555. [DOI] [PubMed] [Google Scholar]
- Yang Z., Nielsen R., Nielsen R. Estimating synonymous and nonsynonymous substitution rates under realistic evolutionary models. Mol. Biol. Evol. 2000;17:32–43. doi: 10.1093/oxfordjournals.molbev.a026236. [DOI] [PubMed] [Google Scholar]
- Yu J.J., Wang W., Lin S., Li H., Li J., Zhou P., Ni W., Dong S., Hu C., Zeng J., Wang W., Lin S., Li H., Li J., Zhou P., Ni W., Dong S., Hu C., Zeng J., Lin S., Li H., Li J., Zhou P., Ni W., Dong S., Hu C., Zeng J., Li H., Li J., Zhou P., Ni W., Dong S., Hu C., Zeng J., Li J., Zhou P., Ni W., Dong S., Hu C., Zeng J., Zhou P., Ni W., Dong S., Hu C., Zeng J., Ni W., Dong S., Hu C., Zeng J., Dong S., Hu C., Zeng J., Hu C., Zeng J., Zeng J., et al. The genomes of Oryza sativa: A history of duplications. PLoS Biol. 2005;3:e38. doi: 10.1371/journal.pbio.0030038. [DOI] [PMC free article] [PubMed] [Google Scholar]
- Zahn L.M., Kong H., Leebens-Mack J.H., Kim S., Soltis P.S., Landherr L.L., Soltis D.E., dePamphilis C.W., Ma H., Kong H., Leebens-Mack J.H., Kim S., Soltis P.S., Landherr L.L., Soltis D.E., dePamphilis C.W., Ma H., Leebens-Mack J.H., Kim S., Soltis P.S., Landherr L.L., Soltis D.E., dePamphilis C.W., Ma H., Kim S., Soltis P.S., Landherr L.L., Soltis D.E., dePamphilis C.W., Ma H., Soltis P.S., Landherr L.L., Soltis D.E., dePamphilis C.W., Ma H., Landherr L.L., Soltis D.E., dePamphilis C.W., Ma H., Soltis D.E., dePamphilis C.W., Ma H., dePamphilis C.W., Ma H., Ma H. The evolution of the SEPALLATA subfamily of MADS-box genes: A preangiosperm origin with multiple duplications throughout angiosperm history. Genetics. 2005a;169:2209–2223. doi: 10.1534/genetics.104.037770. [DOI] [PMC free article] [PubMed] [Google Scholar]
- Zahn L.M., Leebens-Mack J., dePamphilis C.W., Ma H., Theissen G., Leebens-Mack J., dePamphilis C.W., Ma H., Theissen G., dePamphilis C.W., Ma H., Theissen G., Ma H., Theissen G., Theissen G. To B or Not to B a flower: The role of DEFICIENS and GLOBOSA orthologs in the evolution of the angiosperms. J. Hered. 2005b;96:225–240. doi: 10.1093/jhered/esi033. [DOI] [PubMed] [Google Scholar]
- Zanis M.J., Soltis D.E., Soltis P.S., Mathews S., Donoghue M.J., Soltis D.E., Soltis P.S., Mathews S., Donoghue M.J., Soltis P.S., Mathews S., Donoghue M.J., Mathews S., Donoghue M.J., Donoghue M.J. The root of the angiosperms revisited. Proc. Natl. Acad. Sci. 2002;99:6848–6853. doi: 10.1073/pnas.092136399. [DOI] [PMC free article] [PubMed] [Google Scholar]
- Zhang J., Rosenberg H.F., Nei M., Rosenberg H.F., Nei M., Nei M. Positive Darwinian selection after gene duplication in primate ribonuclease genes. Proc. Natl. Acad. Sci. 1998;95:3708–3713. doi: 10.1073/pnas.95.7.3708. [DOI] [PMC free article] [PubMed] [Google Scholar]