

Abstract
Recently, we introduced a phototransduction model that was able to account for the reproducibility of vertebrate rod single-photon responses (SPRs) (Hamer et al., 2003). The model was able to reproduce SPR statistics by means of stochastic activation and inactivation of rhodopsin (R*), transducin (Gα), and phosphodiesterase (PDE). The features needed to capture the SPR statistics were (1) multiple steps of R* inactivation by means of multiple phosphorylations (followed by arrestin capping) and (2) phosphorylation dependence of the affinity between R* and the three molecules competing to bind with R* (Gα, arrestin, and rhodopsin kinase). The model was also able to account for several other rod response features in the dim-flash regime, including SPRs obtained from rods in which various elements of the cascade have been genetically disabled or disrupted. However, the model was not tested under high light-level conditions. We sought to evaluate the extent to which the multiple phosphorylation model could simultaneously account for single-photon response behavior, as well as responses to high light levels causing complete response saturation and/or significant light adaptation (LA). To date no single model, with one set of parameters, has been able to do this. Dim-flash responses and statistics were simulated using a hybrid stochastic/deterministic model and Monte-Carlo methods as in Hamer et al. (2003). A dark-adapted flash series, and stimulus paradigms from the literature eliciting various degrees of light adaptation (LA), were simulated using a full differential equation version of the model that included the addition of Ca2+-feedback onto rhodopsin kinase via recoverin. With this model, using a single set of parameters, we attempted to account for (1) SPR waveforms and statistics (as in Hamer et al., 2003); (2) a full dark-adapted flash-response series, from dim flash to saturating, bright flash levels, from a toad rod; (3) steady-state LA responses, including LA circulating current (as in Koutalos et al., 1995) and LA flash sensitivity measured in rods from four species; (4) step responses from newt rods (Forti et al., 1989) over a large dynamic range; (5) dynamic LA responses, such as the step-flash paradigm of Fain et al. (1989), and the two-flash paradigm of Murnick and Lamb (1996); and (6) the salient response features from four knockout rod preparations. The model was able to meet this stringent test, accounting for almost all the salient qualitative, and many quantitative features, of the responses across this broad array of stimulus conditions, including SPR reproducibility. The model promises to be useful in testing hypotheses regarding both normal and abnormal photoreceptor function, and is a good starting point for development of a full-range model of cone phototransduction. Informative limitations of the model are also discussed.
Keywords: Full-range phototransduction model, Single-photon reproducibility, Stochastic simulation, Light adaptation, Phototransduction, Rod responses
Introduction
The molecular events underlying the transduction of light energy into an electrical response in vertebrate rods constitute one of the most well-understood biochemical sequences in all of neuroscience. The phototransduction cascade is known in sufficient detail that one can form a computational model of the component biochemical reactions that can reproduce many quantitative features of empirical rod responses (e.g. Forti et al., 1989; Tamura et al., 1991; Lamb & Pugh, 1992; Nikonov et al., 1998; Hamer, 2000a,b; Hamer et al., 2003). Yet, because the phototransduction cascade contains several nonlinear mechanisms that operate on different time scales, and because some of the key biochemical parameters have still not been established for in vivo conditions, it has been extremely difficult to generate a model that can, using a single set of parameters, account for a broad array of data obtained under the full range of stimulus conditions under which rods have been studied.
One of the most difficult and abiding problems in the history of photoreceptor physiology has been to account for the reproducibility of vertebrate rod single-photon responses (SPRs). Evolution has produced biochemical and biophysical machinery in photoreceptors that can support reliable single-photon detection despite the inherent high variability in all molecular reactions. This ability is a ubiquitous and defining feature of the vertebrate rod visual system (Rodieck, 1998; Pugh, 1999).
The remarkable stereotypy of vertebrate rod SPRs was first documented by Baylor et al. (1979), and a full explanation of this reproducibility, in terms of the underlying molecular machinery, has eluded a generation of physiologists and biochemists. R.W. Rodieck was clearly captivated by photoreceptor physiology, and devoted an enormous amount of attention to phototransduction, including consideration of the significance of SPR reproducibility. In his erudite and impressively detailed textbook “The First Steps of Seeing” (1998, p. 382) he says, “The fact that a single molecular change becomes a reliable response at the cellular level is perhaps the most remarkable feature of the entire phototransduction process.”
The core of the problem posed by SPR reproducibility is that, if R* were to inactivate in a single memoryless step with first-order kinetics, its lifetime would be highly variable, exhibiting an approximately exponential distribution with a coefficient of variation (CV = S.D./mean) of unity. In the absence of other variability reducing mechanisms, this highly variable R* lifetime would perforce be reflected, to one degree or another, in the variability of the SPR amplitude and/or kinetics. Yet, empirically, rod single-photon responses are substantially less variable than predicted from a pure single-step inactivation mechanism (Baylor et al., 1979; Schnapf, 1983; Schneeweis & Schnapf, 1995; Rieke & Baylor, 1998a,b; Whitlock & Lamb, 1999; Field & Rieke, 2002; Hamer et al., 2003). Thus, the relative reproducibility of single-photon responses, despite the inherent variability of the underlying individual biochemical reactions, must place strong constraints on any model of phototransduction.
Over the past decade, several models have been proposed to account for SPR reproducibility (Rieke & Baylor, 1998a,b; Whitlock & Lamb, 1999; Field & Rieke, 2002; Hamer et al., 2003). Recently, we have been able to synthesize the results from photoreceptor biochemistry and physiology to formulate a model that appears to account fully for observed SPR reproducibility. The model also accounted for a broad array of rod data in the dim-flash regime, including the salient qualitative features of responses from rods with various phototransduction components genetically deleted or modified.
In the present study, we have sought to elaborate the model introduced in Hamer et al. (2003) in order to determine its breadth of application. Specifically, if the model could account for single-photon response features, but failed to reproduce realistic responses in the high light regime, including light adaptation (LA), the model would have to be modified in a fundamental way. Toward this end, we adjusted the model in an attempt to account for six important classes of rod data: (1) SPR waveforms and statistics (as in Hamer et al., 2003), including SPR reproducibility; (2) a full dark-adapted flash-response series (obtained in the present study), from dim-flash to saturating, bright flash levels, obtained from a toad rod; (3) steady-state LA responses, including LA circulating current (as in Koutalos et al., 1995) and LA flash sensitivity measured in rods from four species; (4) step responses from newt rods (Forti et al., 1989) over a large dynamic range; (5) dynamic LA responses, such as the step-flash paradigm of Fain et al. (1989), and the two-flash paradigm of Murnick and Lamb (1996); and (6) the salient response features from four knockout (KO) rod preparations.
Our approach was to attempt to reproduce characteristic, signature features of rod responses that spanned a large portion of the rod's dynamic range, from single-photon levels to the bright-flash regime and light-adapted responses. Since the breadth of data needed to test the model was not available from a single physiological preparation, our approach was to choose representative, high-quality data from various rod experiments across a number of species. All in all, the data simulated spanned 14 studies from six species. Under these circumstances, rather than try to match all the kinetic features from all the data sets, we focused on the aspects of the various data sets that could be informative regarding underlying biochemical mechanisms.
Attempting to account for all these disparate data with a single model, using a single set of parameters, provided strong constraints on the model, and ensured that it's applicability was not restricted to only one class of data, or to only a limited dynamic range of the rod's response repertoire.
The new unified model was able to capture many signature qualitative and quantitative features of rod responses obtained from this broad array of rod data over a large dynamic range (5 orders of magnitude). In the course of this work, we discovered that some parameters were especially constraining in attempting to bridge the gap between the single-photon regime and the high-intensity regime. These results suggested unanticipated tradeoffs between the mechanisms capable of supporting single-photon response reliability and those compatible with robust light-adaptation ability in the cell.
Finally, the model fails to capture some key data that promise to provide important clues for future model development.
Materials and methods
The present model is based on the multiple phosphorylation model presented in Hamer et al. (2003). For simulation of high-intensity responses, the present model has added dynamic feedback regulation of R* inactivation (phosphorylation of R*) via Ca2+-dependent modulation of rhodopsin kinase (RK) concentration. The features of the Hamer et al. model that allowed it to account for reproducibility of the rod SPR are preserved here. These are based on known and/or testable biochemistry, which was reviewed in detail in Hamer et al. (2003). Namely, SPR reproducibility is achieved through a series of RK-mediated phosphorylations of R* (Ohguro et al., 1993, 1994, 1995, 1996), that serve to ratchet down the catalytic activity of R*, via modulation of the affinities of G-protein (G·GDP), RK, and arrestin (Arr) for R* (Wilden, 1995; Gibson et al., 2000), and competitive, mutually exclusive binding of R* between these three molecules (Miller & Dratz, 1984; Krupnick et al., 1997; Pfister et al., 1983; Buczylko et al., 1991; Pulvermuller et al., 1993; Gibson et al., 2000). In vitro biochemical studies indicate as many as nine phosphorylation sites available (e.g. Wilden, 1995), with seven of these occurring on the carboxy terminus of bovine rhodopsin (Wilden & Kühn, 1982; Kühn & Wilden, 1982; Aton et al., 1984; Thompson & Findlay, 1984; Palczewski et al., 1991; Wilden, 1995). Although there are well-known technical difficulties in determining sufficiently quickly the number and identity of the rhodopsin sites phosphorylated under dim-flash conditions in vivo, evidence for as many as three or four phosphorylation sites has been found in vivo (Kennedy et al., 2001). Moreover, Mendez et al.'s (2000) in vivo study (in which up to six phosphorylation sites were selectively disabled in transgenic mouse rods), showed that the presence of all the native phosphorylation sites in mouse rod rhodopsin is important for normal response kinetics.
In this scheme, a free activated rhodopsin has three functional reaction pathways: (1) transducin activation, following G·GDP binding, (2) phosphorylation, following RK binding, and (3) final quench, following Arr binding. These are depicted schematically in Figs. 1a and 1b. The chemical and computational equations corresponding to these reactions are given in the Appendix [eqns. (A1–A7)], and the relevant parameter values are given in Table 1.
Fig. 1.
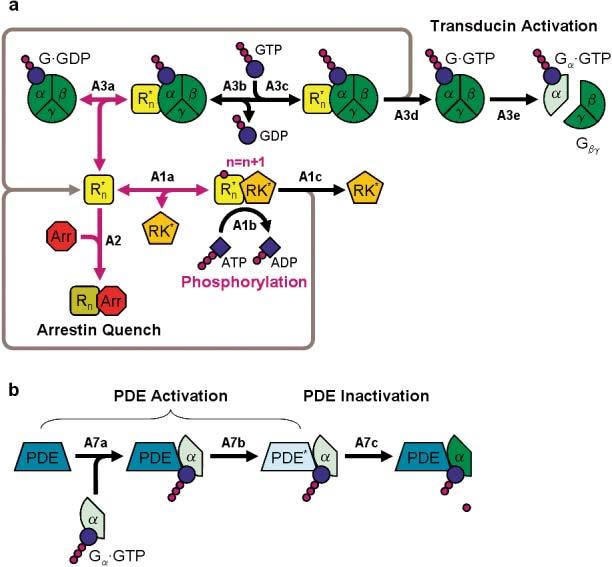
(a) Model of “front-end” reaction [eqs. (A1–A6)]. Model showing the activation and inactivation of R* and G*, as well as the competition between Arr, G and RK for , where n (0 ≤ n ≤ 7) is the number of times R* has been phosphorylated at any given point in time. Three mutually exclusive pathways for are depicted: (1) R* inactivation by Arr-capping, the probability of which increases with n (Gibson et al., 2000); (2) phosphorylation of R* by RK, the probability of which is assumed to decrease with n; or (3) activation of G-protein, the probability of which decreases with n (Gibson et al., 2000). The gray arrows indicate the “return” pathways for R*, i.e., when it is released from G-protein or RK. Phosphorylation-dependent reactions are indicated by purple arrows. (b) Activation and inactivation of PDE [eqn. (A7)]. Activated transducin (Gα·GTP) binds to the PDEγ subunit [eqn. (A7a)]. Inhibition by the PDEγ subunit is then relieved [eqn. (A7b)], yielding activated transducin-PDE* complex. For simplicity, inactivation of PDE* is assumed to occur in a single step [eqn. (A7c); see text for details].
Table 1.
Parameters of the unified rod model
| Parameter | Value | Ref. | Equations | Description |
|---|---|---|---|---|
| nmax | 7 | t | A6 | Maximum number of phosphates bound to activated rhodopsin |
| ω | 0.6 | s | A4, A6 | Exponential rate of decay of transducin and RK affinities for R* as a function of phosphorylation state |
| Rtot | 3.6e9 | k | A17 | Total number of rhodopsin molecules |
| kG1(0)Gtot | 10,000 s−1 | a | A3a, A4, A16, A21 | Rate of binding G·GDP to unphosphorylated R* in the dark |
| Gtot | 3.6e8 | b | A16, A21 | Total number of transducin molecules |
| kG2 | 2000 s−1 | a | A3a, A16, A21 | Rate constant of dissociation of R* from R*•G·GTP |
| kG3 | 2000 s−1 | a | A3b, A21, A22 | Rate constant of dissociation of GDP from R*•G·GDP |
| kG4 [GDP] | 600 s−1 | a | A3b, A21, A22 | Rate of binding GDP to R*•G |
| kG5 [GTP] | 750 s−1 | a | A3c, A22, A23 | Rate of binding GTP to R*•G |
| kG6 | 2000 s−1 | a | A3d, A16, A23, A24 | Rate constant of dissociation of R* from R*•G·GTP |
| kG7 | 200 s−1 | a | A3e, A24, A25 | Rate constant of dissociation of G·GTP into Gα·GTP and Gβγ |
| kRK1(0) [RK]dark | 100 s−1 | a | A1a, A6, A16, A19, A28 | Rate of binding RK to unphosphorylated R* in the dark |
| kRK2 | 250 s−1 | a | A1a, A16, A19, A28 | Rate constant of dissociation of R* from R*•RK prior to phosphorylation |
| kRK3 [ATP] | 400 s−1 | a | A1b, A19, A20 | Rate of binding ATP to R*•RK |
| kRK4 | 20 s−1 | a | A1c, A16, A20, A28 | Rate constant of dissociation of R* from R*•RK following phosphorylation |
| kA(1) Arrtot | 0.25 s−1 | a | A2, A5, A16, A18 | Rate of binding Arr to R* in the dark |
| Arrtot | 3.13e7 | r | A16, A18 | Total number of arrestin molecules |
| kP1 PDEtot | 200 s−1 | A7a, A25, A26 | Rate of binding PDE to Gα·GTP | |
| PDEtot | 2.67e7 | b | A25, A26 | Total number of PDE molecules |
| kP2 | 200 s−1 | A7b, A26, A27 | Rate constant of removal of inhibition from the γ subunit of PDE*•GαGTP | |
| τPDE | 2 s | c | A7c, A27 | Time constant of inactivation of PDE*•GαGTP |
| kon | 10,000 s−1 | d | Rate constant of spontaneous PDE* activation | |
| koff | 0.45 s−1 | d | Rate constant of inactivation of spontaneously activated PDE* | |
| βdark | 1.2 s−1 | e | A8, A11 | Dark rate of cGMP hydrolysis |
| βsub | 0.00043 s−1 | f | A8, A11 | Rate constant for a catalytic PDE subunit in a well-stirred volume, vctyo |
| αmax | 117.13 μM s−1 | g | A8 | Maximal rate of cGMP synthesis |
| Kc | 0.17 μM | e | A8 | Ca2+ concentration at which cGMP synthesis is half of αmax |
| m | 2.5 | h | A8 | Hill coefficient for the action of Ca2+ on cyclase rate |
| gdark | 4 μM | i | A9, A12 | Dark cGMP concentration |
| ncg | 3 | e | A9, A12 | Hill coefficient for opening the cGMP-gated channels |
| Jdark | 29.7778 pA | A9, A12 | Dark circulating current | |
| fCa | 0.2 | j | A9, A12 | Fraction of circulating current carried by Ca2+ |
| vcyto | 1 pL | k | A9, A15, A28 | Cytoplasmic volume |
| F | 96485 cm−1 | A9 | Faraday constant | |
| cdark | 0.6 μM | l | A12 | Dark Ca2+ concentration |
| c0 | 0.01 μM | m | A9, A12 | The minimum intracellular Ca2+ concentration |
| γCa | 47.5539 s−1 | g | A9 | Rate constant of Ca2+ extrusion by the Na+/Ca2+-K+ exchanger |
| k1 | 0.5 μM−1 s−1 | n | A10 | Rate constant of binding Ca2+ to buffers |
| k2 | 2.5 s−1 | n | A10 | Rate constant of dissociation of Ca2+ from buffers |
| eT | 400 μM | n | A10 | Total Ca2+ buffer concentration |
| Kp | 0.4 μM | o | A15 | Ca2+ concentration causing half maximal inhibition of recoverin |
| w | 2 | p | A15 | Hill coefficient for the action of Ca2+ on recoverin |
| Rectot | 35 μM | q | A15 | Total recoverin concentration |
| RKtot | 7 μM | o | A15, A28 | Total RK concentration |
| kRec3 | 10 μM−1 s−1 | A14, A28 | Rate constant of binding RK to Rec•wCa2+ | |
| kRec4 | 0.5 s−1 | A14, A28 | Rate constant of dissociation of RK from Rec•wCa2+ − RK |
Front-end parameters: The parameters for eqns. (A1-A6) are not known. Thus, all the kG, kRK and kA parameters were varied from Hamer et al. (2003) so as to capture the bright-flash and light-adapted rod behavior while preserving SPR reproducibility as much as possible. In addition, the front-end parameters collectively yielded an overall rate of G* production per R* (∼250 s−1) that was reasonably close to Leskov et al. (∼150 s−1; 2000).
PDEtot: Pugh & Lamb (1993, 2000).
τPDE: to match the slope of the Tsat vs. ln(I) function for the toad rod flash series in the present study (Fig. 4).
kon , koff: These were derived from Rieke & Baylor (1996). In order to generate the correct noise spectrum, koff had to be set to 4 times lower than the value derived from Rieke & Baylor.
βdark , Kc, ncg: The literature on these parameters is summarized in detail in Hamer (2000a).
βsub: Leskov et al. (2000).
αmax and γca are not determined independently, but derived from the dark steady-states of eqns. (A8-A9) by αmax = βdark gdark [1 + (cdark/Kc)m], and γCa = 106fCa Jdark/[(2 + fCa)].
gdark: Pugh & Lamb (1990, 2000), Nikonov et al. (2000).
fca: Ohyama et al. (2000).
vcyto, Rtot: Pugh & Lamb (2000).
k1, k2, eT: Similar to values used in the simulations of Table 3, Hamer (2000a); also see Forti et al. (1989).
Kp, RKtot: Klenchin et al. (1995).
Rectot: Kawamura (1993), Ames et al. (1997).
Arrtot: Hamm & Bownds (1986); Pugh & Lamb, 1990. More recent measures (Granzin et al., 1998; Hirsch et al., 1999; Pugh & Lamb, 2000) are ∼1 order of magnitude higher. However, this has negligible effect on our present simulations.
ω: Gibson et al. (2000). From fitting an exponential to their Fig. 2A.
nmax: Wilden & Kühn, 1982; Kühn & Wilden, 1982; Aton et al., 1984; Thompson & Findlay, 1984; Palczewski et al., 1991; Wilden, 1995; Mendez et al., 2000; Kennedy et al., 2001.
Also see Hamer et al.l (2003) for a review.
The “back-end” model
We define the back-end model as reactions downstream to PDE* leading to the photocurrent response represented by the system of differential equations shown in eqns. (A8-A10). Due to the amplification between R* and active transducin, it is reasonable to treat the back-end signals as continuous rather than discrete signals, even for flashes eliciting a single photoisomerization. The back-end reactions are hydrolysis of cGMP by PDE* and Ca2+-sensitive synthesis of cGMP [eqn. (A8)]; Ca2+ influx through cGMP-gated membrane cation channels (CNG channels), and Ca2+ efflux via the Na+/Ca2+-K+ exchanger [eqn. (A9)]; sequestration and release of Ca2+ by intracellular buffers [eqn. (A10)]; and generation of photocurrent upon closure of CNG channels [eqn. (A12)]. The time-varying states of the back-end model are PDE*, g ([cGMP]), c (free intracellular [Ca2+]), and cb (intracellular [Ca2+] bound to buffers), all in μM, and J (photocurrent) in pA.
The other parameters in these equations are described in the Appendix and their values are given in Table 1.
Addition of recoverin-RK feedback onto R* phosphorylation rate
Recoverin (Rec) was assumed to interact with calcium in a cooperative manner [Kawamura, 1993; Ames et al., 1995; Klenchin et al., 1995; Chen et al., 1995; eqn. (A13)]. The calcium-bound form of Rec is able to bind with RK (Gorodovikova & Philippov, 1993; Chen et al., 1995; Klenchin et al., 1995), rendering the kinase unable to bind with rhodopsin, thus providing a pathway for calcium feedback onto the rate of R* inactivation. The decline in internal free Ca2+ upon closure of the CNG channels in response to light causes Rec to dissociate from RK, releasing RK in its active state [eqn. (A14)].
In our implementation, we assume that Rec equilibrates with changes in calcium at a rate that is fast in comparison with the time-scale of the photoresponse [depicted in eqn. (A15)].
Simulation of responses in the dim-flash regime: A hybrid stochastic/deterministic model
To evaluate variability in the single-photon response, we used a probabilistic model of the front-end of the transduction cascade (Hamer et al., 2003), under the assumption that RK remained constant at its dark value during the dim-flash response, that is, there is no active Ca2+-feedback pathway onto R* inactivation in the dim-flash regime. Using the full differential-equation version of the model (see below), which included explicit Ca2+ feedback onto Rec/RK, we verified that this feedback had negligible effect on the simulated dim-flash responses.
This assumption is also consistent with our prior simulations (Hamer et al., 2003), as well as with direct evidence from rods in which guanylate cyclase activating proteins had been genetically knocked out (GCAPs−/−; Burns et al., 2002). These data implied that Ca2+-feedback via recoverin and RK onto R* phosphorylation rate does not significantly affect the dim-flash response, though it does affect responses at high intensities.
Dim-flash response ensembles were generated by Monte-Carlo simulation of the front-end biochemistry (reactions depicted in Fig. 1), as in Hamer et al. (2003), using the Gillespie method (Gillespie, 1976, 1977; Felber et al., 1996). The probability that a takes a particular reaction pathway is given by the reaction rate constant for entering that pathway divided by the sum of rates of all available pathways. The dwell time in each state is an exponentially distributed random variable with a mean given by the inverse sum of reaction rates for the possible pathways.
To simulate dim-flash response data we generate a series of PDE* responses to Poisson numbers of photoisomerizations, assuming linear combination of PDE* responses to multiple photon absorptions. The stochastic PDE* response is transformed to photocurrent through the deterministic back-end of the model [eqns. (A8-A12)].
Simulation of recording and photoreceptor noise
In Hamer et al. (2003), we simulated recording and photoreceptor noise as a single additive noise to be summed with the simulated photocurrent waveform, as in Whitlock and Lamb (1999). However, for the present study, we chose to implement the photoreceptor component of the noise explicitly. This provides an additional constraint on the model by allowing us to evaluate the effects of genetic manipulations on photoreceptor noise. Different genetic manipulations may be expected to affect overall photoreceptor noise differently, since they impact reactions at loci either preceding or following the presumed locus of the continuous component of the noise, that is, spontaneous PDE activation and inactivation (Rieke & Baylor, 1996).
The continuous component of photoreceptor noise was added stochastically to the PDE signal using estimates of spontaneous PDE activation and inactivation rates similar to those in Rieke and Baylor (1996); and (Rieke & Baylor, 1998a) the salient response features from four knockout (KO) rod preparations. PDE noise was generated from a uniform random distribution of thermal PDE activation times (ton) over an epoch t = [0, tmax] where the number of activations during this time was a Poisson random number from a distribution with mean kontmax. This results in an exponential distribution of interactivation intervals with mean . The random shutoff times (toff) were generated by adding to each ton, random PDE lifetimes chosen from an exponential distribution with mean . The number of thermally active PDE at any time t is obtained by summing the number of ton events minus the number of toff events in the interval [0, t]. The values for kon and koff are given in Table 1.
Recording noise was then added linearly to the final photocurrent response as in Whitlock and Lamb (1999). Finally, a 2.5-Hz digital low-pass filter was applied to the responses (Whitlock & Lamb, 1999).
Simulation of responses in the high-intensity regime
To simulate responses to stimuli beyond the dim-flash regime, a full differential-equation representation of front-end eqns. (A1–A7) was used, in combination with back-end eqns. (A8-A12). The resulting set of equations used in this regime are given in the Appendix [eqns. (A16-A28)].
Simulation of other conditions
To simulate alternate conditions, including effects of genetic modification of reactions in the cascade, we made the following modifications to the model. Apart from the changes explicitly listed, all other parameters were unaltered. In each case, the mean number of photoisomerizations was 0.65, and noise was added as described above.
Simulation of genetic alterations of the cascade
The simulated KO responses shown in Fig. 10 were generated using the means of ten model SPRs in order to approximate the number of responses averaged in typical experimental studies, so that the signal-to-noise ratio would be comparable to the data. These simulations represent the toad rod predictions for the genetic manipulations used in the four studies on mouse rods.
Fig. 10.
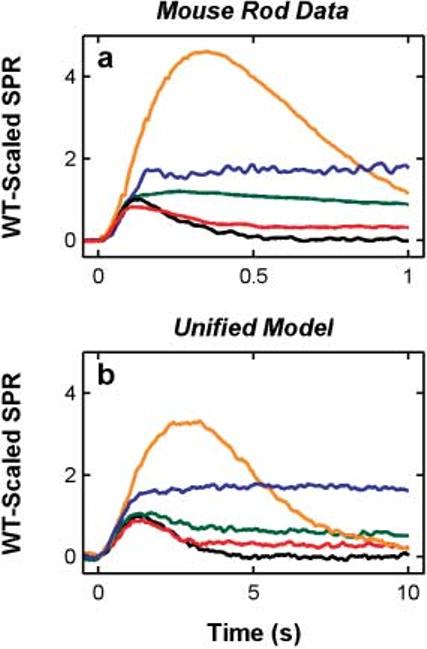
The unified model reproduces the salient features of rod responses from four KO preparations. a. Single-photon responses from four KO mouse rods—red: Arr−/− (Xu et al., 1997); green: RGS9−/− (Chen et al., 2000); blue: RK−/− (Chen et al., 1999); orange: GCAPs−/− (Burns et al., 2002). The black curve represents the WT mouse rod response, and was taken from Chen et al. (1999), and then scaled to peak at 1.0. All the KO SPRs were scaled to maintain their correct amplitudes relative to the WT responses for each study. b. Simulation of the KO conditions in a using the same unified model that generated the simulations shown in Figs. 2-9. Apart from implementation of the KO condition (as described in Materials and methods), no other parameters were adjusted in the model. These simulations represent the predicted outcome of applying the four KO conditions to toad rods.
RK−/− responses (Chen et al., 1999). The rate constant governing binding of RK to R* [kRK1(n), eqn. (A1a)] was set to zero for all n to simulate the absence of RK.
Arr−/− responses (Xu et al., 1997). The rate constant for the binding of Arr to R* [kA(n), eqn. (A2)] was set to zero for all n to simulate the absence of arrestin.
RGS9−/− responses (Chen et al., 2000). The time constant governing PDE*-inactivation [τPDE in eqn. (A7c)] was increased by a factor of 10 (Chen et al., 2000; Krispel et al., 2003; Martemyanov et al., 2003; Keresztes et al., 2004).
GCAPs−/− responses (Burns et al., 2002). Burns et al. (2002) found that mean dark current did not differ between wild-type (WT) and GCAPs−/− rods, leading them to suggest that Ca2+ feedback to cyclase does not set the dark cGMP concentration, and that “the differences between GCAPs−/− and wild-type responses arise solely from opening the feedback loop that normally controls GC activity.” We therefore simulated GCAPs−/− by simply removing feedback onto cGMP synthesis, by setting m equal to zero, and αmax = 2βd gDark in eqn. (A8). This simple approach selectively disabled Ca2+ feedback onto cyclase and kept the simulated WT and GCAPs−/− dark currents equal.
The model does not have any other process, such as thermal decay of R* (Ebrey, 1968; Cone & Cobbs, 1969; see Xu et al., 1997) or other forms of arrestin (e.g. see Mendez et al., 2000; Schroder et al., 2002), by which to quench R* activity. Thus, RK−/− and Arr−/− responses generated by the model in its present form do not shut off. These alternative slow mechanisms for R* inactivation will be examined in future research.
Altered levels of ATP and GTP
To simulate the ATP and GTP manipulations used to generate the data in Rieke and Baylor's (1998a, Fig. 14), we scaled the parameters kRK3[ATP] and kG5[GTP] shown in Table 1 by 0.04 and 0.4, respectively, the same factors used in Rieke and Baylor [see eqns. (A1b) & (A3c)].
Calcium clamping
Ca2+ clamp was simulated by fixing calcium at its dark value, as described in the Appendix [see eqn. (A11)].
Analysis of dim-flash data
As in Hamer et al. (2003), we analyzed the dim-flash responses (N = 350) from the raw data used in Whitlock and Lamb (1999). Simulated dim-flash responses (right column of panels, Fig. 2) were analyzed using the same methods as applied to the data (left column of panels, Fig. 2).
Fig. 2.
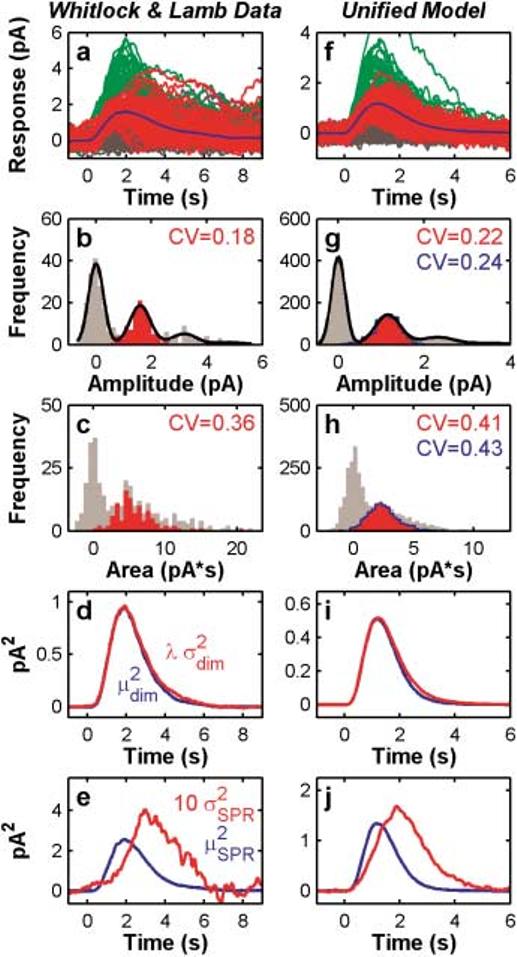
The unified model captures the waveforms and statistics of dim-flash responses including high SPR reproducibility. The left column (panels a–e) show analyses of dim-flash data from Whitlock and Lamb (1999). These same analyses repeated on simulated dim flashes from the unified model are shown in the right-hand column (panels f–j). a, f: Response waveforms color coded by identification from the amplitude histograms as either failures (gray), SPRs (red) or MPRs (green), as described in Materials and methods. The solid blue curve is the mean SPR. b, g: Histograms of response amplitudes. The solid black curve shows a sum-of-Gaussians fit to the amplitude distributions, yielding estimates of the noise variance, as well as σ and μ of the presumed unit response. These parameters were then used to statistically categorize responses shown in a and f. The CV for SPR amplitudes identified in this manner (red overlay in histogram) was 0.18 for the data, and 0.22 for the model. The blue line in panel g shows the amplitude distribution of perfectly identified SPRs from the model. The CV of these amplitudes (without noise) was 0.24, close to the CV for statistically identified SPRs. This validates our statistical response categorization approach. c, h: Histograms of response areas. The subset of SPRs identified from the amplitude histograms are shown in red overlay. The blue line in panel h shows the distribution of ‘true’ SPR areas from the model. d, i: Comparison between the light-evoked ensemble variance increase, and the square of the ensemble mean dim-flash response. The variance increase was calculated by subtraction of the variance of the failures from the variance of all responses. Variance was scaled by a factor of λ = 0.53 (data) and λ = 0.64 (model) to match the mean squared. e, j: The time-dependent residual variance of SPRs () and the square of the mean SPR. The SPR variance is approximately an order of magnitude smaller than the square of the mean response, peaks later than the mean, and is broader (Field & Rieke, 2002).
We applied the same zeroing and data-selection methods as in Hamer et al. (2003). SPRs were identified from analysis of the histogram of dim-flash response amplitudes. Amplitude was defined as the scaling factor providing the best (least-squares) fit of the normalized ensemble mean response to each individual response between the time of the stimulus and the time to peak of the ensemble mean response (Field & Rieke, 2002).
A sum-of-Gaussians model (del Castillo & Katz, 1954; Baylor et al., 1979) was fit to the histogram, yielding estimates of the mean number of photon absorptions, mean SPR amplitude, SPR amplitude variance, and additive background noise variance, for the underlying distribution. From these parameters, we analytically determined three probabilities for each response amplitude, that is, the probability of being the result of either zero, one, or more than one photoisomerization. The responses falling within each bin of the amplitude histogram were then randomly categorized as either failures, SPRs, or multiphoton responses (MPRs) in accordance with their expected relative frequencies for that amplitude bin (based on the probabilities derived from the sum-of-Gaussians parameters). Extensive simulation showed that this approach was superior to that used in Hamer et al. (2003), in that it provided a better estimate of the true CV for SPR area, with only a small sacrifice in the sensitivity and positive predictive value of identification of SPRs (these were still ≥ 95% in our simulations, close to the values in Hamer et al., 2003).
Isolation of SPR variance
To separate variability due to background noise from stochastic variability in the actual underlying response to photon absorption, we subtracted the variance of responses classified as failures from the variance of those classified as SPRs. In any subsequent discussion of SPR variability, this correction was implied. This technique was used in the CV calculations for SPR amplitude and SPR area, as well as in the time-varying variance waveforms presented in Fig. 2.
SPR area
We showed in Hamer et al. (2003), by both numerical and theoretical analysis, that the CV of SPR area provides a valid measure of the underlying variability of integrated R* activity. For each failure and SPR (identified by the method just described), we integrated the response from time zero until the end of the recording epoch. CVarea was calculated as the square root of the variance difference between SPRs and failure areas, divided by the mean SPR area.
Physiological recordings
The methods and procedures used in collecting Whitlock and Lamb's original electrophysiological data are described in detail in their paper (Whitlock & Lamb, 1999; Lamb et al., 1986).
The full series of flash responses under dark-adapted conditions (Fig. 4a) was recorded from a toad (Bufo marinus) rod in the Cambridge laboratory using standard suction electrode techniques; for details of the methods, see Baylor et al., 1979; Lamb et al., 1981, 1986; and Whitlock & Lamb, 1999. The 500-nm stimulus was presented as a 24-ms flash, ranging in intensity from 1.5 R*/flash to 118,000 R*/flash in roughly octave increments of intensity.
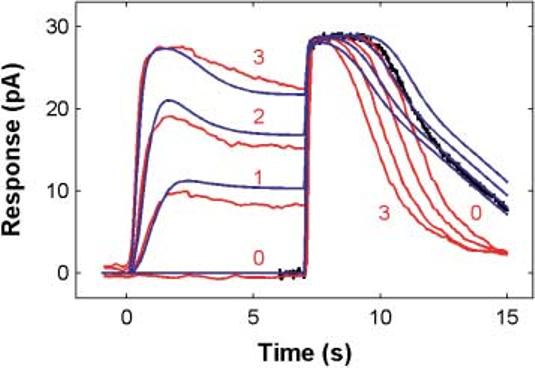
Fig. 4.
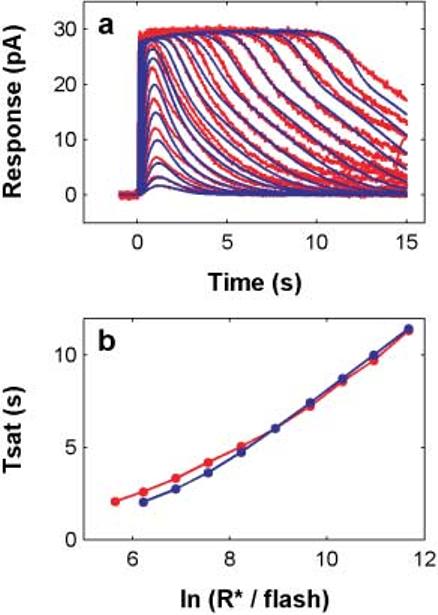
The unified model captures dark-adapted toad rod flash responses over a 5 log unit dynamic range. a. Full flash-response series (red) from a toad rod (suction electrode recordings; 1.5 to 118,000 R*/flash), and the unified model flash responses (blue). b. Tsat vs. ln (I) for both the data and model. Tsat was defined as the time that a saturated response first recovers below a criterion of 90% of complete saturation.
Simulation approach, methodology, and analysis tools
Since the full range of data needed to adequately constrain the model is not available from any single experiment, or even from one species, our approach was a hybrid of quantitative and qualitative analysis of specific aspects of data sets obtained from different laboratories and different species. The data sets chosen for simulation spanned the full gamut of the rod's response repertoire. The signature features we sought to match were those that represented empirical rod behavior, across species if possible, under a given stimulus paradigm. Under these conditions, it was not technically feasible, nor (we would argue) advisable to perform quantitative optimization of the model to such disparate data sets.
Thus, in our simulations, starting from parameters that had been successful in prior simulations of both dim-flash (Hamer et al., 2003) and bright-flash regimes (Hamer, 2000a,b), we adjusted the parameters so as to reproduce realistic response waveforms in all the paradigms, as well as key qualitative features that reflected underlying nonlinearities or multiple linear mechanisms with different kinetics. The target key features are noted in the sections showing the results for each paradigm simulated. In adjusting the model's parameters, we sought to preserve as well as possible the single-photon responses and variability statistics as in Hamer et al. (2003), while capturing the features of the responses in the bright-flash and light-adapting regimes. We did not attempt to reproduce all details of the response kinetics for each paradigm (e.g. the kinetics of recovery in the Fain et al., 1989 paradigm; see Fig. 8).
Fig. 8.
Simulation of Fain et al.'s (1989) step-flash paradigm. Red: Fain et al. (1989) data (salamander rod) scaled to have the same dark current as the unified model. Blue: Unified model responses to the Fain et al. stimulus protocol adjusted for sensitivity differences between the Fain et al. salamander rod and our (toad rod) simulation (model was 6.7 times more sensitive). The black curve is one of the saturated flash responses from the toad rod data set shown in Fig. 4, illustrating the differences between the recovery dynamics for these two rods from different species. As in Fain et al's data, in the simulations, the steps cause Tsat in response to the flash to decrease substantially; model Tsat decreases by 1.9 s, corresponding to an equivalent overall gain decrease of 2.6 times. The gain change calculated for Fain et al.'s data is 2.7 (assuming that their salamander rod had a Tsat slope of 1.6 s/ln unit, as described in the legend to Fig. 10 in Nikonov et al., 2000). See text for details.
The parameters for the model listed in the Appendix and in Table 1 were chosen to be close to empirical biochemical and biophysical values when such data were available. In general, parameters were within a factor of two of their published values (when available), with the exception of parameters occurring as exponents in the reaction equations; these were not permitted to vary, but were held at their empirical values (see ω, m, w, ncg in Table 1). For parameters where explicit empirical estimates were not available, we made educated guesses and set these so as to conform to general constraints. For example, although many of the front-end rate constants are not known, the whole set of rate constants governing the activation of G-protein must be such that the net G-activation rate in the dim-flash regime is consistent with modern estimates of the rate of G-activation per R* (Leskov et al., 2000), and this, indeed, was the case. Additional constraints were imposed by requiring that the model reproduce a whole suite of signature features in empirical rod data. In the case of the front-end parameters, the set of rate constants were adjusted star ting from the values used in Hamer et al. (2003) so as to capture the bright-flash and light-adapted features while degrading the single-photon response reproducibility as little as possible. More details on the choices of parameters are given in the legend to Table 1.
All aspects of the model and analyses were implemented using Matlab/Simulink (The Mathworks, Natick, MA). The code is available upon request (contact first author).
Results
Dim-flash regime
Dim-flash responses, SPR waveforms, and reproducibility statistics
Our model accounts for dim-flash responses and statistics (Fig. 2), as well as dark-adapted toad rod flash responses extending up to saturating, bright flashes causing prolonged photocurrent saturation (Fig. 4; to be discussed below). Fig. 2 shows a side-by-side comparison of our analyses of Whitlock and Lamb's dim-flash data (left column of panels) and the model's simulation of dimflash responses (right column of panels).
The top row of panels in Fig. 2 show that the model generates realistic dim-flash waveforms (compare 2a & 2f). The time-to-peak of the model dim-flash ensemble is shorter than the time-to-peak of the Whitlock and Lamb data (∼1.2 s vs. 1.9 s for the data). This is because the model parameters were chosen to reproduce a broad array of data from various rod preparations to be shown in subsequent figures, including the kinetics of the full-range dark-adapted flash responses series, not the kinetics of the Whitlock and Lamb data.
Fig. 2 also shows that the model SPR amplitude (Figs. 2b & 2g) and area statistics (Figs. 2c & 2h) are close to empirical. Panels d and i show that the model generates an ensemble of dim-flash responses in which the square of the ensemble dim-flash mean (, blue) closely matches the dim-flash variance (, red) over most of the waveform, except for a scaling factor (λ) related to the mean number of photoisomerizations per flash. The approximate match between the and waveforms is consistent with a stereotyped SPR waveform (Whitlock & Lamb, 1999; Hamer et al., 2003). This classical approach to estimating the degree of variability of SPRs (Schnapf, 1983; Rieke & Baylor, 1998a) has some limitations which are discussed in Whitlock and Lamb (1999) and more extensively in Hamer et al. (2003). But it is shown here for historical completeness, and for comparison with our prior work.
Another measure of SPR reproducibility comes from an analysis of the time-dependent residual variability of the SPRs (Figs. 2e & 2j). This analysis was introduced by Rieke and Baylor (1998a) and Field and Rieke (2002). These panels depict the time course of the noise-corrected SPR variance (red) and the square of the mean SPR (blue). As in Rieke and Baylor (1998a,b) and Field and Rieke (2002), is approximately an order of magnitude smaller than for both the data (Fig. 2e) and the model (Fig. 2j) until after the peak of . In addition, peaks much later than (∼1.5 times), and is broader. This pattern is consistent with a multistep shutoff of R*, but not with some other models of SPR reproducibility (Field & Rieke, 2002).
In summary, the model reproduces four measures of SPR reproducibility and generates realistic dim-flash responses. The one caveat is that the value of CVarea is slightly, but consistently larger than would be predicted if all eight R* shutoff steps in the model were contributing optimally to reducing variability in integrated R* activity (optimal CVarea = 0.35; CVarea for Whitlock & Lamb's data was 0.36; for the SPR model in Hamer et al., 2003, CVarea was 0.38; for the present model CVarea = 0.41). It turns out that the details of the binding rate constants and competitive interactions between R* and G, RK, and Arr that permit the model to fully capture SPR reproducibility do not appear to be compatible with large Ca2+-mediated gain changes (by modulation of R* lifetime via Rec/RK) at highly saturating intensities (e.g. Murnick & Lamb, 1996). This tradeoff is addressed in detail in the Discussion.
Nucleotide manipulations of Rieke and Baylor (1998a)
In 1998, Rieke and Baylor presented experimental results that they interpreted as evidence that neither phosphorylation nor arrestin-binding controlled the majority of rhodopsin's cumulative activity, and that phosphorylation cannot dominate R* inactivation. Figs. 3a and 3b reproduce data from Rieke and Baylor's (1998a, Fig. 14) showing the effects of lowering transduction gain (by decreasing GTP 2.5 times) in the presence of control (500 μM) or low (20 μM) ATP levels in dialyzed toad rod outer segments. With normal ATP (panel 3a), decreasing GTP concentration caused the dimflash response amplitude to decrease (see inset) with no effect on the response kinetics. Decreasing GTP did slow the kinetics, however, if phosphorylation was substantially slowed by also reducing ATP (Fig. 3b).
Fig. 3.
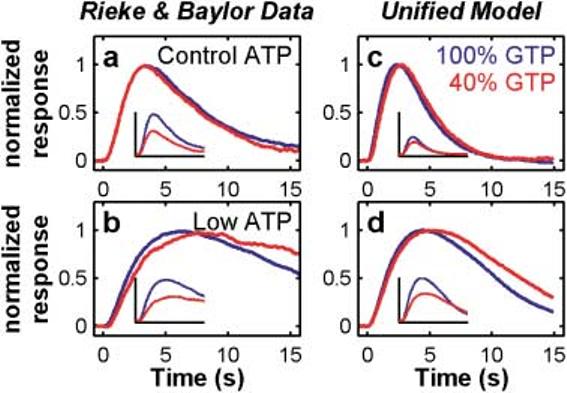
The unified model reproduces Rieke and Baylor's (1998a) nucleotide manipulation results. Left (panels a,b): Rieke & Baylor (1998a) data. Right (panels c,d): Unified model. Top row (a,c) shows the response to a GTP reduction under control ATP conditions. Lowering GTP reduces the rate of transducin activation and lowers the gain of the response, but the response kinetics are not significantly slowed unless ATP is also lowered to slow phosphorylation of R* (bottom row, b,d). Rieke and Baylor had interpreted this pattern of results to imply that phosphorylation (and Arr-capping) could not dominate R* inactivation. The unified model (in which only phosphorylation and Arr-capping are responsible for inactivation of R*) reproduces this behavior (panels c,d). The insets show the responses before equating the peak amplitudes. Also see Hamer et al. (2003) for more details.
In Hamer et al. (2003), we showed that this pattern of results does not rule out phosphorylation dominating R* inactivation. The Hamer et al. model reproduced the Rieke and Baylor results even though phosphorylation (with Arr-capping) was the only R* inactivation mechanism. Figs. 3c and 3d show that when the Hamer et al. model is elaborated to account for a broader array of responses, including responses in the high-intensity regime, it can still reproduce the Rieke and Baylor nucleotide manipulations.
The model captures a full dark-adapted flash response series spanning about five log units of intensity
Fig. 4a shows a dark-adapted (DA) flash series (red) from a toad rod, along with a model simulation of the flash series (blue). The responses shown here were simulated using the differential-equation version of the stochastic reactions in the model, combined with the back-end reactions, using the same parameters that yielded the dim-flash behavior shown in the previous figures. The parameters were not adjusted in any way, and we did not try to capture every feature of the responses, such as the details of the recovery portion of the waveforms.
The model generates realistic flash responses, with roughly the empirical waveform, throughout the flash intensity range up through 118,000 R*/flash, where the response saturates for more than 10 s. The time-to-peak and peak amplitude as a function of flash intensity are similar to the data (Fig. 4a). The Tsat function (Tsat vs. ln(I); Pepperberg et al., 1992, 1994) derived from the model responses (blue curve, Fig. 4b) matches the empirical Tsat function with a slope of 2 s/ln unit reflecting the value of the rate-limiting τPDE (see Table 1).
The model captures steady-state light-adapted rod response features
Steady-state circulating current
Koutalos et al. (1995) presented an analysis of light adaptation and its effects on circulating current in rods. They measured circulating current from salamander rods under control conditions (Ringer's) and under Ca2+ clamp in which the effect of Ca2+ feedback onto several loci in the cascade was presumably effectively shut down. Their data, shifted horizontally to account for sensitivity differences between their salamander rod and our (toad rod) model, are reproduced in Fig. 5 (Ringer's: black triangles; Ca2+ clamp: blue circles).
Fig. 5.
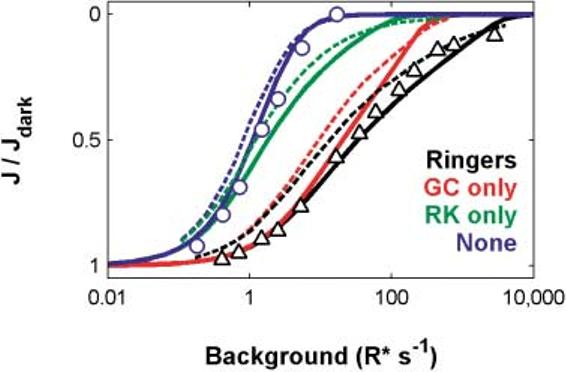
The unified model reproduces Koutalos et al.'s (1995) steady-state current measurements and simulations. Steady-state (SS) circulating current as a function of background LA. Data points: Koutalos et al.'s (1995) measures of salamander rod SS current in Ringer's (Δ) or under Ca2+ clamp (○). Solid curves: Corresponding predictions from our unified model. Dashed curves: Koutalos et al. model in which they adopted a dark calcium value of 500 nM. Data and model from Koutalos et al. were shifted along the horizontal axis to compensate for differences in sensitivity between their salamander rods, and our toad model, which was ∼38 times more sensitive than their salamander rod. The abscissa is correct for the unified model.
Under both clamped and unclamped conditions, increasing the intensity of the background adapting light caused the circulating current to decrease progressively until, at the highest intensity backgrounds, the circulating current was completely shut down. The vertical separation between the triangles and the circles is a gauge of the magnitude of the “protection” from saturation afforded to the rod by all the Ca2+-feedback mechanisms.
The circulating currents generated by our model are shown as the solid black (control) and blue (Ca2+-clamp) curves. Note that our model's predicted LA steady-state current matches the form of Koutalos' data for both control and Ca2+-clamp conditions.
One of the important contributions of the Koutalos et al. (1995) paper was that they also attempted to quantify the relative contribution of three Ca2+-feedback pathways to steady-state light adaptation of circulating current. Using parameter estimates from the literature and from their own measurements, they modeled Ca2+-feedback modulation of (1) cyclase synthesis via GCAPs and guanylate cyclase (e.g. Koch & Stryer, 1988; Gorczyca et al., 1994); (2) the effective PDE* lifetime through calcium modulation of R* lifetime via recoverin and rhodopsin kinase (e.g. Kawamura & Murakami, 1991; Kawamura, 1993; Kawamura et al., 1993; Chen et al., 1995; Klenchin et al., 1995); and (3) the affinity of the CNG channels for cGMP (e.g. Hsu & Molday, 1993). In their analyses, as well as analyses in Nikonov et al. (2000), the effect of the latter feedback was slight, and so is not considered further here.
The theoretical contribution of cyclase feedback alone can be seen by comparing the solid blue and red model curves in Fig. 5. The contribution of Ca2+ feedback onto RK is shown by comparing the solid blue and green curves. The dashed curves in Fig. 5 show Koutalos' corresponding theoretical predictions for the individual contribution of these two feedbacks. Note that cyclase feedback by itself has the most profound impact at low to moderate light intensities, where it seems to almost completely determine the steady-state response in Ringer's. However, at high intensities, RK feedback contributes strongly to the steady-state circulating current response. This result is also consistent with simulations done by Nikonov et al. (2000).
Our steady-state model predictions closely match Koutalos et al.'s (1995) analyses and data with no adjustments in parameters from those yielding the results in Figs. 2-4.
LA flash sensitivity
In general, flash sensitivity of individual rods studied electrophysiologically tends to adhere to the Weberian slope of the Weber-Fechner relation
over a range of background light intensities spanning 1.5–3 log units. (I1/2 is the background intensity that decreases the flash sensitivity by a factor of two).
Fig. 6 shows rod LA flash sensitivity data from four studies, obtained from four different species: salamander: black circles (Matthews et al., 1988); guinea pig: up triangles (Matthews, 1991); rabbit: down triangles (Yau, 1994); bushbaby: squares (Tamura et al., 1991). Weber's law is shown as the red line with slope of −1.
Fig. 6.
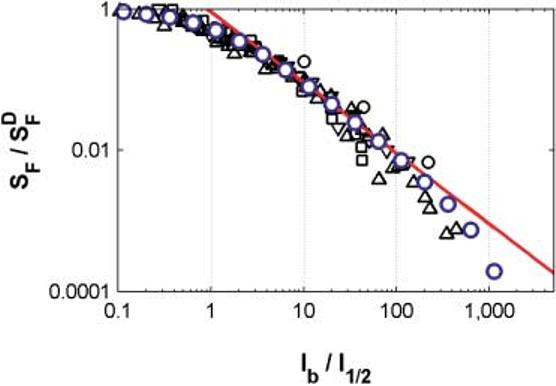
The model reproduces steady-state LA flash sensitivity measured in rods from four species. Red line: Weber's law; Black data points: LA flash sensitivity from four studies—salamander, ○: Matthews et al. (1988; I1/2 = 0.8 photons μm−2 s−1); guinea pig, △: Matthews (1991; I1/2 = 43–130 photons μm−2 s−1); rabbit, ▽: Yau (1994); bushbaby, □: Tamura et al. (1991; I1/2 = 28 R* s−1); Blue circles: LA flash sensitivity of our unified model (I1/2 = 2.8 R* s−1). Background intensities (Ib) have been normalized to the intensity that reduces sensitivity by half of its dark value (I1/2), to account for differences in the absolute sensitivity of these different species.
The blue circles plot the relative flash sensitivity of the model. The model is able to generate Weber's law LA over a range that matches four empirical measures obtained from four ver tebrate species.
The model captures features of rod responses exhibiting the interplay of static and dynamic effects of light adaptation
Responses to prolonged pulses of light (“step” responses)
Fig. 7 shows a family of 14 step responses obtained from newt rods (red curves; Forti et al., 1989) for steps of light ranging from 5 R*/s to 220,000 R*/s. The model step responses superimposed on top of the data are shown as solid blue curves.
Fig. 7.
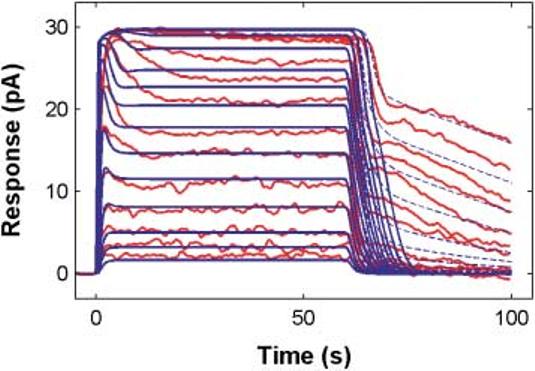
The model captures the general features of step responses from a newt rod. Red: Step responses from a newt rod (Forti et al., 1989) for 60-s steps of light ranging from 5 R*/s to 220,000 R*/s (the I1/2 for the steady-state portion of the step responses was ∼100 R*/s). Blue: The unified rod model responses (solid lines). The model was not adjusted to attempt to capture the exact dynamics of the newt rod's transient response at step-onset or the steady-state level to which this initial response declined. The faster kinetics in the relaxation from the onset transient to steady state reflect the difference in overall kinetics of this particular newt rod response and the toad rod responses to which our model was fit (Fig. 4). The model used throughout this study did not include a mechanism that could account for the slow phase of the responses at step offset (see Discussion for details). Addition of reversibility to the R*-Arr binding reaction (Lamb, 1981), in a manner similar to model of Forti et al. (1989) produces a slow phase in the step-offset response similar to what is seen in the data. The blue dashed lines are the model step responses after addition of a dissociation reaction of R*-Arr with rate 0.0023/s and an irreversible forward reaction from R*-Arr to an inactive downstream product with rate 0.035/s.
Except for the most intense steps (responses 9–14 from the bottom), the model captures the steady-state responses of the newt rod without any parameter adjustments. As in the data, the model generates a transient response at step-onset, with a subsequent relaxation to steady state, albeit with somewhat faster kinetics. The faster relaxation likely reflects differences in feedback and recovery parameters between newt versus toad rods.
One salient feature, absent from the model responses shown in solid blue, is the two-phase offset response seen in the data, a fast initial recovery, followed by much slower phase lasting many seconds. This feature has been observed at step-offset in other recordings (e.g. salamander: Nakatani & Yau, 1988; Koutalos et al., 1995; primate: Tamura et al., 1991).
The slow-phase of the step-offset response cannot be accounted for by supposing species-dependent differences in parameters, but rather points to the need for additional molecular mechanisms. The result of adding one of a number of candidate mechanisms (see Discussion) is shown as the dashed blue curves in Fig. 7. Here we have added reversibility to the R*-Arr binding reaction (Lamb, 1981; Leibrock et al., 1994, 1998), in a manner similar to model of Forti et al. (1989). This simple addition produces a slow phase in the step-offset response that begins to capture the most salient qualitative feature of the step-offset responses, namely the transition from a relatively fast recovery phase to a slow phase with a time constant on the order of tens of seconds. The blue dashed lines thus show the model step responses after addition of a dissociation reaction of R*-Arr with rate 0.0023/s and an irreversible forward reaction from R*-Arr to an inactive downstream product with rate 0.035/s.a This issue is also addressed in the Discussion.
Step-flash paradigm of Fain et al. (1989)
Fain et al. introduced a paradigm demonstrating Ca2+-mediated light adaptation in salamander rods (Fain et al., 1989; Matthews, 1995). They presented a saturating flash (of fixed intensity) to a rod at the offset of 7-s steps of light presented at different intensities. When the flash was presented alone, it caused a completely saturated response for ∼3 s. As the intensity of the preadapting step increased, the period of complete saturation elicited by the flash decreased systematically, indicating that the effectiveness of the flash had been reduced progressively by the steps of light.
The red curves in Fig. 8 reproduce Fain et al.'s (1989) data. The blue curves in Fig. 8 show the model responses, without any parameter adjustments, simulating Fain et al.'s paradigm. The model reproduces the step response features, as well as the reduction in saturation period induced by the steps. For the model, the contraction in Tsat reflected an overall gain reduction of 2.6 times induced by the steps; Tsat decreased by 1.9 s, which, when reflected through the 2 s/ln unit Tsat slope in Fig. 4b, corresponds to a decrease in equivalent intensity of e1.9/2 = 2.6. In Fain et al.'s data, Tsat decreased by 1.6 s, corresponding to a gain reduction of 2.7 times (assuming a Tsat slope of 1.6 sec/ln unit; Nikonov, Lamb & Pugh, 2000, their Fig. 10).
The model does not capture the details of the flash recovery kinetics and no attempt was made to do so. The discrepancy between the salamander rod recovery phases of the Fain et al. (1989) data and the model may reflect, in part, species differences since actual toad rod data to which we fitted the model (Fig. 4) recovered from saturation with kinetics closer to our model (black curve).
The changes in Tsat in the Fain et al. (1989) paradigm have been shown experimentally to be due to Ca2+ feedback in the cascade (e.g. Matthews, 1995), but this feedback could be acting on either early (e.g. R* inactivation via RK) or late stages (i.e. cGMP synthesis via cyclase) in phototransduction (see Fain et al., 2001). The modern interpretation of the Fain et al. gain changes is that they are due to feedback at early stages in phototransduction (Fain et al., 2001), and this is certainly the case in our simulations. This issue is addressed in more detail in the Discussion.
Two-flash paradigm of Murnick and Lamb (1996)
The early gain changes implicated by the Fain et al. (1989) step-flash results were demonstrated even more strongly by the results of an experiment by Murnick and Lamb (1996) on toad rods. Their data exhibited strikingly nonlinear behavior—the period of complete photocurrent saturation in response to a test flash was reduced when preceded by a (less-intense) saturating preflash. The change in Tsat was substantial, exceeding the magnitude of the delay between the pretest and test flashes. Depending on the delay, the preflash could reduce test flash Tsat from ∼13 s to 7 s. The interpretation of the data was that the preflash had initiated a Ca2+-dependent reduction in gain early in the phototransduction cascade, presumably via Ca2+ modulation of RK-phosphorylation of R*. From the slope of the Tsat versus ln (I) function (2.88 s/ln unit) measured in their study, one can estimate the effective front-end gain change corresponding to the measured change in Tsat; in this case, the gain reduction was a factor of 11.
Fig. 9 shows the result of implementing Murnick and Lamb's two-flash paradigm with the model (blue), along with the data (red). The figure shows estimated gain reduction as a function of the delay between the pretest and test flashes. The gain reduction was calculated by converting the change in Tsat (relative to zero delay) into an effective intensity reduction via the Tsat slope (2 s/ln unit, for the model, and 2.88 s/ln unit for the Murnick & Lamb data).
Fig. 9.
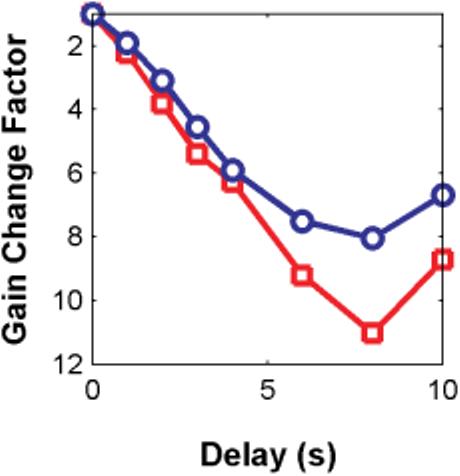
Simulation of Murnick and Lamb's (1996) two-flash paradigm. A conditioning pre-flash presented at various times (delay) prior to a test flash caused a reduction in Tsat due to the test flash. The corresponding effective gain reductions induced by the pre-flash were estimated from the change in Tsat at each delay. Red: Estimated gain changes for Murnick and Lamb's toad rod data. Blue: Gain changes estimated in the same manner from the unified model responses. As in the data, the unified model generates substantial gain reductions due to the pre-flash, and these gain reductions increase in magnitude out to a delay of 8 s. However, the model did not produce as large a maximal gain change as observed in Murnick and Lamb—for the parameters used, the model generated a maximum estimated gain reduction of 8 times vs. 11 times in the Murnick and Lamb data. This quantitative difference between data and model is due to a surprising tradeoff between the dim-flash and bright-flash regimes—i.e. parameters that will yield optimal SPR reproducibility appear to be incompatible with those that permit the model to fully reproduce Murnick and Lamb's large gain changes. This tradeoff is addressed in the Discussion.
The model is able to reproduce the key qualitative features of the Murnick and Lamb (1996) results, including a large reduction in Tsat.
The overall change in gain was somewhat less than observed in Murnick and Lamb: a factor of 8 instead of 11. This particular discrepancy between model and data, though modest in magnitude, turned out to be robust. In multiple analyses, we determined that some front-end parameter values that allowed the model to achieve low variability of SPR area, mitigate against achieving the large gain changes observed by Murnick and Lamb, and vice versa.
Thus, the dim-flash regime response features, taken together with the Murnick and Lamb results, appear to impose especially strong constraints on any model. This issue will be addressed in the Discussion.
The model reproduces the salient features of genetically modified rod responses
Fig. 10a shows single-photon responses from four different studies of genetically modified mouse rods; blue: RK−/− (Chen et al., 1999); red: Arr−/− (Xu et al., 1997); green: RGS9−/− (Chen et al., 2000); orange: GCAPs−/− (Burns et al., 2002), as well as a representative mean WT single-photon response scaled to peak at 1.0 (black; from Chen et al., 1999). The relationship between the WT and genetically altered response amplitudes was preserved for each of the studies.
Fig. 10b shows our simulations of these data, but with toad rod parameters. Thus, the model curves represent predictions of these same genetic manipulations if they were per formed in toad rods.
The RK−/− condition disables phosphorylation of R*. These responses rise roughly along the WT response rising phase, and continue, reaching a peak amplitude roughly twice the WT peak amplitude. The RK−/− responses begin to deviate from the WT responses midway to the peak of the RK−/− response, (at ∼100 ms) indicating that, in WT mouse rods, phosphorylation begins to significantly decrease R* activity at about this time (Chen et al., 1999; Mendez et al., 2000).b Our model simulation of RK−/− reproduces these features.
The Arr−/− SPRs peak at about the same amplitude as WT, but then recover ∼50% over the time period shown. Our model reproduces this behavior.
The interpretation of the form of the Arr−/− SPRs, confirmed by our simulations, is that phosphorylation of R* (which continues unaffected by the Arr knockout) restricts the Arr−/− peak amplitude (otherwise, Arr−/− responses would match the RK−/− responses), and is responsible for the partial recovery of the Arr−/− responses.
The RGS9−/− responses (green curve, Fig. 10a) reach approximately WT peak amplitude, and then recover along a time course about 10 times slower than WT (Chen et al., 2000; Krispel et al., 2003; Martemyanov et al., 2003; Keresztes et al., 2004). The GCAPs−/− responses (Burns et al., 2002) rise along with the WT responses, then continue to increase to several times the peak amplitude of the WT responses. This illustrates the profound affect that Ca2+ feedback has on guanylate cyclase activity even at the single-photon response level (Burns et al., 2002). The model reproduces the behavior of both the RGS9−/− and GCAPs−/− data.
In summary, with no parameter adjustments other than implementation of each genetic alteration (see Materials and methods), the model (Fig. 10b) reproduces all the salient features of the data (Fig. 10a).
Discussion
In the present paper we have elaborated the Hamer et al. (2003) multiple phosphorylation model in order to evaluate its ability to account for a wide array of vertebrate rod responses, from the single-photon level to saturating bright flashes eliciting prolonged photocurrent saturation and varying degrees of light adaptation. We found that the model captures signature qualitative and quantitative features from many different stimulus protocols applied to rods from several species. With a single set of parameters, the model reproduces (1) toad rod dim-flash responses and four analyses of these responses (Fig. 2), including high SPR reproducibility and the nucleotide manipulations of Rieke and Baylor (Fig. 3; 1998a); (2) a full dark-adapted, toad rod flash response series spanning ∼5 log units of flash intensity (Fig. 4); (3) light-adapted circulating current from a salamander rod (Koutalos et al., 1995) in Ringer's as well as under Ca2+ clamp (Fig. 5); (4) light-adapted flash sensitivity from four species (Fig. 6); (5) step responses from newt rods over a nearly 5 log unit dynamic range (Fig. 7; Forti et al., 1989); (6) the front-end gain changes implied by the step-flash responses from salamander rods (Fig. 8; Fain et al., 1989; also discussed below); (7) large front-end gain changes (implied by large reductions in Tsat induced by a preflash) elicited in the two-flash paradigm of Murnick and Lamb (Fig. 9; 1996); and (8) the salient qualitative features of responses from rods in which four different proteins had been genetically knocked out (Fig. 10).
One impetus for the present study was to test the generality of the Hamer et al. (2003) multiple phosphorylation model. If the model could successfully account for dim-flash rod responses including SPR reproducibility, but failed to be able to reproduce key response features in higher light level regimes, or failed to reproduce one or more of the genetic KO response features, this would have challenged the generality and predictive value of the model structure. Thus, the present results provide a strong validation of the Hamer et al. (2003) multiple phosphorylation model.
Never theless, despite its ability to capture the broad array of data shown here, it is impor tant to examine any remaining limitations of the new unified model, since these will serve as important clues to guide future research and model development. These are discussed in the following section.
Limitations and future directions for research and model development
Slow-phase at step-offset or recovery from bright flashes
For the simulations shown in Figs. 2-6, 8-10, and for the simulated step responses shown in solid blue in Fig. 7, the model did not have an explicit mechanism to reproduce the pronounced slow phase of rod photocurrent recovery frequently seen at the offset of steps of light (e.g. Nakatani & Yau, 1988; Forti et al., 1989; Tamura et al., 1991; Koutalos et al., 1995) and late in the recovery to bright flashes (e.g. Baylor et al., 1974; Torre et al., 1986; Pepperberg et al., 1992, 1994).
Several possible mechanisms to account for this behavior come to mind, each of which is likely to involve the presence of a product of bleaching. Thus, the presence of an “inactive” product of light absorption might cause weak activation of the transduction cascade, either directly, or perhaps via a slow back-reaction to active rhodopsin (Baylor et al., 1974; Lamb, 1981; Pepperberg et al., 1992; Leibrock et al., 1994, 1998). One possible scheme for a back-reaction might be activated and phosphorylated forms of R* reappearing after Arr-capping on rare occasions through reversible reactions and/or side reactions in the retinoid cycle (Lamb, 1981; Leibrock et al., 1998). By implementing this kind of approach (i.e. a rhodopsin back-reaction) in the context of a much simpler set of front-end reactions than the present model, Forti et al. (1989) were able to simulate the multiphasic nature (fast and slow components) of the step-offset response in newt rods. Their result demonstrates that, in principle, this kind of scheme can account for the observed step-offset features.
The auxiliary simulation presented in Fig. 7 (dashed blue curves) demonstrates that inclusion of a back-reaction from inactivated to activated R* in our model can account for the qualitative (fast phase, slow phase) aspects of rod recovery following intense stimulation.
Another candidate mechanism might be a slow activation of the cascade by bleached photopigment, which has been shown to weakly activate the phototransduction cascade (Fain & Lisman, 1993; Cornwall & Fain, 1994; Cornwall et al., 1995; Melia et al., 1997; Leibrock et al., 1998; Sampath et al., 1998; Cornwall et al., 2000; Fain et al., 2001; Firsov et al., 2005).
The role of rhodopsin photoproducts in shaping the responses under high-intensity (bleaching) conditions is an important topic. Accounting for the quantitative details of the multiphasic step-offset response (as one example) would require detailed analyses evaluating the various candidate molecular mechanisms, ideally carried out with a larger set of data from one species. Such analyses are beyond the scope of the present paper. We hope to explore the alternative mechanisms in future research. Genetic manipulation experiments that modify enzymatic components of the retinoid cycle, in combination with mathematical modeling, might also help to determine the potential roles of various species in the retinoid cycle.
On the tradeoff between SPR reproducibility and large gain changes in the Murnick and Lamb (1996) paradigm
We discovered an unexpected tradeoff between front-end parameters that could support optimal SPR reproducibility and those that would permit the model to reproduce the large gain changes implied by the results of Murnick and Lamb's (1996) two-flash paradigm. The simulations shown in Figs. 2 and 9 represent a compromise, whereby the model achieved near-empirical SPR reproducibility and a relatively large estimated gain change in the simulation of the Murnick and Lamb paradigm.
However, in its present form, our model generates modestly smaller gain changes in the early part of the phototransduction cascade than those estimated from the Murnick and Lamb data (Fig. 9). From the contraction in test-flash Tsat induced by an adapting preflash, Murnick and Lamb estimated a maximal gain reduction of a factor of 11, whereas, in our model with the parameters used, the front-end gain is reduced, at most, by only a factor of 8.
We found that by speeding up Arr binding [increasing kA(n) in eqn. (A5)], we could readily reproduce the full Murnick and Lamb gain change, or even exceed it. However, increasing the rate of Arr binding degraded SPR reproducibility (increased CV of SPR area).
To understand the cause of this tradeoff in our model, it helps to consider what limits the maximum magnitude of front-end gain change in our model. Toward this end, it will help to envision the state of transducin (and PDE) activation at two points in time—immediately following the preflash (T0), and at a hypothetical time Tmax, the time at which all R* elicited by the preflash are fully phosphorylated.c Immediately after the (saturating) preflash, Ca2+ has not yet dropped significantly below its dark level, and thus RK concentration is near its minimum (dark) level, and the rate of phosphorylation of R* is nearly at its slowest (i.e. its dark level). As Ca2+ falls after the preflash, RK concentration increases due to Ca2+ feedback onto Rec/RK, thus speeding phosphorylation. However, since Arr binding is not Ca2+ dependent, the drop in Ca2+ does not affect the rate of binding of Arr. Thus, at low Ca2+ levels, when phosphorylation has been sped up substantially, the final step of R* inactivation (Arr binding) will produce a larger fraction of G* (PDE*) than at dark levels of Ca2+. At Tmax, when all R* are fully phosphorylated, any further decreases in Ca2+ and concomitant increases in RK will have no effect on the total number of PDE* produced, because (by definition) phosphorylation rate cannot be increased any further. Thus, the residual ‘tail’ of R* activity controlled by this final shutoff step establishes a minimum number of PDE* that each R* produces regardless of how much phosphorylation was sped up by Ca2+ feedback. The maximum possible gain change in this scheme is set by the ratio of the expected number of PDE* elicited immediately after the preflash (where phosphorylation was at its slowest) to the expected number produced at Tmax. Since the “tail” of activity at Tmax controls a much larger fraction of the PDE* production than at T0, speeding up Arr binding will decrease the total number of PDE* produced at Tmax by a much larger fraction than at T0; hence, an increase in the gain change (i.e. an increase in the above ratio).
However, speeding up Arr binding to reduce the contribution of the “tail” of R* activity in the bright flash regime will degrade SPR reproducibility for two reasons. First, in our model, optimal reproducibility relies on each R* inactivation step (including the final step prior to Arr quench) activating an approximately equal number of PDE* (Hamer et al., 2003). Second, if Arr binding is sped up sufficiently, it will begin to cause R* to inactivate at a lower phosphorylation state, thus reducing the effective number of R* inactivation steps in the dim-flash regime, and thus necessarily increasing SPR variability (i.e. decreasing the number of inactivation steps must increase the CV of SPR area; this is derived in Hamer et al., 2003).
Several simple modifications of our model could give larger Ca2+-mediated gain changes in the early stage of the phototransduction cascade while potentially preserving SPR reproducibility. One is to introduce Ca2+ dependence for the affinity between fully phosphorylated R* and G-protein, so that this affinity decreases as the internal free Ca2+ concentration falls. Another possibility is to introduce Ca2+ dependence for the affinity between fully phosphorylated R* and arrestin, such that this affinity increases as the free internal Ca2+ concentration falls. We plan to test these ideas in our model, and we hope that these modeling effor ts will lead to corresponding tests in biochemical experiments.
Photocurrent activation under light adaptation (Nikonov et al., 2000)
Nikonov et al. (2000) found that normalized fractional incremental rod photocurrent responses rise along a common trajectory, regardless of the intensity of the adapting light, for background lights that suppress up to 80% of the dark-adapted photocurrent and reduce sensitivity by a factor of 30. The conclusion of Nikonov et al., based on this observation and their mathematical analysis, was that a flash of fixed intensity elicits an increment in PDE* activity that is initially independent of the state of adaptation over this range of background light levels. Our model does not exhibit this behavior. The corresponding responses generated by our model systematically peel away from a common rising phase shortly after the flash (not shown).
It is possible that this discrepancy reflects the fact that Ca2+ feedback onto guanylate cyclase and/or RK activity may be too fast in our model. In our model, both the interaction of recoverin with Ca2+ and cyclase activity are instantaneous functions of the free internal Ca2+ concentration. Introducing realistic kinetics for the interactions between Ca2+ and recoverin and GCAPs, and for the interactions between GCAPs and guanylate cyclase, may rectify the problem.
Another possibility relates to the competitive nature of binding between R* and the three proteins RK, G-protein, and Arr. In our model, these three species compete in a mutually exclusive manner to bind R*, albeit with phosphorylation-dependent affinities. In the model implementation of the Nikonov et al. paradigm, as LA background level increases, the concentration of RK increases due to the drop in internal Ca2+. Consequently, the competition with G-protein binding increases, thus reducing transduction gain at the time the flash is presented. Therefore, in future research we will examine alternative competitive binding schemes.
On the relative roles of Ca2+-feedback at early versus late phototransduction stages
We have shown that our unified model is able to reproduce the contraction in saturation period observed in Fain et al.'s (1989) step-flash paradigm. One interpretation of the Fain et al. result is that the steps cause a gain reduction early in the cascade, in the activation stages (e.g. Torre et al., 1986; Kawamura & Murakami, 1991; Pepperberg et al., 1994; Matthews, 1995; Fain et al., 2001). By this scheme, a saturating flash following a light-adapting step will simply not elicit as many PDE* as a dark-adapted flash, thus reducing Tsat. A likely candidate mechanism for this gain reduction is an increase in the rate of phosphorylation of R* through an increase in Ca2+-mediated feedback onto RK via recoverin (e.g. Kawamura & Murakami, 1991; Kawamura, 1993; Klenchin et al., 1995).
However, in principle, the results of the step-flash paradigm could also reflect the influence of feedback onto cGMP synthesis by cyclase (as noted by Fain et al., 1989, Matthews, 1996 and Fain et al., 2001). Fain et al. (2001) point out that the relative contribution of cyclase feedback to the observed contraction of Tsat depends on the relative dynamics of the underlying Ca2+ response. They note that, under normal physiological conditions, the kinetics of Ca2+ extrusion are sufficiently fast so that cyclase activity will be effectively “pegged” near its maximal rate by the time each of the flash responses begin to recover. Thus, they reason that the changes in Tsat are likely to reflect Ca2+-mediated effects on early reactions in the cascade, and not on cyclase.
In simulations (not shown), we confirm Fain et al.'s intuition by showing that Ca2+ effects on cyclase per se can also induce a significant reduction in Tsat when Ca2+ dynamics are slowed relative to the rest of the cascade. However, under more physiologically realistic conditions, when the Ca2+ dynamics are set to be appropriate to capture all the features of the rod responses illustrated in the present study, the changes in Tsat in the Fain step-flash paradigm (blue curves, Fig. 8) are controlled almost exclusively by the early gain changes affecting R* phosphorylation rate. We can show that if we selectively disable Ca2+ feedback onto Rec/RK (leaving only cyclase feedback in place), then Tsat only changes by ∼200 ms, compared to the 1.9 s it changes with Rec/RK feedback intact.
Our simulations are consistent with data from genetic knockout experiments supporting the notion that, in normal rods, the Ca2+ mediated gain changes in the high-intensity regime are dominated by modulation of R* inactivation via recoverin and RK. Burns et al. (2002) showed that saturating flashes presented on a background elicited substantially shorter periods of saturation than dark-adapted flashes in GCAPs−/− rods. This implicates Ca2+ sensitive LA mechanisms other than cyclase feedback. That this mechanism is due to feedback onto recoverin and RK is implied by the work of Dodd (1998) and Makino et al. (2004) who showed that Rec−/− mouse rods (which have the cyclase feedback mechanism intact) fail to show any contraction of Tsat when the Fain et al. step-flash paradigm is applied. In WT mouse rods, however, the step-flash paradigm does elicit the changes in Tsat.
Concluding remarks
A full quantitative understanding of rod phototransduction would allow one to simulate, by a mathematical model, the full gamut of rod responses, from the single-photon to the highest light levels to which the rod can respond and/or adapt. It should be able to account for responses under all physiological conditions using a single set of model parameters, with appropriately modified stimulus parameters for the various experimental conditions. The present model represents a significant advance toward this goal, since it is able to account for many salient rod response features in various experimental studies performed on rods from numerous species.
It is particularly encouraging that the unified model is able to reproduce the features of responses from genetic KO rods without the need for any extra parameter changes. This result suggests the model can have impor tant predictive value in the simulation of retinal diseases that affect specific loci in the phototransduction cascade, or in simulation of chemical or genetic clinical interventions.
In our attempt to develop a full-range model, our analyses revealed an unexpectedly tight linkage between the dim-flash and bright-flash domains that imposes strong constraints on any model of rod phototransduction. The tradeoff we discovered (see Discussion) suggests that the biochemistry underlying ver tebrate rod phototransduction has been exquisitely “tuned” during evolution so as to preserve critical abilities at both ends of the cell's dynamic range— reproducible single-photon responses, and robust gain mechanisms to enable the cell to adapt to high light levels. These abilities are, arguably, both evolutionarily advantageous (Pugh, 1999). The results highlight the importance of explicit computational modeling of all the relevant biochemical steps inasmuch as possible.
Our long-term goal is to develop truly comprehensive, quantitative models of both rod and cone phototransduction. Such models serve as a quantitative summary of the current state of understanding, and have many important applications—understanding of the mechanisms underlying the profound differences between rods and cones; simulation of lesions in phototransduction associated with retinal disease or experimental manipulations; elucidation of the mechanisms underlying species differences; hypothesis testing and generation of experimental predictions in all these domains. This goal seemed virtually unattainable not long ago. However, the prodigious strides in research on phototransduction biochemistry, photoreceptor physiology, molecular biology, and quantitative modeling now bring this exciting goal within sight.
Toward this end, our future work will include examination of the limitations of the model outlined in the Discussion. Progress in these goals can be greatly facilitated, and often depend on extensive collaborations between and among theorists and experimentalists, in which modeling efforts inspire new experiments and new experimental data provide the basis for further modeling progress.
Acknowledgments
We thank Dina Roumiantseva and Ali Navid for assistance in preparation of the manuscript. This research was supported by NEI Grant EY115-13 and Smith-Kettlewell Eye Research Institute Fund 5809-0100 (R.D Hamer), and an ARC Federation Fellowship to T.D. Lamb.
Appendix
This section delineates the chemical and differential equations used in the simulations in the present study. The present model is based on the multiple phosphorylation model presented in Hamer et al. (2003). In the present model, we have added equations to simulate dynamic, calcium-dependent modulation of RK concentration and Ca 2+ feedback onto R* lifetime for simulation of the bright-flash regime.
Rhodopsin reactions
Inactivation pathways
Equations (A1a-A1c), and (A2) show the reactions by which R* activity is reduced, and ultimately quenched by RK-mediated phosphorylation of R*, and final capping by Arr.
| (A1a) |
| (A1b) |
| (A1c) |
| (A2) |
The variable n denotes the phosphorylation state of R* (e.g. indicates a rhodopsin with two of its phosphorylation sites filled). The notations “pre” and “post” in eqns. (A1a-A1c) distinguish RK-bound states of R* before and after phosphorylation, that is, they assume that and are in different states, and that, after each phosphorylation, RK must dissociate from [via eqn. (A1c)] before another phosphorylation [via eqns. (A1a, b)] can occur. One functional consequence of this arrangement is that it does not permit RK-bound R* to cycle through eqn. (A1b) and become multiply phosphorylated without an oppor tunity to interact with G·GDP or Arr or RK.
Catalytic pathway
Transducin is activated by a conventional series of reactions between R* and G-protein [eqns. (A3a-A3e); see Lamb & Pugh, 1992] .
| (A3a) |
| (A3b) |
| (A3c) |
| (A3d) |
| (A3e) |
where Gα·GTP is the activated form of transducin.
Phosphorylation-dependent reactions
Based on Gibson et al.'s (2000) biochemical results, the affinity of rhodopsin for G-protein is assumed to decrease exponentially with increasing phosphorylations [eqn. (A4)] , while its affinity for Arr is assumed to increase linearly with n [eqn. (A5)].
| (A4) |
| (A5) |
The parameter ω in eqn. (A4) was set to 0.6 from an exponential fit to the biochemical data in Fig. 2A in Gibson et al. (2000). We assume that arrestin is able to bind R*, with increasing probability at any time following the first phosphorylation (n≥1), to terminate whatever R* activity remains in that state.
We set the R*-RK affinity [eqn. (A6)] to have the same dependence on n as the affinity between R* and G-protein (Buczylko et al., 1991; Gibson et al., 2000; see Hamer et al., 2003 for more discussion of phosphorylation dependence of R*-RK affinity), with the exception that RK cannot bind to fully phosphorylated R*.
| (A6) |
The affinity profiles embodied in eqns. (A4-A6) yield a near-ideal minimization of variability in the number of activated G-proteins produced per photoisomerization (Hamer et al., 2003).
Phosphodiesterase activation
Activated transducin binds to the γ subunit of PDE [eqn. (A7a)] , relieving the inhibition of cGMP hydrolysis by the PDEg subunit [eqn. (A7b)]. We did not include explicit equations for acceleration of transducin (and, hence, PDE) inactivation due to interactions with the proteins RGS9-1, Gβ5, and R9AP (Skiba et al., 2001; Lishko et al., 2002; Martemyanov & Arshavsky, 2002; reviewed in He & Wensel, 2002), incorporating their effect into a single step of PDE* inactivation [eqn. (A7c)]. In our formulation, Gα·GTP cannot be inactivated unless it is bound to PDE.
| (A7a) |
| (A7b) |
| (A7c) |
PDE*•Gα·GTP represents the activated form of the transducin-PDE complex, referred to as PDE* throughout this paper. Other forms, PDE, PDE•Gα·GTP, and PDE•Gα·GDP, are assumed to have no capacity for cGMP hydrolysis.
In all simulations τPDE was 2 s. The mean stochastic lifetime of R* (mean interval between isomerization and Arr binding) was ∼2.0 s. However, due to ratcheting down of R* activity by phosphorylation, the effective time constant of R* inactivation (defined as the first moment of the mean R* activity function) was ∼0.9 s. Thus, PDE* inactivation was the rate-limiting front-end reaction.
The front-end reactions, with the parameter values listed in Table 1, lead to an initial R* activity of ∼250 G*/s, somewhat higher, but still reasonably close to the 150 PDE*/s repor ted by Leskov et al. (2000). Integrated over time, this produces an average of 325 PDE* per R* in the dim-flash regime.
The “back-end” model
The back-end reactions are hydrolysis of cGMP by PDE* and Ca2+- sensitive synthesis of cGMP [eqn. (A8)]; Ca2+ influx through cGMP-gated membrane cation channels (CNG channels), and Ca2+ efflux via the Na+/Ca2+-K+ exchanger [eqn. (A9)] ; sequestration and release of Ca2+ by intracellular buffers [eqn. (A10)]; and generation of photocurrent, J, upon closure of CNG channels [eqn. (A12)]. The time-varying states of the back-end model are PDE*, g ([cGMP]), c (free intracellular [Ca2+]), and cb (intracellular [Ca2+] bound to buffers), all in μM, and J in ρA.
| (A8) |
| (A9) |
| (A10) |
The units and values of all parameters in Eqs. (A8-A10) are given in Table 1.
Calcium clamping
Ca2+ clamp was simulated by replacing the time-varying calcium variable, c, with the constant, cdark , which reduces the eqns. (A8-A10) to the single equation.
| (A11) |
where αdark = αmax[1 + (cdark/Kc)m]−1 = βdark gdark.
Outer segment current is derived from the cGMP and Ca2+ concentrations by
| (A12) |
where the first term represents the current through the CNG channel, and the second term, the exchanger current.
Recoverin-RK feedback
Recoverin's (Rec) interaction with calcium was modeled in the following manner.
| (A13) |
The calcium-bound form of Rec is able to bind with RK, rendering the kinase unable to bind with rhodopsin, thus providing a pathway for calcium feedback onto the rate of R* inactivation.
| (A14) |
Decreases in intracellular Ca2+ drive the equilibria of eqns. (A13-A14) to the left, resulting in an increase of free RK and faster R* phosphorylation.
We simplify this scheme by assuming that Rec equilibrates with changes in calcium at a rate that is fast in comparison of the time-scale of the photoresponse, thus the chemical eqn. (A13) is approximated by the instantaneous relationship:
| (A15) |
where Rectot is the total intracellular concentration of Rec in all of its forms, and Kp = (kRec2/kRec1)1/w. The second term in the numerator equals [Rec•wCa2+•RK] and is obtained by accounting for the different states of kinase in the cell [see eqns. (A1a-A1c), and (A14)].
Equations for the high-intensity regime
To simulate response to high-intensity stimuli, or average responses to dim-flash stimuli, a full differential equation representation of chemical eqns. (A1–A10) is used, in combination with eqn. (A12), to simulate the photoresponse. The differential equations for the front-end model are shown in eqns. (A16-A27), and eqn. (A28) solves for the RK feedback signal.
| (A16) |
In the case where n = 0, the term is replaced by the product of the stimulus signal and the relative available rhodopsin (R/Rtot), where R is given by
| (A17) |
| (A18) |
| (A19) |
| (A20) |
Note that since kRK3 (nmax = 0, there is no state, and by definition there is no .
| (A21) |
| (A22) |
| (A23) |
| (A24) |
| (A25) |
| (A26) |
| (A27) |
| (A28) |
Footnotes
We verified that, with the parameters for the back-reaction used here, none of the other model results shown in Figs. 2-6, 8-10 were altered.
The RK−/− responses behave approximately like step responses that shut off abruptly at widely variable times, having an approximately exponential distribution with a mean of ∼3 s (Chen et al., 1999). This is consistent with a single step inactivation of R*, likely due to a greatly slowed Arr binding in the absence of phosphorylation (Chen et al., 1999; Mendez et al., 2000; Schroder et al., 2002). The SPRs in Mendez et al.'s (2000) completely substituted mutant (CSM), which also disrupts phosphorylation, exhibited nearly the same behavior as Chen et al.'s (1999) RK−/− SPRs. Thus, for the sake of clarity of presentation, they have not been depicted in Fig. 10. Our model does not yet incorporate any alternative mechanism for shutting off R* in the absence of phosphorylation. Without phosphorylation, Arr does not bind, and there is no alternative mechanism for R* to inactivate. Hence, our simulated RK−/−, CSM (not shown) and Arr−/− SPRs do not shutoff.
For the purposes of this explanation, we are only considering the R*, PDE* and changes in Ca2+ elicited by the preflash. For this “thought experiment”, imagine that we are isolating the effects of the preflash from those elicited by the test flash in the Murnick and Lamb (1996) paradigm.
References
- Ames JB, Porumb T, Tanaka T, Ikura M, Stryer L. Amino-terminal myristoylation induces cooperative calcium binding to recoverin. Journal of Biological Chemistry. 1995;270:4526–4533. doi: 10.1074/jbc.270.9.4526. [DOI] [PubMed] [Google Scholar]
- Ames JB, Ishima R, Tanaka T, Gordon JI, Stryer L, Ikura M. Molecular mechanics of calcium-myristoyl switches. Nature. 1997;389:198–202. doi: 10.1038/38310. [DOI] [PubMed] [Google Scholar]
- Aton BR, Litman BJ, Jackson ML. Isolation and identification of the phosphorylated species of rhodopsin. Biochemistry. 1984;23:1737–1741. doi: 10.1021/bi00303a024. [DOI] [PubMed] [Google Scholar]
- Baylor DA, Hodgkin AL, Lamb TD. The electrical response of turtle cones to flashes and steps of light. Journal of Physiology. 1974;242:685–727. doi: 10.1113/jphysiol.1974.sp010731. [DOI] [PMC free article] [PubMed] [Google Scholar]
- Baylor DA, Lamb TD, Yau KW. Responses of retinal rods to single photons. Journal of Physiology. 1979;288:613–634. [PMC free article] [PubMed] [Google Scholar]
- Buczylko J, Gutmann C, Palczewski K. Regulation of rhodopsin kinase by autophosphorylation. Proceedings of the National Academy of Sciences of the U.S.A. 1991;88:2568–2572. doi: 10.1073/pnas.88.6.2568. [DOI] [PMC free article] [PubMed] [Google Scholar]
- Burns ME, Mendez A, Chen J, Baylor DA. Dynamics of cyclic GMP synthesis in retinal rods. Neuron. 2002;36:81–91. doi: 10.1016/s0896-6273(02)00911-x. [DOI] [PubMed] [Google Scholar]
- Chen CK, Burns ME, He W, Wensel TG, Baylor DA, Simon MI. Slowed recovery of rod photoresponse in mice lacking the GTPase accelerating protein RGS9-1. Nature. 2000;403:557–560. doi: 10.1038/35000601. [DOI] [PubMed] [Google Scholar]
- Chen CK, Burns ME, Spencer M, Niemi GA, Chen J, Hurley JB, Baylor DA, Simon MI. Abnormal photoresponses and light-induced apoptosis in rods lacking rhodopsin kinase. Proceedings of the National Academy of Sciences of the U.S.A. 1999;96:3718–3722. doi: 10.1073/pnas.96.7.3718. [DOI] [PMC free article] [PubMed] [Google Scholar]
- Chen CK, Inglese J, Lefkowitz RJ, Hurley JB. Ca2+-dependent interaction of recoverin with rhodopsin kinase. Journal of Biological Chemistry. 1995;270:18060–18066. doi: 10.1074/jbc.270.30.18060. [DOI] [PubMed] [Google Scholar]
- Cone RA, Cobbs WH., III Rhodopsin cycle in the living eye of the rat. Nature. 1969;221:820–822. doi: 10.1038/221820a0. [DOI] [PubMed] [Google Scholar]
- Cornwall MC, Fain GL. Bleached pigment activates transduction in isolated rods of the salamander retina. Journal of Physiology. 1994;480(Pt 2):261–279. doi: 10.1113/jphysiol.1994.sp020358. [DOI] [PMC free article] [PubMed] [Google Scholar]
- Cornwall MC, Jones GJ, Kefalov VJ, Fain GL, Matthews HR. Electrophysiological methods for measurement of activation of phototransduction by bleached visual pigment in salamander photoreceptors. Methods in Enzymology. 2000;316:224–252. doi: 10.1016/s0076-6879(00)16726-6. [DOI] [PubMed] [Google Scholar]
- Cornwall MC, Matthews HR, Crouch RK, Fain GL. Bleached pigment activates transduction in salamander cones. Journal of General Physiology. 1995;106:543–557. doi: 10.1085/jgp.106.3.543. [DOI] [PMC free article] [PubMed] [Google Scholar]
- Del Castillo J, Katz B. Quantal components of the end-plate potential. Journal of Physiology. 1954;124:560–573. doi: 10.1113/jphysiol.1954.sp005129. [DOI] [PMC free article] [PubMed] [Google Scholar]
- Dodd RL. The role of arrestin and recoverin in signal transduction by retinal rod photoreceptors. Stanford University; Stanford, CA: 1998. Thesis. [Google Scholar]
- Ebrey TG. The thermal decay of the intermediates of rhodopsin in situ. Vision Research. 1968;8:965–982. doi: 10.1016/0042-6989(68)90071-0. [DOI] [PubMed] [Google Scholar]
- Fain GL, Lamb TD, Matthews HR, Murphy RLW. Cytoplasmic calcium as the messenger for light adaptation in salamander rods. Journal of Physiology. 1989;416:215–243. doi: 10.1113/jphysiol.1989.sp017757. [DOI] [PMC free article] [PubMed] [Google Scholar]
- Fain GL, Lisman JE. Photoreceptor degeneration in vitamin A deprivation and retinitis pigmentosa: The equivalent light hypothesis. Experimental Eye Research. 1993;57:335–340. doi: 10.1006/exer.1993.1132. [DOI] [PubMed] [Google Scholar]
- Fain GL, Matthews HR, Cornwall MC, Koutalos Y. Adaptation in ver tebrate photoreceptors. Physiological Review. 2001;81:117–151. doi: 10.1152/physrev.2001.81.1.117. [DOI] [PubMed] [Google Scholar]
- Felber S, Breuer HP, Petruccione F, Honerkamp J, Hofmann KP. Stochastic simulation of the transducin GTPase cycle. Biophysical Journal. 1996;71:3051–3063. doi: 10.1016/S0006-3495(96)79499-7. [DOI] [PMC free article] [PubMed] [Google Scholar]
- Field GD, Rieke F. Mechanisms regulating variability of the single photon responses of mammalian rod photoreceptors. Neuron. 2002;35:733–747. doi: 10.1016/s0896-6273(02)00822-x. [DOI] [PubMed] [Google Scholar]
- Findlay JB, Barclay PL, Brett M, Davison M, Pappin DJ, Thompson P. The structure of mammalian rod opsins. Vision Research. 1984;24:1501–1508. doi: 10.1016/0042-6989(84)90312-2. [DOI] [PubMed] [Google Scholar]
- Firsov ML, Kolesnikov AV, Golobokova EY, Govardovskii VI. Two realms of dark adaptation. Vision Research. 2005;45:147–151. doi: 10.1016/j.visres.2004.08.005. [DOI] [PubMed] [Google Scholar]
- Forti S, Menini A, Rispoli G, Torre V. Kinetics of phototransduction in retinal rods of the newt Triturus cristatus. Journal of Physiology. 1989;419:265–295. doi: 10.1113/jphysiol.1989.sp017873. [DOI] [PMC free article] [PubMed] [Google Scholar]
- Gibson SK, Parkes JH, Liebman PA. Phosphorylation modulates the affinity of light-activated rhodopsin for G protein and arrestin. Biochemistry. 2000;39:5738–5749. doi: 10.1021/bi991857f. [DOI] [PubMed] [Google Scholar]
- Gillespie DT. A General method for numerically simulating the stochastic time evolution of coupled chemical reactions. Journal of Computational Physics. 1976;22:403–434. [Google Scholar]
- Gillespie DT. Exact stochastic simulation of coupled chemical reactions. Journal of Physical Chemistry. 1977;81:2340–2361. [Google Scholar]
- Gorczyca WA, Gray-Keller MP, Detwiler PB, Palczewski K. Purification and physiological evaluation of a guanylate cyclase activating protein from retinal rods. Proceedings of the National Academy of Sciences of the U.S.A. 1994;91:4014–4018. doi: 10.1073/pnas.91.9.4014. [DOI] [PMC free article] [PubMed] [Google Scholar]
- Gorodovikova EN, Philippov PP. The presence of a calciumsensitive p26-containing complex in bovine retina rod cells. FEBS Letters. 1993;335:277–279. doi: 10.1016/0014-5793(93)80746-h. [DOI] [PubMed] [Google Scholar]
- Granzin J, Wilden U, Choe HW, Labahn J, Krafft B, Buldt G. X-ray crystal structure of arrestin from bovine rod outer segments. Nature. 1998;391:918–921. doi: 10.1038/36147. [DOI] [PubMed] [Google Scholar]
- Gray-Keller MP, Detwiler PB. The calcium feedback signal in the phototransduction cascade of ver tebrate rods. Neuron. 1994;13:849–861. doi: 10.1016/0896-6273(94)90251-8. [DOI] [PubMed] [Google Scholar]
- Hamer RD. Analysis of Ca2+-dependent gain changes in PDE activation in vertebrate rod phototransduction. Molecular Vision. 2000a;6:265–286. [PMC free article] [PubMed] [Google Scholar]
- Hamer RD. Computational analysis of vertebrate phototransduction: Combined quantitative and qualitative modeling of dark- and light-adapted responses in amphibian rods. Visual Neuroscience. 2000b;17:679–699. doi: 10.1017/s0952523800175030. [DOI] [PMC free article] [PubMed] [Google Scholar]
- Hamer RD, Nicholas SC, Tranchina D, Liebman PA, Lamb TD. Multiple steps of phosphorylation of activated rhodopsin can account for the reproducibility of vertebrate rod single-photon responses. Journal of General Physiology. 2003;122:419–444. doi: 10.1085/jgp.200308832. [DOI] [PMC free article] [PubMed] [Google Scholar]
- Hamm HE, Bownds MD. Protein complement of rod outer segments of frog retina. Biochemistry. 1986;25:4512–4523. doi: 10.1021/bi00364a010. [DOI] [PubMed] [Google Scholar]
- He W, Wensel TG. RGS function in visual signal transduction. Methods in Enzymology. 2002;344:724–740. doi: 10.1016/s0076-6879(02)44751-9. [DOI] [PubMed] [Google Scholar]
- Hirsch JA, Schubert C, Gurevich VV, Sigler PB. The 2.8 A crystal structure of visual arrestin: A model for arrestin's regulation. Cell. 1999;97:257–269. doi: 10.1016/s0092-8674(00)80735-7. [DOI] [PubMed] [Google Scholar]
- Hsu YT, Molday RS. Modulation of the cGMP-gated channel of rod photoreceptor cells by calmodulin. Nature. 1993;361:76–79. doi: 10.1038/361076a0. [DOI] [PubMed] [Google Scholar]
- Kawamura S. Rhodopsin phosphorylation as a mechanism of cyclic GMP phosphodiesterase regulation by S-modulin. Nature. 1993;362:855–857. doi: 10.1038/362855a0. [DOI] [PubMed] [Google Scholar]
- Kawamura S, Hisatomi O, Kayada S, Tokunaga F, Kuo CH. Recoverin has S-modulin activity in frog rods. Journal of Biological Chemistry. 1993;268:14579–14582. [PubMed] [Google Scholar]
- Kawamura S, Murakami M. Calcium-dependent regulation of cyclic GMP phosphodiesterase by a protein from frog retinal rods. Nature. 1991;349:420–423. doi: 10.1038/349420a0. [DOI] [PubMed] [Google Scholar]
- Kennedy MJ, Lee KA, Niemi GA, Craven KB, Garwin GG, Saari JC, Hurley JB. Neuron. 2001;31:87–101. doi: 10.1016/s0896-6273(01)00340-3. [DOI] [PubMed] [Google Scholar]
- Keresztes G, Martemyanov KA, Krispel CM, Mutai H, Yoo PJ, Maison SF, Burns ME, Arshavsky VY, Heller S. Absence of the RGS9.Gbeta5 GTPase-activating complex in photoreceptors of the R9AP knockout mouse. Journal of Biological Chemistry. 2004;279:1581–1584. doi: 10.1074/jbc.C300456200. [DOI] [PubMed] [Google Scholar]
- Klenchin VA, Calver t PD, Bownds MD. Inhibition of rhodopsin kinase by recoverin. Further evidence for a negative feedback system in phototransduction. Journal of Biological Chemistry. 1995;270:16147–16152. doi: 10.1074/jbc.270.27.16147. [DOI] [PubMed] [Google Scholar]
- Koch KW, Stryer L. Highly cooperative feedback control of retinal rod guanylate cyclase by calcium ions. Nature. 1988;334:64–66. doi: 10.1038/334064a0. [DOI] [PubMed] [Google Scholar]
- Korenbrot JI, Miller DL. Cytoplasmic free calcium in dark-adapted retinal rod outer segments. Vision Research. 1989;29:939–948. doi: 10.1016/0042-6989(89)90108-9. [DOI] [PubMed] [Google Scholar]
- Koutalos Y, Nakatani K, Yau KW. The cGMP-phosphodiesterase and its contribution to sensitivity regulation in retinal rods. Journal of General Physiology. 1995;106:891–921. doi: 10.1085/jgp.106.5.891. [DOI] [PMC free article] [PubMed] [Google Scholar]
- Krispel CM, Chen CK, Simon MI, Burns ME. Prolonged photoresponses and defective adaptation in rods of Gbeta5−/− mice. Journal of Neuroscience. 2003;23:6965–6971. doi: 10.1523/JNEUROSCI.23-18-06965.2003. [DOI] [PMC free article] [PubMed] [Google Scholar]
- Krupnick JG, Gurevich VV, Benovic JL. Mechanism of quenching of phototransduction. Binding competition between arrestin and transducin for phosphorhodopsin. Journal of Biological Chemistry. 1997;272:18125–18131. doi: 10.1074/jbc.272.29.18125. [DOI] [PubMed] [Google Scholar]
- Kühn H, Wilden U. Assay of phosphorylation of rhodopsin in vitro and in vivo. Methods in Enzymology. 1982;81:489–496. doi: 10.1016/s0076-6879(82)81066-5. [DOI] [PubMed] [Google Scholar]
- Lagnado L, Cervetto L, McNaughton PA. Calcium homeostasis in the outer segments of retinal rods from the tiger salamander. Journal of Physiology. 1992;455:111–142. doi: 10.1113/jphysiol.1992.sp019293. [DOI] [PMC free article] [PubMed] [Google Scholar]
- Lamb TD. The involvement of rod photoreceptors in dark adaptation. Vision Research. 1981;21:1771–1782. doi: 10.1016/0042-6989(81)90211-x. [DOI] [PubMed] [Google Scholar]
- Lamb TD, Matthews HR, Torre V. Incorporation of calcium buffers into salamander retinal rods: A rejection of the calcium hypothesis of phototransduction. Journal of Physiology. 1986;372:315–349. doi: 10.1113/jphysiol.1986.sp016011. [DOI] [PMC free article] [PubMed] [Google Scholar]
- Lamb TD, McNaughton PA, Yau KW. Spatial spread of activation and background desensitization in toad rod outer segments. Journal of Physiology. 1981;319:463–496. doi: 10.1113/jphysiol.1981.sp013921. [DOI] [PMC free article] [PubMed] [Google Scholar]
- Lamb TD, Pugh EN., Jr. G-protein cascades: Gain and kinetics. Trends in Neuroscience. 1992;15:291–298. doi: 10.1016/0166-2236(92)90079-n. [DOI] [PubMed] [Google Scholar]
- Leibrock CS, Reuter T, Lamb TD. Dark adaptation of toad rod photoreceptors. Vision Research. 1994;34:2787–2800. doi: 10.1016/0042-6989(94)90048-5. [DOI] [PubMed] [Google Scholar]
- Leibrock CS, Reuter T, Lamb TD. Molecular basis of dark adaptation in rod photoreceptors. Eye. 1998;12:511–520. doi: 10.1038/eye.1998.139. [DOI] [PubMed] [Google Scholar]
- Leskov IB, Klenchin VA, Handy JW, Whitlock GG, Govardovskii VI, Bownds MD, Lamb TD, Pugh EN, Jr., Arshavsky VY. The gain of rod phototransduction: Reconciliation of biochemical and electrophysiological measurements. Neuron. 2000;27:525–537. doi: 10.1016/s0896-6273(00)00063-5. [DOI] [PubMed] [Google Scholar]
- Lishko PV, Martemyanov KA, Hopp JA, Arshavsky VY. Specific binding of RGS9-Gbeta 5L to protein anchor in photoreceptor membranes greatly enhances its catalytic activity. Journal of Biological Chemistry. 2002;277:24376–24381. doi: 10.1074/jbc.M203237200. [DOI] [PubMed] [Google Scholar]
- Makino CL, Dodd RL, Chen J, Burns ME, Roca A, Simon MI, Baylor DA. Recoverin regulates light-dependent phosphodiesterase activity in retinal rods. Journal of General Physiology. 2004;123:729–741. doi: 10.1085/jgp.200308994. [DOI] [PMC free article] [PubMed] [Google Scholar]
- Martemyanov KA, Arshavsky VY. Noncatalytic domains of RGS9-1.Gbeta 5L play a decisive role in establishing its substrate specificity. Journal of Biological Chemistry. 2002;277:32843–32848. doi: 10.1074/jbc.M205170200. [DOI] [PubMed] [Google Scholar]
- Martemyanov KA, Lishko PV, Calero N, Keresztes G, Sokolov M, Strissel KJ, Leskov IB, Hopp JA, Kolesnikov AV, Chen CK, Lem J, Heller S, Burns ME, Arshavsky VY. The DEP domain determines subcellular targeting of the GTPase activating protein RGS9 in vivo. Journal of Neuroscience. 2003;23:10175–10181. doi: 10.1523/JNEUROSCI.23-32-10175.2003. [DOI] [PMC free article] [PubMed] [Google Scholar]
- Matthews HR. Incorporation of chelator into guinea-pig rods shows that calcium mediates mammalian photoreceptor light adaptation. Journal of Physiology. 1991;436:93–105. doi: 10.1113/jphysiol.1991.sp018541. [DOI] [PMC free article] [PubMed] [Google Scholar]
- Matthews HR. Effects of lowered cytoplasmic calcium concentration and light on the responses of salamander rod photoreceptors. Journal of Physiology. 1995;484(Pt 2):267–286. doi: 10.1113/jphysiol.1995.sp020664. [DOI] [PMC free article] [PubMed] [Google Scholar]
- Matthews HR. Static and dynamic actions of cytoplasmic Ca2+ in the adaptation of responses to saturating flashes in salamander rods. Journal of Physiology. 1996;490:1–5. doi: 10.1113/jphysiol.1996.sp021123. [DOI] [PMC free article] [PubMed] [Google Scholar]
- Matthews HR, Murphy RL, Fain GL, Lamb TD. Photoreceptor light adaptation is mediated by cytoplasmic calcium concentration. Nature. 1988;334:67–69. doi: 10.1038/334067a0. [DOI] [PubMed] [Google Scholar]
- McCarthy ST, Younger RL, Owen WG. Free calcium concentrations in bullfrog rods determined in the presence of multiple forms of Fura-2. Biophysical Journal. 1994;67:2076–2089. doi: 10.1016/S0006-3495(94)80691-5. [DOI] [PMC free article] [PubMed] [Google Scholar]
- Melia TJ, Jr, Cowan CW, Angleson JK, Wensel TG. A comparison of the efficiency of G protein activation by ligand-free and light-activated forms of rhodopsin. Biophysical Journal. 1997;73:3182–3191. doi: 10.1016/S0006-3495(97)78344-9. [DOI] [PMC free article] [PubMed] [Google Scholar]
- Mendez A, Burns ME, Roca A, Lem J, Wu LW, Simon MI, Baylor DA, Chen J. Rapid and reproducible deactivation of rhodopsin requires multiple phosphorylation sites. Neuron. 2000;28:153–164. doi: 10.1016/s0896-6273(00)00093-3. [DOI] [PubMed] [Google Scholar]
- Miller JL, Dratz EA. Phosphorylation at sites near rhodopsin's carboxyl-terminus regulates light initiated cGMP hydrolysis. Vision Research. 1984;24:1509–1521. doi: 10.1016/0042-6989(84)90313-4. [DOI] [PubMed] [Google Scholar]
- Murnick JG, Lamb TD. Kinetics of desensitization induced by saturating flashes in toad and salamander rods. Journal of Physiology. 1996;495:1–13. doi: 10.1113/jphysiol.1996.sp021569. [DOI] [PMC free article] [PubMed] [Google Scholar]
- Nakatani K, Yau KW. Calcium and magnesium fluxes across the plasma membrane of the toad rod outer segment. Journal of Physiology. 1988;395:695–729. doi: 10.1113/jphysiol.1988.sp016942. [DOI] [PMC free article] [PubMed] [Google Scholar]
- Nikonov S, Engheta N, Pugh EN., Jr. Kinetics of recovery of the dark-adapted salamander rod photoresponse. Journal of General Physiology. 1998;111:7–37. doi: 10.1085/jgp.111.1.7. [DOI] [PMC free article] [PubMed] [Google Scholar]
- Nikonov S, Lamb TD, Pugh EN., Jr. The role of steady phosphodiesterase activity in the kinetics and sensitivity of the lightadapted salamander rod photoresponse. Journal of General Physiology. 2000;116:795–824. doi: 10.1085/jgp.116.6.795. [DOI] [PMC free article] [PubMed] [Google Scholar]
- Ohguro H, Palczewski K, Ericsson LH, Walsh KA, Johnson RS. Sequential phosphorylation of rhodopsin at multiple sites. Biochemistry. 1993;32:5718–5724. doi: 10.1021/bi00072a030. [DOI] [PubMed] [Google Scholar]
- Ohguro H, Johnson RS, Ericsson LH, Walsh KA, Palczewski K. Control of rhodopsin multiple phosphorylation. Biochemistry. 1994;33:1023–1028. doi: 10.1021/bi00170a022. [DOI] [PubMed] [Google Scholar]
- Ohguro H, Van Hooser JP, Milam AH, Palczewski K. Rhodopsin phosphorylation and dephosphorylation in vivo. Journal of Biological Chemistry. 1995;270:14259–14262. doi: 10.1074/jbc.270.24.14259. [DOI] [PubMed] [Google Scholar]
- Ohguro H, Rudnicka-Nawrot M, Buczylko J, Zhao X, Taylor JA, Walsh KA, Palczewski K. Structural and enzymatic aspects of rhodopsin phosphorylation. Journal of Biological Chemistry. 1996;271:5215–5224. doi: 10.1074/jbc.271.9.5215. [DOI] [PubMed] [Google Scholar]
- Ohyama T, Hackos DH, Frings S, Hagen V, Kaupp UB, Korenbrot JI. Fraction of the dark current carried by Ca2+ through cGMP-gated ion channels of intact rod and cone photoreceptors. Journal of General Physiology. 2000;116:735–754. doi: 10.1085/jgp.116.6.735. [DOI] [PMC free article] [PubMed] [Google Scholar]
- Palczewski K, Buczylko J, Kaplan MW, Polans AS, Crabb JW. Mechanism of rhodopsin kinase activation. Journal of Biological Chemistry. 1991;266:12949–12955. [PubMed] [Google Scholar]
- Pepperberg DR, Cornwall MC, Kahlert M, Hofmann KP, Jin J, Jones GJ, Ripps H. Light-dependent delay in the falling phase of the retinal rod photoresponse. Visual Neuroscience. 1992;8:9–18. doi: 10.1017/s0952523800006441. [DOI] [PubMed] [Google Scholar]
- Pepperberg DR, Jin J, Jones GJ. Modulation of transduction gain in light adaptation of retinal rods. Visual Neuroscience. 1994;11:53–62. doi: 10.1017/s095252380001110x. [DOI] [PubMed] [Google Scholar]
- Pfister C, Kühn H, Chabre M. Interaction between photoexcited rhodopsin and peripheral enzymes in frog retinal rods. Influence on the postmetarhodopsin II decay and phosphorylation rate of rhodopsin. European Journal of Biochemistry. 1983;136:489–499. doi: 10.1111/j.1432-1033.1983.tb07767.x. [DOI] [PubMed] [Google Scholar]
- Pugh EN., Jr. Variability in single photon responses: A cut in the Gordian knot of rod phototransduction? Neuron. 1999;23:205–208. doi: 10.1016/s0896-6273(00)80772-2. [DOI] [PubMed] [Google Scholar]
- Pugh EN, Lamb TD. Cyclic GMP and calcium: The internal messengers of excitation and adaptation in vertebrate photoreceptors. Vision Research. 1990;30:1923–1948. doi: 10.1016/0042-6989(90)90013-b. [DOI] [PubMed] [Google Scholar]
- Pugh EN, Jr., Lamb TD. Amplification and kinetics of the activation steps in phototransduction. Biochimica et Biophysica Acta. 1993;1141:111–149. doi: 10.1016/0005-2728(93)90038-h. [DOI] [PubMed] [Google Scholar]
- Pugh EN, Jr., Lamb TD. Phototransduction in vertebrate rods and cones: molecular mechanisms of amplification, recovery and lightadaptation. In: Stavenga DG, de Grip WJ, Pugh EN Jr., editors. Handbook of Biological Physics, Volume 3, Molecular Mechanisms of Visual Transduction. Elsevier Science B.V.; Amsterdam, Netherlands: 2000. pp. 183–255. [Google Scholar]
- Pulvermuller A, Palczewski K, Hofmann KP. Interaction between photoactivated rhodopsin and its kinase: Stability and kinetics of complex formation. Biochemistry. 1993;32:14082–14088. doi: 10.1021/bi00214a002. [DOI] [PubMed] [Google Scholar]
- Rieke F, Baylor DA. Molecular origin of continuous dark noise in rod photoreceptors. Biophysical Journal. 1996;71:2553–2572. doi: 10.1016/S0006-3495(96)79448-1. [DOI] [PMC free article] [PubMed] [Google Scholar]
- Rieke F, Baylor DA. Origin of reproducibility in the responses of retinal rods to single photons. Biophysical Journal. 1998a;75:1836–1857. doi: 10.1016/S0006-3495(98)77625-8. [DOI] [PMC free article] [PubMed] [Google Scholar]
- Rieke FB, Baylor DA. Single-photon detection by rod cells of the retina. Reviews of Modern Physics. 1998b;70:1027–1036. [Google Scholar]
- Rodieck RW. The First Steps in Seeing. Sinauer Associates, Inc.; Sunderland, Massachusetts: 1998. [Google Scholar]
- Sampath AP, Matthews HR, Cornwall MC, Fain GL. Bleached pigment produces a maintained decrease in outer segment Ca 2+ in salamander rods. Journal of General Physiology. 1998;111:53–64. doi: 10.1085/jgp.111.1.53. [DOI] [PMC free article] [PubMed] [Google Scholar]
- Schnapf JL. Dependence of the single photon response on longitudinal position of absorption in toad rod outer segments. Journal of Physiology. 1983;343:147–159. doi: 10.1113/jphysiol.1983.sp014886. [DOI] [PMC free article] [PubMed] [Google Scholar]
- Schneeweis DW, Schnapf JL. Photovoltage of rods and cones in the macaque retina. Science. 1995;268:1053–1056. doi: 10.1126/science.7754386. [DOI] [PubMed] [Google Scholar]
- Schroder K, Pulvermuller A, Hofmann KP. Arrestin and its splice variant Arr1-370A (p44). Mechanism and biological role of their interaction with rhodopsin. Journal of Biological Chemistry. 2002;277:43987–43996. doi: 10.1074/jbc.M206211200. [DOI] [PubMed] [Google Scholar]
- Skiba NP, Martemyanov KA, Elfenbein A, Hopp JA, Bohm A, Simonds WF, Arshavsky VY. RGS9-G beta 5 substrate selectivity in photoreceptors. Opposing effects of constituent domains yield high affinity of RGS interaction with the G protein-effector complex. Journal of Biological Chemistry. 2001;276:37365–37372. doi: 10.1074/jbc.M106431200. [DOI] [PubMed] [Google Scholar]
- Tamura T, Nakatani K, Yau KW. Calcium feedback and sensitivity regulation in primate rods. Journal of General Physiology. 1991;98:95–130. doi: 10.1085/jgp.98.1.95. [DOI] [PMC free article] [PubMed] [Google Scholar]
- Thompson P, Findlay JB. Phosphorylation of ovine rhodopsin. Identification of the phosphorylated sites. Biochemical Journal. 1984;220:773–780. doi: 10.1042/bj2200773. [DOI] [PMC free article] [PubMed] [Google Scholar]
- Torre V, Matthews HR, Lamb TD. Role of calcium in regulating the cyclic GMP cascade of phototransduction in retinal rods. Proceedings of the National Academy of Sciences of the U.S.A. 1986;83:7109–7113. doi: 10.1073/pnas.83.18.7109. [DOI] [PMC free article] [PubMed] [Google Scholar]
- Whitlock GG, Lamb TD. Variability in the time course of single photon responses from toad rods: Termination of rhodopsin's activity. Neuron. 1999;23:337–351. doi: 10.1016/s0896-6273(00)80784-9. [DOI] [PubMed] [Google Scholar]
- Wilden U. Duration and amplitude of the light-induced cGMP hydrolysis in ver tebrate photoreceptors are regulated by multiple phosphorylation of rhodopsin and by arrestin binding. Biochemistry. 1995;34:1446–454. doi: 10.1021/bi00004a040. [DOI] [PubMed] [Google Scholar]
- Wilden U, Kühn H. Light-dependent phosphorylation of rhodopsin: Number of phosphorylation sites. Biochemistry. 1982;21:3014–022. doi: 10.1021/bi00541a032. [DOI] [PubMed] [Google Scholar]
- Xu J, Dodd RL, Makino CL, Simon MI, Baylor DA, Chen J. Prolonged photoresponses in transgenic mouse rods lacking arrestin. Nature. 1997;389:505–509. doi: 10.1038/39068. [DOI] [PubMed] [Google Scholar]
- Yau KW. Phototransduction mechanism in retinal rods and cones. The Friedenwald Lecture. Investigative Ophthalmology and Visual Science. 1994;35:9–32. [PubMed] [Google Scholar]