

Abstract
Promoting myelin repair is one of the most promising therapeutic avenues in the field of myelin disorders. In future clinical trials, evaluation of remyelination will require a reliable and quantifiable myelin marker to be used as a surrogate marker. To date, MRI assessment lacks specificity for evaluating the level of remyelination within the brain. Here, we describe 1,4-bis(p-aminostyryl)-2-methoxy benzene (BMB), a synthesized fluorescent molecule, that binds selectively to myelin both ex vivo and in vivo. The binding of BMB to myelin allows the detection of demyelinating lesions in an experimental autoimmune encephalitis model of demyelination and allows a mean for quantifying myelin loss in dysmyelinating mutants. In multiple sclerosis brain, different levels of BMB binding differentiated remyelination in shadow plaques from either demyelinated lesions or normal-appearing white matter. After systemic injection, BMB crosses the blood–brain barrier and binds to myelin in a dose-dependent and reversible manner. Finally, we provide evidence that 11C-radiolabeled BMB can be used in vivo to image CNS myelin by positron-emission tomography in baboon. Our results provide a perspective for developing a brain myelin imaging technique by positron-emission tomography.
Keywords: multiple sclerosis, remyelination, leukodystrophy
Myelin is a unique structure in the nervous system that allows rapid, economic, and secure conduction of impulses along axons. The loss or lack of myelin resulting from an acquired or inherited disease may produce a delay or failure of conduction in affected fibers, with concomitant neurological dysfunction. In the human CNS, multiple sclerosis (MS) is the most common acquired demyelinating disease, affecting ≈2 million people worldwide (1). The leukodystrophies, induced by inherited enzyme deficiencies, also affect CNS white matter, resulting in abnormal formation, destruction, or turnover of myelin sheaths (2). Both acquired and inherited myelin disorders share a poor prognosis, leading to major disability in young people.
Spontaneous remyelination can occur in the CNS and was first demonstrated by electron microscopy of lesions in the adult mammalian spinal cord (3). Remyelination results in the formation of short and thin myelinated internodes, but it enables the restoration of a sufficient conduction along axons and allows some functional recovery (4, 5). In demyelinating diseases such as MS, this regenerative process does occur and sometimes proceeds to completion (6), but it is less efficient than in experimental animal models (7). Improving repair processes can theoretically be achieved by either promoting endogenous repair mechanisms or providing an exogenous source of myelinating cells by transplantation (8–10). Clinical trials are expected to be carried out in the latter field soon.
A major clinical issue of such trials is to assess and quantify myelin repair in vivo. To date, MRI is the reference test for diagnosing and monitoring the evolution of white-matter diseases (2, 11, 12). Unfortunately, an increase in signal intensity on dual-echo T2-weighted sequences reflects increased tissue water, provides only a nonspecific measure of the overall extent of macroscopic tissue injury (13), and does not specifically parallel the extent of demyelination and/or remyelination. Other MRI techniques such as magnetization transfer (MT) and diffusion tensor imaging allow a more precise assessment of the pathological mechanisms involved in human white-matter diseases. Reduced MT ratio probably reflects a loss of myelin, but also a reduction in axonal density (13, 14). Diffusion weighted imaging (DW-MRI) provides details on tissue microstructure and allows fiber tracking in the brain (15), but to date it has not been demonstrated that DW-MRI differentiates between myelin and axon injury. Therefore it is very important to develop a safe imaging technique aimed at quantifying CNS myelin. This goal might be achieved by using molecular imaging by positron-emission tomography (PET).
Here, we report that a Congo red derivative, 1,4-bis(p-aminostyryl)-2-methoxy benzene (BMB), stains CNS myelin both ex vivo and in vivo and can be used as a radiotracer for PET imaging.
Results
BMB Is a Quantifiable Marker of Myelinated Tracks ex Vivo and in Vivo.
The chemical structure of BMB confers spontaneous fluorescence when excited by light of wavelength ≈480 nm, allowing the analysis of its binding on CNS sections by fluorescence. When 1 mM BMB (0.34 mg/ml) was incubated for 15 min on postnatal P21 mouse brain sections, we obtained an intense fluorescence restricted to white-matter tracts such as the corpus callosum, rostral commissure, myelinated bundles of the striatum, brainstem, and deep white matter of the cerebellum (Fig. 1), whereas incubation of sections with the vehicle alone did not result in fluorescence of the myelinated areas (data not shown). Because myelin is known for its highly enriched lipid composition, we assessed the staining of BMB on cerebellar sections when lipids were removed by either a 10-min incubation in ethanol or a 20-min incubation in acetone. Fluorescence obtained in the white matter was not modified by these treatments compared with control conditions (data not shown), demonstrating that BMB did not bind to an hydrophobic lipid contained in myelin.
Fig. 1.

Fixation of BMB to myelinated areas of the postnatal mouse brain (P21). Note the strong fluorescence in myelinated structures such as the corpus callosum (CC), rostral commissure (RC), and myelinated bundles within the striatum (St) and brainstem (BS).
The interaction of BMB with myelin was further investigated by a binding experiment. Binding assays were performed by using an isolated myelin membrane subfraction and a control nonmyelin membrane fraction prepared at the same time. Free and bound BMB was determined from both myelin membranes and nonmyelin materials, which were incubated with BMB. The concentration of unbound BMB was not reduced by increasing amounts of pellet of other brain membranes and was close to the total concentration (10 μM) initially present (Fig. 2), suggesting virtually no binding to the nonmyelin fraction. In contrast, the concentration of unbound BMB decreased proportionally as the concentration of myelin increased, indicating a direct interaction between BMB and myelin membranes.
Fig. 2.

Binding of BMB on myelin fraction. Comparison of the concentration of free, unbound BMB, when applied to the isolated myelin sheaths and pellets of other brain membranes based on a spectroscopic assay. In these assays, 10 μM BMB was used for each preparation containing myelin or nonmyelin pellets at various protein concentrations ranging from 0.01 to 1.5 μg/ml. Each data point was an average of three experiments.
We then asked whether BMB could cross the blood–brain barrier. BMB (40 mg/kg) was injected i.p. into adult mice in a 200-μl volume of DMSO. Fluorescence was analyzed on sagittal sections of the cerebellum 4 h after the injection, and fluorescence intensity in the white matter was quantified in the same area by using openlab software (Fig. 3A). The level of fluorescence induced by BMB was 4- to 5-fold higher than the background fluorescence measured in controls receiving DMSO alone (Fig. 3B), indicating that BMB indeed crosses the blood–brain barrier and stains myelinated tissues. Staining in the cerebellum white matter was 2.13-fold higher than in the molecular layer (504 ± 54 versus 237 ± 11 arbitrary units of fluorescence). The staining in white matter was concentration-dependent, with an increasing level of fluorescence obtained for concentrations ranging from 1 to 40 mg/kg (Fig. 3C). A significant staining was rapidly detectable, with 50% of the maximal binding obtained 15 min after injection. The maximal binding of BMB in the white matter was observed 4 h after the i.p. injection and remained high for 24 h before returning to control values at 48 h (Fig. 3D). These data suggest that the fixation of BMB was reversible, but cleared slowly from the brain.
Fig. 3.

BMB crosses the blood–brain barrier. (A) After i.p. injection, BMB stains the cerebellar white matter. (B) The BMB-induced fluorescence was compared with the vehicle-induced fluorescence 4 h after injection. (C and D) The BMB fixation increased with the concentration injected (quantified 4 h after injection, C) and was reversible (40 mg/kg injected; D). Data shown represent the mean ± SD of at least three sections per mouse obtained from three animals for each concentration and time point.
To show that BMB could be used in vivo to quantify myelin loss, the binding of BMB to myelin was then quantified in two dysmyelinating mutants, the shiverer and the quaking mouse (Fig. 4). In the shiverer mutant, which presents a deletion of the myelin basic protein (MBP) gene (mbp), the staining with MBP antibody was absent, whereas residual myelin was visualized by anti-proteolipid protein (PLP) immunolabeling (data not shown). Staining of BMB in the white matter was strongly reduced with a mean value of 27.7% (SD, ±16.9) compared with control animals (same age, same strain; Fig. 4 A, B, and D). In quaking animals, MBP and PLP immunostaining, although reduced, was still present, allowing visualization of residual myelin. Staining of BMB was also reduced with a mean value of 45.5% (SD, ±19.6) compared with control animals (same age, same strain; Fig. 4 A, C, and E). Therefore, in these dysmyelinating mutants, the reduction of BMB binding parallels the decreased myelin content.
Fig. 4.

Quantification of myelin loss using BMB. BMB (40 mg/kg) was injected i.p. into WT and dysmyelinating (shiverer and quaking) animals, and fluorescence within the cerebellum white matter was quantified 4 h later. (A–C) Representative sections from BMB-injected animal are shown in WT (A), shiverer (B), and quaking (C). The mean level of nonspecific staining (from three vehicle-injected WT animals) was subtracted from each value to obtain specific staining. (D and E) Fluorescence intensity of mutant slices (three different mice per condition with at least five different slices per animal) is expressed as a percentage (± SD) of the average fluorescence in WT animals. There was a 72.3% and 55.5% reduction of BMB staining in shiverer and quaking mutants, respectively.
BMB Allows the Visualization of Demyelinated Lesions.
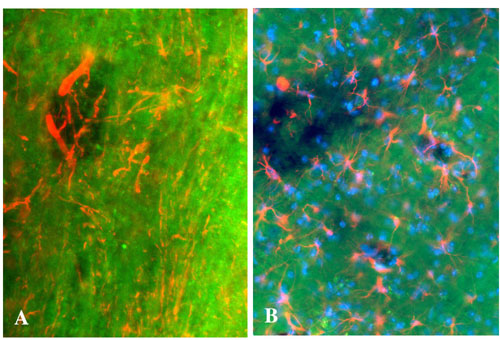
We next examined whether BMB could be used to identify demyelinated lesions in demyelinating models and MS. Experimental autoimmune encephalitis (EAE) was induced in C57BL/6 mice by injecting an encephalitogenic peptidic fragment (residues 35–55) of the myelin oligodendrocyte glycoprotein, and BMB (40 mg/kg) was injected i.p. at day 21 after immunization, when the clinical disability was moderate to severe (stages 2–3 of the scale, see Materials and Methods). BMB staining was examined 4 h later. Most of the demyelinated lesions, identified as a lack of staining with the anti-PLP antibody (Fig. 5A), were detected in the cervical spinal cord. Each PLP-demyelinated lesion was characterized by a similar lack of BMB staining on the adjacent sections (Fig. 5B). To verify that, in this EAE model, the detected lesions did not consist of holes, with disappearance of all cell types, BMB staining was combined with other immunolabeling, using anti-glial fibrillary acidic protein antibody for astrocytes, 2F11 antibody for neurons, and Hoechst staining for nuclei. These experiments showed the presence of denuded axons and astrocytes in the lesions (see Fig. 8, which is published as supporting information on the PNAS web site).
Fig. 5.

Visualization of EAE and MS demyelinated lesions by using BMB. (A and B) When BMB (40 mg/kg) was injected i.p. into mice at day 21 after induction of EAE, all demyelinated lesions identified with PLP immunostaining (arrows, A) were also visualized on adjacent sections with BMB (arrows, B). (C and D) On postmortem adjacent sections of human MS brain, demyelinated PLP-negative plaques (dashed line, C) were also identified after ex vivo incubation of 1 mM BMB (dashed line, D). (E and F) In remyelinated shadow plaques (arrowheads), BMB staining showed intermediate intensity between demyelinated plaques (∗) and normal-appearing white matter (+) [luxol staining (E); BMB staining (F); demyelinated lesion is delineated by the dashed line]. All lines were drawn by hand. (Scale bars: A and B, 30 μm; C and D, 500 μm; E and F, 150 μm.)
Because EAE is an animal model for MS, we then examined whether BMB also binds to human myelin and could be used for detecting demyelinated lesions in the MS brain. Brain tissue sections from two MS patients were incubated for 15 min with 1 mM BMB, and adjacent sections were treated with either anti-PLP mAb or Luxol fast blue staining. In humans, the BMB staining of the normal-appearing white matter was the same as in rodents. MS demyelinated lesions, identified as a lack of staining with PLP antibody (Fig. 5C), were also visualized as a decrease in the BMB staining (Fig. 5D). We further analyzed the level of BMB staining in shadow plaques, which correspond to remyelinated areas. Shadow plaques were identified by Luxol fast blue staining and appeared as less-stained areas (Fig. 5E). These remyelinated lesions were also easily distinguished from demyelinated lesions (absence of staining) and normal-appearing white matter (bright staining) by using BMB (Fig. 5F). Together, these data suggested that BMB was a suitable marker not only for identifying demyelination, but also for evaluating myelin repair.
[11C]BMB Is Suitable for PET Imaging in the CNS.
Ex vivo brain kinetics in rats.
The kinetics of accumulation of [11C]BMB within the brain was the same for the regions analyzed, pons, cerebellum, striatum, and cortex with subcortical white matter (Fig. 6). As soon as 5 min postinjection (p.i.), [11C]BMB was retained in the brain compared with the plasma and blood compartments. The radioactivity further increased in the brain up to 15 min p.i., and thereafter remained quite stable until 45 min p.i., whereas it slowly decreased in the blood and plasma compartments throughout the experiment. At 45 min p.i. the mean radioactivity retained in the brain was 5.5-fold higher than in the plasma and 6.8-fold higher than in blood, demonstrating that there was indeed an accumulation of [11C]BMB in the CNS. However, this experiment did not allow us to differentiate white-matter retention from gray-matter retention, because both structures were present in all of the samples analyzed.
Fig. 6.

Fixation of [11C]BMB in the rodent CNS. [11C]BMB was injected i.v. into rats, and animals were killed at different time points (5, 15, 45 min). Blood samples were collected, the CNS and peripheral nervous system samples were quickly dissected out, and the radioactivity was quantified in each sample. There was a significant accumulation within CNS structures (curves 1–4) compared with blood (curve 6) and plasma (curve 7). Sciatic nerves showed intermediate levels (curve 5). Measures shown represent the mean of three rats analyzed at each time point.
In vivo brain kinetic by PET in baboon.
Validation of the in vivo use of [11C]BMB as a PET radiotracer was performed in a baboon. A 99-MBq dose of [11C]BMB was injected i.v. and followed by a rapid distribution phase in the blood compartment (≈5 min) with a similar kinetic in blood and plasma (data not shown). In the CNS there was a higher uptake in the subcortical white matter than in adjacent cortical areas when frontal, parietal, or cerebellar regions were considered (Fig. 7A–E). The radioactive concentration (expressed as percentage of injected dose per 100 ml of tissue) rapidly increased to reach a peak between T 10 min and T 20 min, and then slowly decreased. Once the peak was reached, the uptake was greater in myelinated areas compared with the adjacent cortex in each area studied. Nevertheless, the level of radioactivity, although slowly decreasing, remained quite high in several gray-matter regions, especially the thalamus and putamen (Fig. 7F). Because of the short half-life of [11C] it was not possible to continue PET examination for >100–110 min.
Fig. 7.

CNS PET imaging using [11C]BMB. [11C]BMB was injected i.v. (99 MBq) to an anesthetized baboon, and a 110-min PET examination was performed by using an ECAT HR+ camera (Siemens Medical Solution, Knoxville, TN). (A and B) The frontal coronal slice (A) and the cerebellar axial slice (B) from the PET examination were superimposed onto the corresponding slices of the brain MRI scan. PET images shown correspond to the activity between 80 and 110 min. (Magnification: A, ×0.11; B, ×0.15.) (C–E) Comparison of the radioactivity (expressed in percent of injected dose per 100 ml of brain tissue) obtained in subcortical white matter and adjacent cortical area, in frontal (C), cerebellar (D), and parietal (E) regions. Note that fixation of the tracer in white matter became higher than in the adjacent cortex after 10–20 min. (F) Comparison of the radioactivity in several regions of gray matter.
Discussion
To date the diagnosis and the monitoring of myelin disorders in humans has been performed with the help of MRI examination (12, 13). However, despite its high sensitivity and good spatial resolution, this technique lacks specificity for quantifying myelin loss and image remyelination (16, 17). Promoting myelin repair is one of the most promising therapeutical perspectives in the field of myelin disorder (18). Once such a strategy is available for human clinical trials, there will be a crucial need for a good quantifiable myelin marker that may be used as a surrogate endpoint.
The present study demonstrates that BMB, a Congo red derivative, is a suitable molecular probe for staining myelin in the CNS, either ex vivo or in vivo, and that its chemical structure allows radiolabeling with 11C, which opens the possibility for developing myelin imaging by PET.
The selectivity of BMB fixation on myelin is apparent by several observations: (i) this compound stains normal-appearing white matter in animals and humans; (ii) its fixation is drastically decreased in demyelinating lesions; and (iii) the level of binding differs between normal-appearing white matter, remyelinated shadow plaques, and demyelinated lesions in MS brain. This selectivity is corroborated by the binding assays showing that BMB did not bind to nonmyelin membranes. Finally, it is also strengthened by the recent report (19) showing that two other squarylium-based dyes with a structure reminiscent of that of Congo red could also stain myelin. However, the question of the molecular target of BMB within myelin remains to be deciphered. As BMB is a Congo red derivative, it should share some binding properties with other structurally related compounds. Several Congo red derivatives, for example, Chrysamine-G (20), methoxy-X04 (21), or X-34 (22), have been synthesized to stain amyloid deposits in Alzheimer’s disease. All of these molecules are thought to bind preferentially amyloid-like protein with a β-pleated sheet conformation (23, 24). Moreover, a large array of at least five adjacent β-sheet structures has been hypothesized to be the necessary structural component for binding of this class of compounds to amyloid fibrils (20, 23). Of outstanding interest, such a structure containing five β-pleated sheets has been described in MBP, one of the major myelin proteins in the CNS (25). Accordingly, there was a profound, but not total, decrease in BMB binding in shiverer mice, which totally lack MBP (26, 27). In quaking mice, whereas the primitive mutation of the Qk RNA binding protein also affects to some extent MBP expression (28), there is not a complete disappearance of MBP. Interestingly, the decrease in BMB staining is less pronounced in the Qk than in the shiverer mouse. These findings, and the lower level of binding in the sciatic nerve, which contains less MBP in myelin, are compatible with a predominant binding of BMB to MBP. However, because BMB staining on myelin, although largely reduced, is still present in shiverer mice, other putative targets have to be considered. We evaluated three putative candidate molecules expressed by CNS myelin: myelin oligodendrocyte glycoprotein (MOG), LPA1, and S1P5. Invalidation of these genes did not affect the myelin content of the corresponding mutants (29–32). We found no modifications of BMB staining in the MOG−/−, LPA−/−, and S1P5−/− null mutants (data not shown), indicating that none of these three molecules was a target for BMB. Therefore, to date, the molecular target of BMB remains to be clarified.
Because of its fluorescent properties, BMB allows simple staining of myelinated areas in WT and demyelinated animals, either ex vivo or after in vivo injection. Interestingly, such a simple myelin staining could be combined with immunohistochemistry using, for example, rhodamine as fluorochrome. Therefore this marker could simplify several experimental procedures currently used to detect demyelination and remyelination. In addition, using a software (openlab) aimed at quantifying fluorescence, we were able to evaluate the level of myelin loss in the two dysmyelinating mutants analyzed. Such a quantitative technique could also be useful for quantifying remyelination in animals, either spontaneous or that promoted by pharmacological tools. Indeed, the development of any strategy of remyelination for human diseases will require positive results from experimental animal models. Evaluation of myelin repair in such models usually needs time-consuming quantification of remyelinated internodes, and a simpler quantifiable marker of myelin loss and repair would drastically simplify the selection of putative promyelinating molecules.
BMB also displayed some of the prerequisites to develop a radiotracer for PET imaging: it was radiolabeled with a positron emitter, [11C] (half life: 20.38 min); it crosses the blood–brain barrier, accumulates into the brain, and clears slowly from the brain. However, it remains to be definitively demonstrated that [11C]BMB binds specifically to brain myelin in a saturable manner, and the precise kinetic rate constants of the binding process remain to be defined as well. The advantage of small-molecule probes such as BMB is that they can be readily modified with a wide variety of analogs that can be designed and synthesized. This allows for extensive structure–activity relationship studies and facilitates identification of lead compounds with optimal in vitro binding properties and in vivo pharmacokinetic profiles. For example, in the development of amyloid imaging radiotracers, several Congo red derivatives were synthesized with better permeability to the brain (20) or increased affinity to the target (22) than the parental compound. In this respect, it is possible that BMB could bind to pathological lesions such as amyloid plaques, although it should be relatively easy to exclude in the context of demyelinating diseases. In the case of myelin imaging, to optimize the target to background uptake, the evaluation of several compounds might be fruitful. When the baboon’s brain was studied by PET, we observed a higher retention of [11C]BMB in subcortical white matter than in adjacent cortex. However, there was still some retention of the signal in gray structures, especially thalamus and striatum. This retention may be related to the many myelinated fibers present in these structures (33), but could also be caused by blood flow-dependent delivery in these highly vascularized regions as the blood flow dependence of BMB has not yet been determined. To minimize the influence of nonspecific retention, extending the duration of the PET examination, using a radionuclide with longer half-life such as 18F (half life = 109.8 min) and quantifying the signal during the latest frames may be useful. Preservation of myelin staining during a longer examination should be achievable considering the very slow clearance of BMB from myelin that we have observed in mice. Such improvement in the imaging procedure, together with the selection of the optimal lead compound, should allow an optimal elimination of unbound and nonspecifically bound compound and the enhancement of the contrast between white matter and gray matter and between demyelinated lesion and surrounding white matter. Indeed, because of the partial volume effect and the relatively low resolution of PET, it has to be kept in mind that signal detection could be problematic for small demyelinating lesions, and the best contrast possible will be required.
In conclusion, our results provide evidence that small molecular probes structurally related to Congo red such as BMB could be used as myelin markers in either the animal or human CNS. Labeling of such molecules with a radionuclide raises the possibility of developing myelin imaging techniques by PET. This technique could allow improved understanding of myelin disorders and a means of assessing myelin repair and the efficacy of promyelinating therapeutics.
Materials and Methods
Animals.
Experiments on all animals were in strict accordance with the recommendations of the European Community (86/609/CEE) and the French National Committee (Décret 87/848) for the care and use of laboratory animals.
Control mice were from either the OF1 or C57BL/6J strains, and rats were from the Wistar strain (Iffacredo, L’Arbresle, France). Homozygous shiverer (Shi) mutants were from Institut National de la Santé et de la Recherche Médicale’s animal room facility, heterozygous quaking (Qk) mice were obtained from The Jackson Laboratory, and homozygous Qkqk were obtained by crossing heterozygous animals. The monkey was a Papio anubis baboon from Commissariat à l’Energie Atomique animal room facilities.
BMB Synthesis.
The detailed synthetic procedures of BMB are provided in Supporting Text, which is published as supporting information on the PNAS web site.
Briefly, the key steps (as shown in Scheme 1) were: synthesis of 1,4-bis(bromomethyl)-2-methoxy-benzene (i); synthesis of 1,4-bis(diethoxy-phosphonylmethyl)-2-methoxy-benzene (ii); synthesis of 1,4-bis(4-nitrostyryl)-2-methoxy-benzene (iii); and synthesis of 1,4-bis(4-aminostyryl)-2-methoxy-benzene (iv).
Scheme. 1.

Chemical synthesis of BMB. (a) N-bromosuccinimide, (PhCO)2O2, reflux, 44%. (b) P(OEt)3, reflux, 56%. (c) NaH, 4-nitrobenzaldehyde, 70°C to reflux, 54%. (d) SnCl2, EtOH, reflux, 80%.
For radiolabeling, the methoxy group of compound iii was first converted to a hydroxyl group to give (E,E)-1,4-bis(4′-nitro-styryl)-2-methoxy-benzene and subsequent reduction of the nitro groups yielded (E,E)-1,4-bis(4′-amino-styryl)-2-hydroxy-benzene, which was used as the precursor for subsequent radiolabeling.
Radiosynthesis of [11C]BMB.
BMB was labeled with carbon-11 (T1/2 = 20.38 min) in the 2-position of the central benzene ring by using the corresponding (E,E)-1,4-bis(4′-amino-styryl)-2-hydroxy-benzene as a precursor and the highly efficient methylation reagent [11C]methyl triflate (see Supporting Text) (34).
Antibodies.
Mouse anti-MBP mAb (IgG1; Euromedex, Souffelweyersheim, France) was diluted 1:50. Rat anti-PLP mAb was diluted 1:10 (gift from K. Ikenaka, University of Okasaki, Okasaki, Japan). Rabbit polyclonal anti-glial fibrillary acidic protein Ab (DAKO) was diluted 1/400. Mouse antiphosphorylated neurofilament IgG1 mAb (2F11; DAKO) was diluted 1/500. Alexa 594-conjugated sheep anti-mouse IgG1, goat anti-rat IgG, and goat anti-rabbit IgG were from Molecular Probes and diluted 1:100.
Immunohistochemistry and BMB Staining.
Mice were perfused intracardially with 4% paraformaldehyde in PBS. The whole brains were postfixed overnight at 4°C in the same fixative, cryoprotected for several hours at 4°C in PBS containing 15% sucrose, embedded in 15% sucrose and 7.5% gelatin in PBS, and frozen in melting isopentane. Sections (10 μm thick) were cut on a Microm cryostat and collected on RNase-free Superfrost slides (Menzer-Glaser, Braunschweig, Germany).
For ex vivo labeling of mouse and human sections with BMB, a BMB solution (1 mM diluted in DMSO) was incubated for 15 min at room temperature, before being extensively washed in PBS. For in vivo staining in mice, 200 μl of a BMB solution diluted in DMSO was injected i.p. into animals at a final dose ranging from 1 mg/kg (20 μg in 200 μl) to 40 mg/kg (800 μg in 200 μl). Animals were then perfused at various time points after injection (from 5 min to 48 h later).
Postmortem human CNS tissue from MS brains was provided by D. Seilhean (Salpetriere Brain Tissue Bank, Paris). For the purpose of this work, tissues from two different cases were analyzed. Frozen blocks of CNS tissue (2–4 cm3) were postfixed by immersion in 4% paraformaldehyde in PBS for 10 min, and 10-μm cryostat sections were mounted onto Superfrost slides. To identify demyelinated or remyelinated plaques, adjacent sections were either stained with Luxol fast blue/periodic acid Schiff or immunolabeled with a PLP antibody (35).
All images obtained in mice were captured by using openlab software for Macintosh (improvision, version 3.04). Quantification of fluorescence with openlab software was performed in the cerebellum white matter in a constant area of interest.
Induction of EAE.
EAE was induced in C57BL/6 mice by injecting an encephalitogenic peptidic fragment (residues 35–55) of the myelin oligodendrocyte glycoprotein (36, 37). Mice were weighed and scored for disease on a daily basis. Disease severity was assessed by using a scale ranging from 0 to 5: 0, normal; 1, limp tail; 2, mild paraparesis or ataxic gait; 3, complete paraparesis; 4, tetraparesis; and 5, moribund or death. Animals were examined for BMB staining at day 21 after EAE induction.
Binding of BMB to Myelin Fractions.
Details about the procedure are provided in Supporting Text. Briefly, adult rat brains were homogenized and myelin membranes were isolated from other nonmyelin membranes by ultracentrifugation in a sucrose gradient. Each sample was then incubated with an increasing concentration of BMB, and the concentration of bound and unbound BMB was assessed by UV spectrometer.
Kinetics of Brain Uptake of [11C]BMB.
[11C]BMB (1.6–1.9 MBq) was injected in the tail vein of male Wistar rats. Animals were killed by decapitation 5, 15, and 45 min later (n = 3 rats per time point). Samples of blood, sciatic nerve, and brain regions (cortex and subcortical white matter, striatum, cerebellum, pons) were removed and weighed, and their radioactivity was measured. Uptake was expressed as the percentage of injected dose per gram of tissue.
PET Data Acquisition and Analysis.
Before the PET data acquisition, the baboon received ketamine (10 mg/kg i.m.). After being intubated, the animal was artificially ventilated and maintained anesthetized with 66% N2O/1% isoflurane (ventilator OAV 7710; Ohmeda, Madison, WI). The PET experiment was performed with an HR+ Exact positron tomograph (Siemens Medical Solution, Knoxville, TN). This scanner allows simultaneous acquisition of 63 slices every 2.2 mm with spatial and axial resolutions of 4.5 mm. Transmission scans were acquired for 15 min by using three retractable 68Germanium rod sources, subsequently used for attenuation correction. The image acquisition started (T 0 min) with the i.v. injection of [11C]BMB (99 MBq; specific radioactivity, 3 GBq per μmol) and lasted 110 min (T 110 min). Thirty-seven images were acquired with scan duration starting from 30 s (frames 1–4) and increasing up to 10 min during the experiment.
Arterial blood samples (n = 19) were withdrawn from a femoral artery, and blood and plasma radioactivity was measured in a gamma counter and plotted versus time after correction for [11C].
MRI.
The animal was submitted to MRI scan on a 1.5-tesla SIGNA system (General Electric). A T1-weighted inversion-recovery sequence in 3D mode and a 256 × 192 matrix over 124 slices (1.5 mm thick) was used to generate the magnetic resonance images compatible with the PET images.
PET Data Analysis.
Volumes of interest (VOI) were delineated in 3D on magnetic resonance T1 images. Coregistration of PET images to the corresponding magnetic resonance images was used to ensure the consistency of the anatomical localization of [11C]BMB cerebral binding. To generate each regional time activity curve, the mean radioactivity in the VOI was calculated for each frame, corrected for [11C] decay, and plotted versus time, expressed as percent of injected dose per 100 ml of tissue.
Supplementary Material
Acknowledgments
We thank Drs. S. D. Styren and J. Merril for bringing the binding of BMB to white matter to our attention, R. Liblau for the generation of EAE mice, and A. Williams for helpful discussion and careful reading of this article. This work was supported by grants from the European Leukodystrophy Association (to B.S.), Institut National de la Santé et de la Recherche Médicale, Commissariat à l’Energie Atomique, Association du Recherché sur la Sclerose en Plaque, the National Multiple Sclerosis Society (to Y.W.), and the Dana Foundation (to Y.W.).
Abbreviations
- BMB
1,4-bis(p-aminostyryl)-2-methoxy benzene
- PET
positron-emission tomography
- EAE
experimental autoimmune encephalitis
- MS
multiple sclerosis
- MBP
myelin basic protein
- PLP
proteolipid protein.
Footnotes
Conflict of interest statement: No conflicts declared.
This paper was submitted directly (Track II) to the PNAS office.
References
- 1.Compston A., Coles A. Lancet. 2002;359:1221–1231. doi: 10.1016/S0140-6736(02)08220-X. [DOI] [PubMed] [Google Scholar]
- 2.Cheon J. E., Kim I. O., Hwang Y. S., Kim K. J., Wang K. C., Cho B. K., Chi J. G., Kim C. J., Kim W. S., Yeon K. M. Radiographics. 2002;22:461–476. doi: 10.1148/radiographics.22.3.g02ma01461. [DOI] [PubMed] [Google Scholar]
- 3.Bunge M. B., Bunge R. P., Ris H. J. Biophys. Biochem. Cytol. 1961;10:67–94. doi: 10.1083/jcb.10.1.67. [DOI] [PMC free article] [PubMed] [Google Scholar]
- 4.Jeffery N. D., Blakemore W. F. Brain. 1997;120:27–37. doi: 10.1093/brain/120.1.27. [DOI] [PubMed] [Google Scholar]
- 5.Smith K. J., Blakemore W. F., McDonald W. I. Brain. 1981;104:383–404. doi: 10.1093/brain/104.2.383. [DOI] [PubMed] [Google Scholar]
- 6.Perier O., Gregoire A. Brain. 1965;88:937–952. doi: 10.1093/brain/88.5.937. [DOI] [PubMed] [Google Scholar]
- 7.Franklin R. J. Nat. Rev. Neurosci. 2002;3:705–714. doi: 10.1038/nrn917. [DOI] [PubMed] [Google Scholar]
- 8.Lubetzki C., Williams A., Stankoff B. Curr. Opin. Neurol. 2005;18:237–244. doi: 10.1097/01.wco.0000169739.83793.e0. [DOI] [PubMed] [Google Scholar]
- 9.Duncan I. D., Grever W. E., Zhang S. C. Mol. Med. Today. 1997;3:554–561. doi: 10.1016/S1357-4310(97)01162-3. [DOI] [PubMed] [Google Scholar]
- 10.Stangel M., Hartung H. P. Prog. Neurobiol. 2002;68:361–376. doi: 10.1016/s0301-0082(02)00105-3. [DOI] [PubMed] [Google Scholar]
- 11.Filippi M., Rocca M. A., Falini A., Caputo D., Ghezzi A., Colombo B., Scotti G., Comi G. NeuroImage. 2002;15:537–546. doi: 10.1006/nimg.2001.1023. [DOI] [PubMed] [Google Scholar]
- 12.Barkovich A. J. J. Inherited Metab. Dis. 2005;28:311–343. doi: 10.1007/s10545-005-5952-z. [DOI] [PubMed] [Google Scholar]
- 13.Filippi M., Falini A., Arnold D. L., Fazekas F., Gonen O., Simon J. H., Dousset V., Savoiardo M., Wolinsky J. S. J. Magn. Reson. Imaging. 2005;21:669–675. doi: 10.1002/jmri.20336. [DOI] [PubMed] [Google Scholar]
- 14.Filippi M., Bozzali M., Comi G. J. Neurol. Sci. 2001;183:69–72. doi: 10.1016/s0022-510x(00)00471-8. [DOI] [PubMed] [Google Scholar]
- 15.Le Bihan D., Mangin J. F., Poupon C., Clark C. A., Pappata S., Molko N., Chabriat H. J. Magn. Reson. Imaging. 2001;13:534–546. doi: 10.1002/jmri.1076. [DOI] [PubMed] [Google Scholar]
- 16.Barkhof F., Bruck W., De Groot C. J., Bergers E., Hulshof S., Geurts J., Polman C. H., van der Valk P. Arch. Neurol. 2003;60:1073–1081. doi: 10.1001/archneur.60.8.1073. [DOI] [PubMed] [Google Scholar]
- 17.Barkhof F. Mult. Scler. 1997;3:129–132. doi: 10.1177/135245859700300212. [DOI] [PubMed] [Google Scholar]
- 18.Dubois-Dalcq M., Ffrench-Constant C., Franklin R. J. Neuron. 2005;48:9–12. doi: 10.1016/j.neuron.2005.09.004. [DOI] [PubMed] [Google Scholar]
- 19.Xiang Z., Nesterov E. E., Skoch J., Lin T., Hyman B. T., Swager T. M., Bacskai B. J., Reeves S. A. J. Histochem. Cytochem. 2005;53:1511–1516. doi: 10.1369/jhc.5A6704.2005. [DOI] [PMC free article] [PubMed] [Google Scholar]
- 20.Klunk W. E., Debnath M. L., Pettegrew J. W. Neurobiol. Aging. 1994;15:691–698. doi: 10.1016/0197-4580(94)90050-7. [DOI] [PubMed] [Google Scholar]
- 21.Klunk W. E., Bacskai B. J., Mathis C. A., Kajdasz S. T., McLellan M. E., Frosch M. P., Debnath M. L., Holt D. P., Wang Y., Hyman B. T. J. Neuropathol Exp. Neurol. 2002;61:797–805. doi: 10.1093/jnen/61.9.797. [DOI] [PubMed] [Google Scholar]
- 22.Styren S. D., Hamilton R. L., Styren G. C., Klunk W. E. J. Histochem. Cytochem. 2000;48:1223–1232. doi: 10.1177/002215540004800906. [DOI] [PubMed] [Google Scholar]
- 23.Klunk W. E., Pettegrew J. W., Abraham D. J. J. Histochem. Cytochem. 1989;37:1273–1281. doi: 10.1177/37.8.2666510. [DOI] [PubMed] [Google Scholar]
- 24.Glenner G. G., Eanes E. D., Page D. L. J. Histochem. Cytochem. 1972;20:821–826. doi: 10.1177/20.10.821. [DOI] [PubMed] [Google Scholar]
- 25.Ridsdale R. A., Beniac D. R., Tompkins T. A., Moscarello M. A., Harauz G. J. Biol. Chem. 1997;272:4269–4275. doi: 10.1074/jbc.272.7.4269. [DOI] [PubMed] [Google Scholar]
- 26.Readhead C., Hood L. Behav. Genet. 1990;20:213–234. doi: 10.1007/BF01067791. [DOI] [PubMed] [Google Scholar]
- 27.Dupouey P., Jacque C., Bourre J. M., Cesselin F., Privat A., Baumann N. Neurosci. Lett. 1979;12:113–118. doi: 10.1016/0304-3940(79)91490-3. [DOI] [PubMed] [Google Scholar]
- 28.Li Z., Zhang Y., Li D., Feng Y. J. Neurosci. 2000;20:4944–4953. doi: 10.1523/JNEUROSCI.20-13-04944.2000. [DOI] [PMC free article] [PubMed] [Google Scholar]
- 29.Delarasse C., Daubas P., Mars L. T., Vizler C., Litzenburger T., Iglesias A., Bauer J., Della Gaspera B., Schubart A., Decker L., et al. J. Clin. Invest. 2003;112:544–553. doi: 10.1172/JCI15861. [DOI] [PMC free article] [PubMed] [Google Scholar]
- 30.Stankoff B., Barron S., Allard J., Barbin G., Noel F., Aigrot M. S., Premont J., Sokoloff P., Zalc B., Lubetzki C. Mol. Cell Neurosci. 2002;20:415–428. doi: 10.1006/mcne.2002.1129. [DOI] [PubMed] [Google Scholar]
- 31.Harrison S. M., Reavill C., Brown G., Brown J. T., Cluderay J. E., Crook B., Davies C. H., Dawson L. A., Grau E., Heidbreder C., et al. Mol. Cell Neurosci. 2003;24:1170–1179. doi: 10.1016/j.mcn.2003.09.001. [DOI] [PubMed] [Google Scholar]
- 32.Jaillard C., Harrison S., Stankoff B., Aigrot M. S., Calver A. R., Duddy G., Walsh F. S., Pangalos M. N., Arimura N., Kaibuchi K., et al. J. Neurosci. 2005;25:1459–1469. doi: 10.1523/JNEUROSCI.4645-04.2005. [DOI] [PMC free article] [PubMed] [Google Scholar]
- 33.Hasegawa M., Houdou S., Mito T., Takashima S., Asanuma K., Ohno T. Brain Dev. 1992;14:1–6. doi: 10.1016/s0387-7604(12)80271-3. [DOI] [PubMed] [Google Scholar]
- 34.Nagren K., Muller L., Halldin C., Swahn C. G., Lehikoinen P. Nucl. Med. Biol. 1995;22:235–239. doi: 10.1016/0969-8051(94)00083-v. [DOI] [PubMed] [Google Scholar]
- 35.Charles P., Reynolds R., Seilhean D., Rougon G., Aigrot M. S., Niezgoda A., Zalc B., Lubetzki C. Brain. 2002;125:1972–1979. doi: 10.1093/brain/awf216. [DOI] [PubMed] [Google Scholar]
- 36.Stefferl A., Brehm U., Linington C. J. Neural Transm. 2000;(Suppl.):123–133. doi: 10.1007/978-3-7091-6284-2_10. [DOI] [PubMed] [Google Scholar]
- 37.Linington C., Berger T., Perry L., Weerth S., Hinze-Selch D., Zhang Y., Lu H. C., Lassmann H., Wekerle H. Eur. J. Immunol. 1993;23:1364–1372. doi: 10.1002/eji.1830230627. [DOI] [PubMed] [Google Scholar]
Associated Data
This section collects any data citations, data availability statements, or supplementary materials included in this article.