Abstract
We describe a finite-element model of mast cell calcium dynamics that incorporates the endoplasmic reticulum's complex geometry. The model is built upon a three-dimensional reconstruction of the endoplasmic reticulum (ER) from an electron tomographic tilt series. Tetrahedral meshes provide volumetric representations of the ER lumen, ER membrane, cytoplasm, and plasma membrane. The reaction-diffusion model simultaneously tracks changes in cytoplasmic and ER intraluminal calcium concentrations and includes luminal and cytoplasmic protein buffers. Transport fluxes via PMCA, SERCA, ER leakage, and Type II IP3 receptors are also represented. Unique features of the model include stochastic behavior of IP3 receptor calcium channels and comparisons of channel open times when diffusely distributed or aggregated in clusters on the ER surface. Simulations show that IP3R channels in close proximity modulate activity of their neighbors through local Ca2+ feedback effects. Cytoplasmic calcium levels rise higher, and ER luminal calcium concentrations drop lower, after IP3-mediated release from receptors in the diffuse configuration. Simulation results also suggest that the buffering capacity of the ER, and not restricted diffusion, is the predominant factor influencing average luminal calcium concentrations.
INTRODUCTION
The mobilization of calcium is a vital step in mast cell activation. Cross linking of high affinity IgE receptors initiates a tyrosine kinase cascade that activates phospholipase Cγ isoforms and leads to elevated levels of inositol 1,4,5-trisphosphate (IP3) (1). Phosphatidylinositol 3-kinase lipid products enhance PLCγ activity and are required for maximal IP3 synthesis (1–4). Under optimal cross-linking conditions, intracellular Ca2+ stores are rapidly depleted and do not refill for minutes (5). Concomitant Ca2+ influx supports a persistent elevation in cytoplasmic Ca2+. The sustained phase of Ca2+ influx occurs primarily via the capacitative Ca2+ pathway (6) and, paradoxically, is the phase of the response that is most dramatically affected by PI 3-kinase inhibition (1,4). Sustained elevations in cytoplasmic Ca2+ are absolutely required for secretion of histamine, serotonin, and other preformed mediators of the allergic response (7).
Intracellular calcium stores in nonmuscle cells are principally released by IP3 receptors, of which there are three closely related types (8). In 1998, we reported that Type II IP3 receptors of RBL-2H3 cells, a mast tumor cell line, redistribute into large clusters in the endoplasmic reticulum (ER) after short periods of elevated intracellular calcium (9). Similar results were observed for Type I receptors in rat pancreatoma cells and for Type II receptors in hamster lung fibroblasts, suggesting that the induction of IP3 receptor clustering is a common feature of this family of channels. We hypothesized that redistribution of receptors modulates Ca2+ release from the ER. To address this issue, we have created a three-dimensional modeling environment that incorporates a realistic ER geometry and tracks free and bound calcium based upon reaction-diffusion rates and spatial constraints.
The modeling of an entire cell has been proposed as a grand challenge for this century (10). Modeling platforms such as Virtual Cell (11) and Mcell (12,13) represent important advances in this direction. Here we describe the development of a model cell that houses a geometric reconstruction of the ER and is populated with basic components of the calcium response pathway in most nonexcitable cells, including IP3 receptors, SERCA and PMCA ATP-driven pumps, and calcium buffering proteins in the cytosol and ER lumen. A simpler ER disk model was also developed for comparison to the complex ER geometry model and for less costly pilot simulations. In both models, individual domains representing membranes, cytosol, and ER lumen are composed of tetrahedrons, providing a framework for solving multispecies diffusion/reaction equations at millisecond timescales. We report computational support for the concept that clustering influences channel behavior. Mobilization of clustered IP3 receptors can result in modest gradients of calcium within the ER lumen during the initial phase of stores release though IP3 receptors. However, its most important effect is to dramatically reduce the open channel probability and the release of stored calcium. Luminal buffers effectively minimize gradients, despite the potential for restricted diffusion in tight spaces within the ER. Hence, the principal consequence of stimulus-coupled receptor clustering may be to reduce IP3R channel activity, protecting luminal calcium levels when cells are repeatedly stimulated.
MATERIALS AND METHODS
High voltage electron microscopy and surface reconstruction
RBL-2H3 cells were cultured on tissue-culture-grade plastic in minimal essential medium (Gibco Life Technologies, Grand Island, NY) supplemented with 15% fetal calf serum (HyClone, South Logan, UT), penicillin-streptomycin, and L-glutamine. Cells were fixed with 2% glutaraldehyde in 0.1 M sodium cacodylate buffer, then lifted from plastic dishes by the addition of propylene oxide (14) and processed for Epon embedding as described in Pfeiffer et al. (15). Blocks were stained with uranyl acetate and cut as 1.0-μm sections with a Leica Ultracut S microtome (Leica, Wetzlar, Germany). Sections were mounted on 75 mesh clamshell grids and further stained for 15 min with 2% uranyl acetate and for 2 min with Sato lead solution, then carbon-coated. Before imaging, sections were dipped in 10 nm colloidal gold suspension (Sigma, St. Louis, MO) to provide markers for tilt-series alignment. Samples were imaged in a JEOL 400EX (JEOL, Tokyo, Japan) intermediate high-voltage electron microscope. Before image capture, samples were exposed to the beam for 45 min to preshrink the specimen and prevent further deformation during tilt-series capture. Photographic images were captured at 2° intervals from +64° to −64°, then digitized at 14 bits with a Photometrics CH250 CCD camera (Photometrics, Tucson, AZ). Image alignment, back projection, manual tracing of endoplasmic reticulum, and preliminary surface generation were performed with XFido, Xvoxtrace, and Synuview software developed at the National Center for Microscopy and Imaging Research. Endoplasmic reticulum was identified on the basis of structural continuity with the nuclear envelope and the presence of polysomes. For mesh generation, traced regions were exported as two-bit image stacks to a digital data viewer (DDV, http://www.compgemco.com) for coherent surface generation using an implementation of the marching cubes algorithm. Initially, surface meshes were generated with marching cubes or Nuages algorithms in Xvoxtrace or with the marching cubes algorithm in the DDV. The reconstructed object was imported into CUBIT (http://cubit.sandia.gov) for tetrahedral meshing of the ER lumen, followed by creation of meshes representing the ER membrane, cytosol, and plasma membrane.
Immunofluorescence microscopy
IgE-primed cells adherent to glass coverslips were treated for 10 min with or without antigen (100 ng/ml DNP-BSA), immediately followed by addition of 2% paraformaldehyde. After 20 min, fixed cells were permeabilized by 10 min treatment with 0.1% Triton X-100 and incubated with primary antibodies to the Type II IP3R, calreticulin, or calmodulin, followed by washes and labeling with fluorochrome-labeled secondary antibodies. SERCA pumps were stained by incubation with BODIPY(Fl)-thapsigargin for 5 min after staining with secondary antibodies. Coverslips were mounted in ProLong antifade reagent (Invitrogen, Molecular Probes, Eugene, OR) and images acquired on a Zeiss Axioskop equipped for epifluorescence (Carl Zeiss, Jena, Germany). IP3R clusters per unit cell area were quantified using Sobel filtering, thresholding, erosion, and object detection procedures (TILLvisION software, Till Photonics, Martinsried, Germany).
UV uncaging and Ca2+ imaging
Microinjection of RBL-2H3 cells was performed at room temperature using an Eppendorf Transjector 5246 (Eppendorf-Netheler-Hinz, Hamburg, Germany). Injection pipettes were filled with a solution containing 2.5 mM Fluo-3 and 1 mM caged compounds in phosphate-buffered saline. After injection, cells were allowed to recover undisturbed in a CO2-supplemented incubation chamber on the microscope stage. Images were acquired using Zeiss Axiovert microscope with LSM 510 confocal attachment. Fluo3 fluorescence intensity was recorded with a 40× Plan-Neofluar objective from 4.0-μm optical slices with excitation via the 488-nm line of the Kr/Ar laser and PMT detection. Ultraviolet pulses were delivered to the sample from a 200-W Hg/Xe lamp via a 360-nm bandpass filter, 1.0 OD neutral density filter, and ultraviolet dichroic filter placed in the beam path. Pulse length was controlled with a Uniblitz (Rochester, NY) VMM-D1 shutter and controller using software written in-house. Measurement of cellular fluorescence intensity from manually drawn regions of interest was performed with Zeiss LSM510 software.
Protein quantitation
Concentrations of calreticulin and calmodulin were determined by quantitative Western blotting (Supplementary Material, Fig. S1). Briefly, cell lysates were prepared from defined numbers of RBL cells (0.1–1 × 10⁶) and solubilized in Laemmli buffer for SDS-PAGE. Purified bovine calmodulin (Sigma) or rat calreticulin (kindly provided by Dr. Lars Ellgaard and Dr. Ari Helenius of the Institute of Biochemistry, Swiss Federal Institute of Technology, Zurich, Switzerland) were used as standards. A standard curve was generated by loading lanes in a gel with range (0.02–2 μg) of relevant purified protein, adjacent to lanes containing cell lysates. After electrophoresis, proteins were transferred to nitrocellulose using a semidry blotting apparatus and probed sequentially with primary and HRP-conjugated secondary antibodies and developed using ECL reagents (Pierce, Rockford, IL). Films were scanned and analyzed using a BioRad GS800 densitometer (BioRad, Hercules, CA). Densities of SERCA pumps were estimated based upon flow cytometry measurements using either saturation binding of BODIPY(Fl)-thapsigargin (Molecular Probes, Eugene, OR) or Alexa-488 (Molecular Probes) labeled monoclonal anti-SERCA2 antibody (Sigma) and Quantum Simply Cellular beads (Bangs Laboratories, Fishers, IN).
Total IP3 receptors were estimated based upon binding to tritiated Ins(1,4,5)P3. In brief, RBL cells were suspended in 10 mM Tris pH 7.4/10 mM KCl/5 mM MgCl2/1 mM EGTA/protease inhibitors and frozen. Cells were thawed and disrupted by repeated passage through a 25 g needle, centrifuged (16,000 × g for 10 min at 4°C) and resuspended in 50 mM Tris, pH 8.0/2 mM EDTA. Aliquots of disrupted cells were then incubated with 2–500 nM [3H]InsP3 at 4°C for 1 h and saturation binding curves were obtained and analyzed as described (16).
RESULTS AND DISCUSSION
Building and testing the geometric model
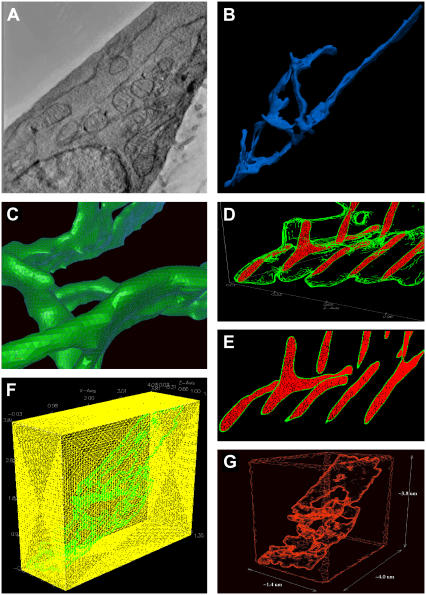
Our model is based upon the rat basophilic leukemia line, RBL-2H3. Fig. 1 A shows a representative image from the electron tomographic tilt series used to reconstruct the three-dimensional topography of the endoplasmic reticulum in these cells. One view of the resulting ER reconstruction is shown in Fig. 1 B and movies of both the tomographic series and ER reconstruction are available as online Supplementary Material.
FIGURE 1.
Realistic geometry reconstruction. (A) Representative image from electron tomographic tilt series. (B) Three-dimensional surface reconstruction of the endoplasmic reticulum. (C) ER surface construction converted into facet-based geometry for import into CUBIT. (D,E) Slice planes showing the tetrahedral spatial discretization of the ER lumen (red) and the ER membrane (green). (F) Meshed, cytosolic box (yellow) surrounding the ER (green). (G) Dimensions of the artificial cell, showing coarsening of mesh approximating the plasma membrane.
The ER surface generation was accomplished using the image series interpolation code, DDV. At this step, small imperfections were corrected to make it water-tight. It was next converted into a facet-based geometry (Fig. 1 C) for import into the CUBIT finite-element mesh generation toolkit. CUBIT is a solid modeler-based preprocessing tool for robust and unattended generation of two- and three-dimensional finite element meshes. Algorithms in CUBIT control and automate much of the meshing process, such as automatic scheme selection, interval matching, sweep grouping, sweep verification, and smoothing. The volume contained within the lumen of the ER was then filled using CUBIT's tetrahedral mesher (Fig. 1 D).
We next constructed a thin envelope around the reconstructed surface, to represent the ER membrane (Fig. 1 E). This was generated in CUBIT by copying the original enclosing surface and then expanding the copy by a small amount, moving the nodes along the local outward surface normal. This intermediate region was then meshed using CUBIT. Finally, the reconstructed ER was placed in an enclosing box that approximates the plasma membrane (Fig. 1 F) and a cytosolic volume (Fig. 1 G) that were also meshed using CUBIT. The final dimension of the artificial cell is 4.0 × 3.8 × 1.4 μm and contains ∼2.5 million tetrahedrons. Of these, ∼1.8 million are in the mesh of the cytosol, which was progressively coarsened as it extended away from the ER surface to reduce the numbers of unknowns for the solver.
To fully explore the effects of a convoluted ER geometry, we also constructed a simpler geometric model based upon an ER disk embedded within a cytosolic box (Supplementary Material, Fig. S2 A). The disk was constructed with a similar surface/volume ratio to that of the ER geometry and the surrounding cytosolic box also has a similar volume relationship to that of the more complex model. This representation provided a computationally inexpensive platform for trial simulations by virtue of its smaller size (∼60,000 tetrahedrons), which reduces run times and is useful for rapid parameter studies. We also constructed a simple rectangular box geometry with the same surface/volume ratio of the ER. This rectangular geometry was utilized in the study of diffusion and buffering impact on calcium gradients (see Fig. 9).
FIGURE 9.
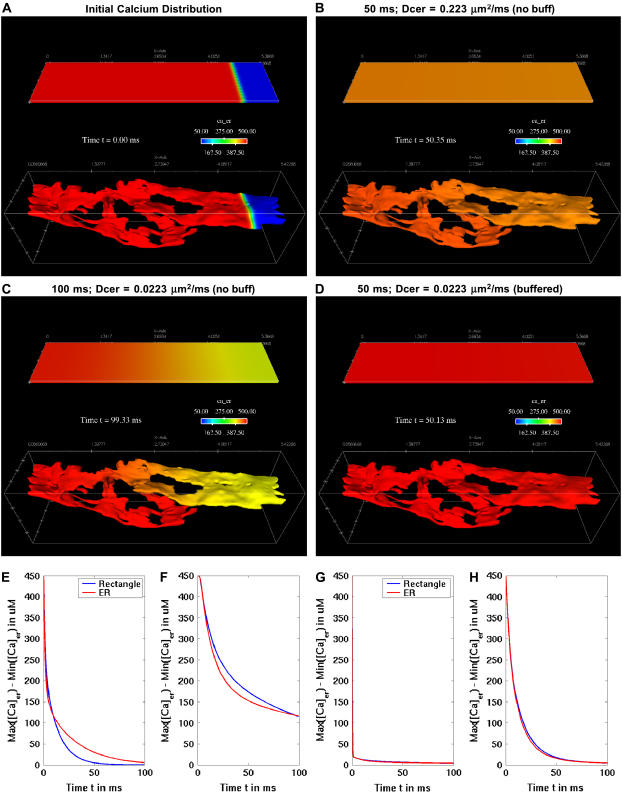
Diffusion and buffering, not geometry, dominate gradient dissipation. (A) Depiction of two geometries used in a simulation of calcium diffusion, where both ER (bottom) and rectangular (top) interiors are filled with 500 μM, dropping abruptly to 50 μM at the right end. In panel B, the diffusion coefficient was set to 0.223 μm2/ms and diffusion simulated in the absence of calcium buffers. In panel C, the diffusion coefficient was set to 0.0223 μm2/ms and diffusion simulated again in the absence of calcium buffers. In panel D, the diffusion coefficient was set to 0.0223 μm2/s and diffusion simulated in presence of luminal calcium buffers. Plot in panel E shows that the 450 μM gradient drops down to ∼100 μM within 10 ms in both geometries without buffers. Plot in panel F shows a gradient of >100 μM persists for over 100 ms if the diffusion coefficient is 10× slower and buffers are absent. Plot in panel G shows that, at the slower diffusion rate, the 450 μM gradient is lost within 1 ms under both geometries if the ER lumen includes full buffering capacity. With a lowered binding coefficient for both sites of the mobile buffer in the ER lumen, calreticulin gradients are dissipated slower as shown in plot (H), and geometry has a negligible impact.
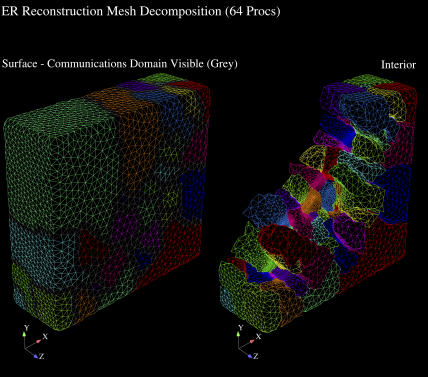
Numerical simulations are performed on 16–100+ processors of an Intel 686 Linux cluster with the parallel reacting-flows solver MPSalsa, developed at Sandia National Labs. The Appendix includes a detailed description of MPSalsa, including the application of multiprocessors for partitioned geometric modeling. Simulations are adaptively time-stepped with initial dt = 0.01 ms, and we apply constraints on the adaptive step size to maintain reasonable transition probabilities of the stochastically gating IP3R model (see Appendix). In the full ER reconstruction mode, solution times up to 1000 ms can typically take several days. Solution times for the simpler disk geometry are shorter at ∼24–48 h. Where possible, we use parameters that have been experimentally measured for RBL-2H3 cells. Other estimates were derived from the literature as cited (Table 2) or considered as variables in the simulations. For example, the diffusion coefficient for cytosolic calcium was uniformly set at 0.223 μm2/ms, as estimated by Allbritton et al. (17). However, experimental measurements of fluorescent protein diffusion in the ER and the cytosol suggest that molecular crowding slows diffusion within the ER lumen (18). Therefore, for some trials, we set the diffusion coefficient for luminal calcium at 0.0223 μm2/ms; the effects of varying this diffusion rate for luminal calcium are explored in Fig. 9 below. A summary of equations used in this work is found in the Appendix.
TABLE 2.
Model parameters
| Parameter | Symbol | Value | Source |
|---|---|---|---|
| Initial conditions | |||
| Resting [Ca2+] in cytosol | Cacyt_0 | 100 nM | (4) |
| Resting [Ca2+] in ER | Caer_0 | 500 μM | (71) |
| Mobile buffers | |||
| ER | TotBer_0 | 3.6 mM | Estimated based upon ∼57% buffering by calreticulin at ∼2 mM (measured). |
| Calmodulin | TotBcyt_0 | 5.9 μM | Measured. |
| Immobile buffer | TotIcyt | 4.24 mM | Geometric mean of values from (53,54). |
| ER membrane potential | Vm | 0 mV | |
| Diffusion coefficients | |||
| Calcium in cytosol | Dca cyt | 223 μm2/s | (17) |
| Calcium in ER lumen | Dca er | 223 μm2/s, 22.3 μm2/s | Unknown; tested two values. |
| Calmodulin in cytosol | DBcyt | 80 μm2/s | (72) |
| Calreticulin in ER | DBer | 27 μm2/s | Calculated based on mol. weight. |
| Fluxes | |||
| ER leakage | |||
| Time constant | τleak | 110–140 s | (24) |
| Time to empty ER | 10 min | (71) | |
| Shutoff threshold | Jer_leak_off | 7% resting [Ca2+]er | (23) |
| SERCA | |||
| Max flux | VSERCAf,r | 0.005 fA | (73) |
| Forward mode Km | KSERCAf | 260 nM | (26) |
| Reverse mode Km | KSERCAr | 1.8 mM | (26) |
| Hill coefficient | HSERCAf,r | 0.75 | (26) |
| Pump density | ρSERCA | 1973/μm2 | Measured. |
| PMCA | |||
| Extrusion rate | VPMCA | 10/s | (57) |
| PM leakage | VPMleak | −1 μmol/s | Balance of PMCA at baseline [Ca]cyt. |
| IP3R channels (type II) | |||
| Maximal flux rate | VIP3R | 0.064 pA | (28,29,60) |
| IP3 degradation rate | KIP3degrade | −1.33 s−1 | (57) |
| Reactions | |||
| ER buffer—calreticulin | |||
| Site C | |||
| Dissociation | Kcer | 2 mM | (52) |
| Capacity | Scer | 20 mol Ca/mol | Estimate based on (52,54). |
| Forward rate | kCer+ | 1 × 10⁵ M−1 s−1 | Estimate based on slower version of calmodulin. |
| Site P | |||
| Dissociation | KP | 10 μM | (52) |
| Capacity | sP | 1 mol Ca/mol B | (54) |
| Forward rate | kP+ | 1 × 10⁸ M−1 s−1 | Estimate based on faster version of calmodulin. |
| Cytosolic buffer—calmodulin | |||
| Site N | |||
| Dissociation | KN | 2.6 μM | (53) |
| Capacity | sN | 2 mol Ca/mol | (53) |
| Forward rate | kN+ | 1.6 × 10⁸ M−1 s−1 | (53) |
| Site C | |||
| Dissociation | KCcyt | 1 μM | (53) |
| Capacity | sCcyt | 2 mol Ca/mol | (53) |
| Forward rate | kCcyt+ | 2.3 × 10⁶ M−1 s−1 | (53) |
| Immobile buffer—mitochondria | |||
| Dissociation | KI | 2.828 μM | Geometric mean of values from (55,56). |
| Forward rate | kI+ | 7.9 × 10⁴ M−1 s−1 | Geometric mean of values from (55,56). |
Spatial distribution and quantification of ER components
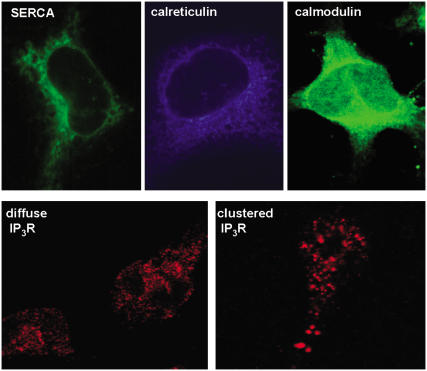
This model specifically incorporates spatial distributions and concentrations of important calcium ion transport mechanisms in the ER, as well as principal proteins that buffer the ER lumen and cytosol. Fluorescent micrographs in Fig. 2 document the intracellular localization patterns of key constituents of the model. The RBL-2H3 cell in Fig. 2 A was incubated with fluorescent thapsigargin, which specifically binds SERCA channels and demonstrates that these ATP-driven calcium pumps are evenly distributed throughout the ER membrane. The immunofluorescence image in Fig. 2 B shows that calreticulin, the major ER calcium binding protein, is also evenly distributed within the ER lumen. Immunofluorescence staining with anti-calmodulin antibodies (Fig. 2 C) is consistent with its role as the most important calcium-binding protein in the cytosol. We used quantitative Western blotting methods to estimate that RBL cells have an average of 1,700,000 molecules of calmodulin and 19,000,000 molecules of calreticulin per cell (Supplementary Material, Fig. S1). Because it has been estimated that calreticulin represents ∼57% of total calcium binding capacity within the ER (19), we set the total ER calcium buffer concentration in our model at 3.6 mM.
FIGURE 2.
Fluorescence-based localization of important components. Distribution of SERCA pumps (top, left) and calreticulin (top, middle) in the endoplasmic reticulum and calmodulin (top, right) in the cytoplasm of RBL-2H3 cells. Bottom-left panel shows the diffuse IP3R in the ER of resting cells; bottom-right panel shows clustering of IP3R after 10-min treatment of cells with ionomycin (1 μM).
Cells in Fig. 2, D and F, are stained with fluorescently-tagged antibodies to the type II IP3 receptor, the predominant receptor isoform in these cells (9). As previously reported in Wilson et al. (9), most IP3 receptors are diffusely distributed in the ER membrane of resting RBL cells (Fig. 2 E). Ten minutes of stimulation with antigen or calcium ionophore raise intracellular calcium levels and induce maximal type II IP3 receptor clustering in the ER membrane (Fig. 2 F). These clusters were imaged in multiple slice planes taken on a Zeiss LSM 510 confocal microscope and quantitated as described in Materials and Methods. Results showed an average of 125–135 clusters per activated RBL cell. Furthermore, the total number of IP3 receptor molecules was estimated to be ∼56,000 per RBL cell, based upon saturation binding of [3H]-IP3 (16). Since each channel is a tetramer (20–22), that translates to a total of ∼14,000 IP3-gated channels per cell. Thus, IP3 receptor clusters in activated RBL cells are quite large, with over 100 channels per cluster. These important parameters are summarized in Table 1. The cytosolic calcium level was initially set at 100 nM, previously measured by ratio-imaging (4). Other basic model parameters, such as the cytosolic and ER luminal buffering suite, were employed as described in Table 2.
TABLE 1.
RBL parameters
| Parameter | Value |
|---|---|
| Average cell volume | 770 μm3 |
| Average cytosolic volume | 480 μm3 |
| Traced segment cytosol volume | 14 μm3 |
| Fraction of cell traced | 2.9% |
| Traced ER surface area | 14.4 μm2 |
| Traced ER volume | 0.45 μm3 |
| IP3R molecules per cell | 56,000 |
| IP3R tetrameric channels/cell | 14,000 |
| Predicted channels in traced area | 380–405 |
| Estimated range of IP3Rs per cluster | 125–135 |
| Predicted clusters in traced area | 3 |
Establishing SERCA parameters for the model
SERCA density and behavior is a critical feature of this model. We utilized a combination of simulation and experiment to establish this important function. To establish the density of SERCA channels in RBL cells, we performed saturation binding of fluorescent thapsigargin and used flow cytometry to estimate the average number of SERCA channels per cell at 1.6 million. This translates to a density of 1973 pumps/μm2.
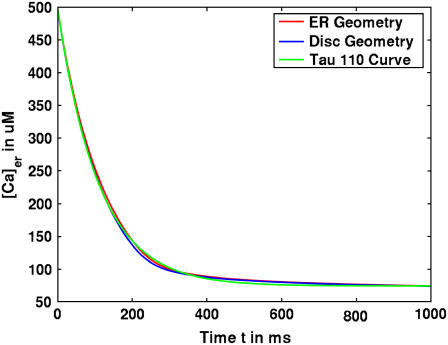
We began with the assumption that ER calcium leakage balances SERCA activity at steady state. Beecroft et al. (23) and Bergling et al. (24) estimated the decay constant for ER leakage at 110–140 s. We initially employed the unidirectional model of SERCA activity, where the SERCA is assumed to operate only in one direction: uptake of calcium from the cytosol. SERCA activity was based upon typical Michaelis-Menten formulation and equivalent to the ER leakage rate (25). We then turned off the SERCA pumps in the simulation and observed the time constants for ER leakage. This resulted in very fast ER leakage time courses, with decay constants of ∼50 s. It was evident that some other mechanism was at work. Our solution was to implement the bidirectional SERCA model described by Shannon (26) that includes a reversal mode of the SERCA pump. The incorporation of bidirectional SERCA at the measured density of 1973 pumps/μm2 resulted in an acceptable time-course for ER leakage (114 s for the ER geometry, and 111 s for the disk); these results are shown in Fig. 3. Importantly, the simulation results fit well with the observed flux of calcium in cells treated with the SERCA inhibitor, thapsigargin (green line, Fig. 3). We applied this strategy to all simulations reported hereafter.
FIGURE 3.
Time course of ER leakage in simple and complex geometric models when SERCA is inactivated. Simulations of calcium loss from the ER when SERCA activity is shut off. Identical results are achieved for disk (blue) and ER (red) geometries. Both values fit with the expected results using an experimentally derived decay time constant of 110 s (green).
Diffuse versus clustered IP3R simulations in the disk model
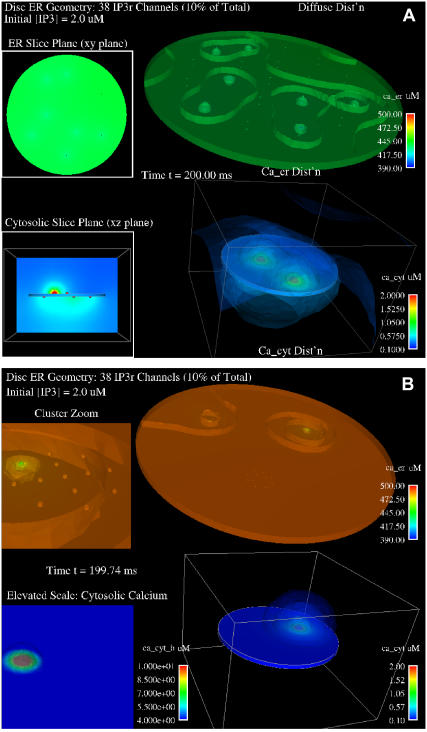
Initial comparisons between diffuse and clustered IP3R were performed in the disk model. This model lacks the tight luminal constrictions and convolutions that may restrict calcium diffusion in the full geometric reconstruction; we also reduced the number of IP3R channels in the disk geometry to 10% of the experimentally defined number to limit computational expense. Individual channels were depicted by discrete tetrahedrons that span the ER membrane with diameter of ∼10 nm (27) (Supplementary Material, Fig. S2 B). These structures were either evenly distributed on both sides of the ER disk (Fig. 4 A) or distributed in the clustered state (Fig. 4 B), with placement of two clusters on one side and one cluster offset on the opposite side of the disk (Supplementary Material, Fig. S2 C). Results compare channel flux, ER luminal calcium concentration, and cytosolic calcium concentration when channels were allowed to stochastically open in response to addition of 2 μM IP3. The stochastic gating of IP3R in the simulation is based on parameters in Tu et al. (28,29), giving the probability of channel opening based upon concentrations of IP3 and cytosolic calcium. This scheme of stochastic channel behavior and IP3 dynamics is described in detail in the Appendix. As only the ratios of forward and reverse rates could be obtained from the data of Tu et al. (28,29) and virtually no experimental data were available from the literature, we decided to explore two different suites of transition rates: a fast one (parameter suite 1) and a slow one (parameter suite 2). Unless stated otherwise, presented figures are based on simulations using suite 1. However, we note that the conclusions are generally valid for both of them. The spatial plots in Fig. 4 show snapshots at ∼200 ms into the simulation, where levels of free calcium in the ER lumen (top disks) and cytoplasm (bottom disks) are depicted by pseudocolors according to the scale bars at the right of each image. Puffs of calcium entering the cytosol are most dramatic in the clustered configuration (Fig. 4 B). These puffs generate very small spatial gradients within the discoid ER lumen, with an average difference of ∼50 μM from the channel mouth to the interior of the lumen over this short time course. Importantly, the distribution of IP3Rs significantly affects the overall loss of luminal calcium, even in the simple disk geometry with a reduced number of IP3R channels. This is indicated by the bright-green pseudocolor for the disk at the top of Fig. 4 A (diffuse state) compared to the dark-orange pseudocolor of the disk at the top of Fig. 4 B (clustered state).
FIGURE 4.
Simulated calcium release through diffuse or clustered IP3R channels in the simple disk ER geometry. Pseudocolor illustrations show concentrations of calcium in the ER lumen (top half) and cytosol (lower half) ∼200 ms after in silico stimulation with 2.0 μM IP3. (A) Thirty-eight IP3R channels are distributed homogeneously across both top and bottom surfaces of the disk and open with stochastic gating. Upper inset shows a top-down view of luminal calcium. Lower inset shows a side view of cytosolic calcium. (B) Thirty-eight IP3R channels are distributed in three distinct clusters. The upper inset shows a close-up view of luminal calcium near one cluster. The lower inset shows a close view of cytosolic calcium near the same cluster, where a channel is open. All plots include isoconcentration surfaces with bars nearest each feature indicating the range of pseudocolor scale.
Diffuse versus clustered IP3R simulations in the ER geometry model
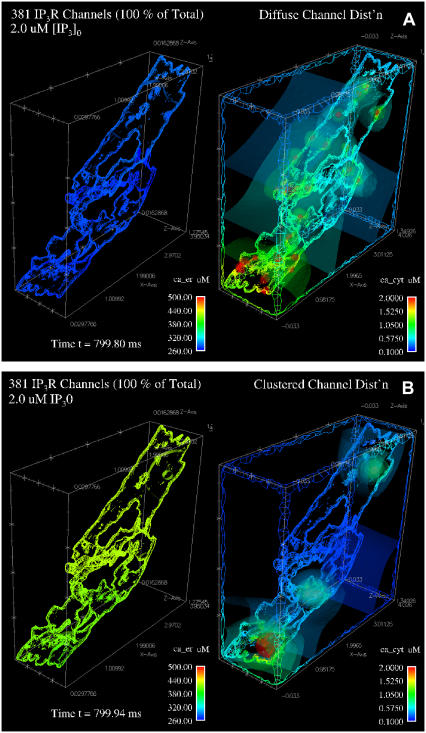
We next compared the effects of clustering IP3 receptors in the realistic ER geometry model. Illustrations in Fig. 5 show results after 800 ms of stimulation with 2 μM IP3. The IP3R channels were either randomly distributed across the ER surface (Fig. 5 A) or concentrated within one of three large clusters (Fig. 5 B). Their stochastic opening in response to IP3 was modeled as in Fig. 4.
FIGURE 5.
Simulated calcium release through diffuse or clustered IP3R channels in the full ER reconstruction geometry. Pseudocolor illustrations show concentrations of calcium in the ER lumen (left panel) and cytosol (right panel) ∼800 ms after stimulation with 2 μM IP3. IP3R channels open and close in the simulation via stochastic gating as described in the text. (A) 381 IP3R channels are distributed homogeneously across the ER surface. (B) Three-hundred-eighty-one IP3R channels are distributed in three distinct clusters. Isosurface renderings and geometry surfaces indicate calcium concentrations for luminal and cytosolic ER, with bars showing the respective ranges of the pseudocolor scales.
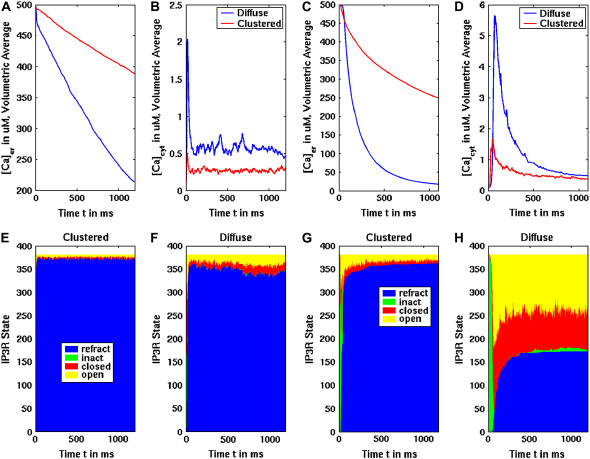
The results of these simulations show dramatic differences in calcium mobilization through clustered and diffuse IP3Rs. The pseudocolor images graphically illustrate the same overall impact of clustering in the ER geometry: proximal channels inhibit activity of close neighbors' activity, and hence clusters release significantly less calcium from the ER in response to the same concentration of IP3. Results plotted in Fig. 6, A and C, show that the luminal calcium concentration drops much less in the clustered IP3R state than in the diffuse IP3R state. This is valid for both the fast (A) and slow (C) suite of IP3R model parameters. Simulations of 1100 ms using the suite-2 parameters, with much slower inactivation, reached almost a complete depletion of calcium from the ER with diffuse IP3Rs. Because this is faster than predicted by experimental measurements that persist over several seconds, we favor the suite-1 parameters. Importantly, in both cases the average cytosolic concentration is much higher in the diffuse state than in the clustered state (Fig. 6, B and D), although depletion of the ER calcium for the slow suite eventually reduces this difference (Fig. 6 D). Note also that the peak of cytosolic calcium is reached earlier in the clustered state. For the diffusely distributed IP3R case with the slow kinetics (suite 2), the peak exceeded 5 μM. This might be due to the fact that we are considering, for simplicity reasons, only one mobile cytosolic buffer species—calmodulin. The cytosolic buffering capacity might, therefore, be somewhat underestimated. Movies of both simulations are available in the online Supplementary Materials.
FIGURE 6.
Differences between diffuse and clustered IP3R simulations in the ER geometry using the fast (A, B, E, F) or slow (C, D, G, H) IP3R kinetics. (A,C) Average concentration for luminal calcium. (B,D) Average concentration for cytosolic calcium. In panels A–D, blue lines represent results with diffuse IP3R and red lines represent results with clustered IP3R. The stimulus was set at 2 μM IP3. (E–H) Area plots showing the changes in IP3R status (refractory, blue; inactive, green; closed, red; open, yellow) during the simulation in the diffuse or clustered state.
The dramatically lower calcium response in the clustered IP3R distribution is due to a markedly high number of refractory channels, as plotted in Fig. 6, E–H. In the clustered state, the channels open earlier but most of them quickly become refractory due to high local cytosolic calcium concentrations. Note that in the diffuse channel configuration, we still see a rather high number of refractory channels in both parameter suite simulations (most for suite 1 and approximately half for suite 2). Nevertheless, a larger proportion of the remaining diffusely distributed channels do open. This leads to the observed greater efflux of luminal calcium.
Deterministic validation of stochastic gating results
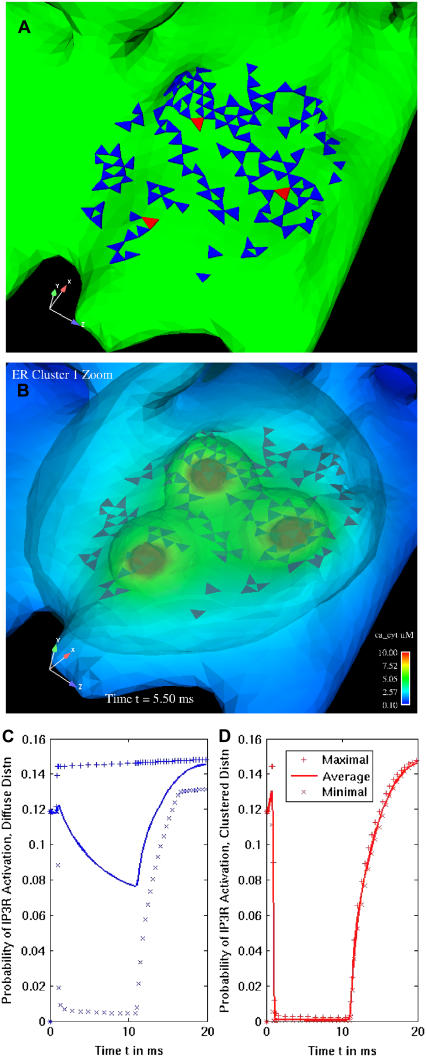
The utilization of stochastically gated IP3R channels represents their individual behavior but the simulation results are not necessarily representative of every possible outcome. We therefore sought independent validation of the local effects of IP3R clustering upon channel open probabilities. Three individual IP3R channels in a single cluster are selected for deterministic opening and closing (red triangles in Fig. 7 A), where we forced these specific channels open and closed for 10 ms. The resulting cytosolic calcium domain or puff (shown in Fig. 7 B at 5 ms into the deterministic channel opening) dramatically alters the open probability of surrounding channels in the cluster. Open probabilities for these cluster channels calculated at a level of 2.0 μM IP3 are plotted in Fig. 7 D. For comparison, we chose three similarly located IP3R channels in this region on the diffusely distributed channel geometry and performed the same deterministic opening and closing of the channels over 10 ms. The resulting open probability, at the same 2.0 μM IP3, for the same number of nearest-neighboring channels as in the clustered trial, are shown in Fig. 7 C. These diffusely-distributed, nearest-neighbor IP3Rs experience an average drop in open probability with a slight increase in maximal open probability. By contrast, the clustered neighboring channels have open probabilities lowered by an order of magnitude. We thus see that close proximity of open IP3R channels has significant effects on the neighboring IP3Rs either with stochastic or deterministic simulations.
FIGURE 7.
Deterministic test shows clustering of IP3R channels reduces probability of opening relative to diffuse distribution. (A) Closeup of cluster on the ER geometry, where three channels (red) were selected to open for 10 ms. (B) Isoconcentration surfaces of cytosolic calcium show that the opening of three channels creates a broad cloud of elevated calcium over the entire cluster. Time = 5 ms. Plots in panels C and D compare open probability for the nearest 127 channels at the introduction of 2 μM IP3, where three channels were independently opened in the diffuse (C) or clustered (D) distribution.
Gradients within the ER are transient and influenced by local geometry
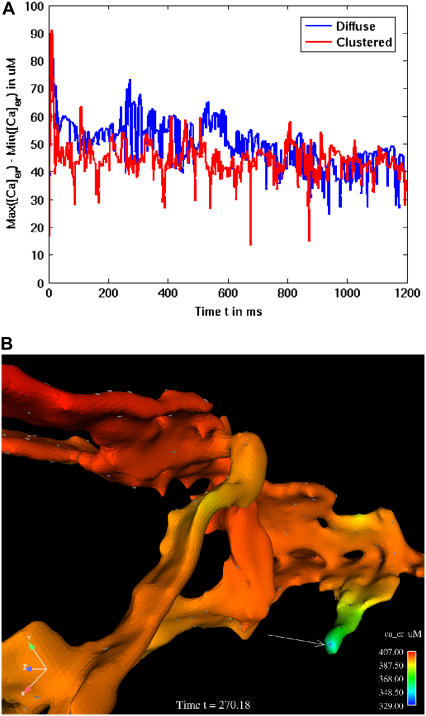
We carefully examined the spatial distributions of calcium throughout the time course of the simulations described in Fig. 6, looking for evidence of ER compartmentalization in either the clustered or diffuse state. The results are plotted in Fig. 8 A, as a function of time versus the difference between maximal and minimum calcium concentrations across the ER lumen. The most important observation is that gradients present in the ER lumen during IP3-mediated calcium mobilization were both small (<100 μM) and transient (milliseconds in duration). Surprisingly, large concentration gradients were observed in the diffused channel state, and, aside from the initial peak when clustered channels rapidly opened, overall were greater than the clustered channel state. The reason for this is shown pictorially in Fig. 8 B, depicting a closeup view of the spatial distribution of luminal calcium at a diffusely-distributed channel located on the end of an ER protrusion. Based upon the scale bar, there is a sharp gradient of almost ∼80 μM near the luminal channel mouth of this prominent channel (arrow). This was not observed in the clustered channel geometry, where it was necessary to choose flatter regions of the ER to accommodate all the channels. We believe this is a reasonable facsimile of cluster distribution in real membranes, based upon observations that large clusters of plasma membrane receptors preferentially localize to flat regions of membrane (30). The outcome is that clusters experience overall less sharp gradients in the lumen because they have much larger local pools of calcium to draw upon for transport.
FIGURE 8.
Modest calcium concentration gradients occur within the ER lumen during 2 μM IP3 stimulation. (A) Gradients of ∼40–70 μM are seen in the ER geometry when the diffusion coefficient is set at 0.223 μm2/ms. Blue lines represent results with diffuse IP3R and red lines represent results with clustered IP3R. (B) Spatial distribution of luminal calcium near individual, diffuse channels in ER geometry. Gray triangles indicate the location of IP3R in the mesh. Arrow points to sharp gradient of calcium in lumen when an open channel is localized to a protrusion.
Diffusion and buffering parameters influence ER loss and gradient dissipation
As previously stated, the actual diffusion rate for calcium within the ER is unknown. For the simulations discussed above, we chose to use the cytoplasmic diffusion rate and allow buffering reactions to attenuate the diffusion of calcium in the lumen. However, as noted above, molecular crowding in the convoluted interior of the ER (18) may impact the formation and transience of gradients via a slower diffusion rate. We thus performed trials with a lowered diffusion rate not only in the ER geometry, but also for comparison in a simple rectangular geometry designed with the same surface/volume ratio as our ER reconstruction. We further observed effects of buffering capacity upon the dissipation of gradients imposed by a sudden, localized loss of calcium (Fig. 9). The simulation assumes a sharp boundary of high (500 μM) to low calcium (50 μM) at time zero that is imposed upon either the flat rectangular geometry or a realistic ER geometry (Fig. 9 A). Simulations in Fig. 9, B, C, E, and F were performed without luminal buffers, whereas in Fig. 9, D, G, and H, buffers were present. Fig. 9, B and E, show it is apparent that no significant gradient persists in either geometry within 50 ms, when using the faster cytosolic diffusion rate for calcium. When using the slower diffusion rate for luminal calcium (Fig. 9 C), gradients persist longer in both geometries with no buffers present. In the ER geometry, the gradient is localized to the constricted tubules joining two larger ER segments. Importantly, results in Fig. 9, D and G, explain the very fast dissipation of gradients in the IP3-induced simulations shown above. Here, the addition of luminal buffers limits both calcium loss and effectively eliminates the gradients seen in either geometry using the slower diffusion rate for calcium. We particularly note here that these parameters, while based upon best knowledge, leave some room for interpretation and further experimentation. One consideration is that the calcium binding affinities for calreticulin and other calcium-binding proteins in the ER are not definitively known. We approximated values based on the binding properties of calmodulin, which is again a reasonable approach. However, to explore the effects that these approximations contribute to the model, we ran additional simulations varying calreticulin buffering capacity. The plot in Fig. 9 H shows that gradients can persist longer when estimated binding affinities for luminal buffering proteins are lowered by two orders of magnitude.
Our results thus agree with previous findings of Ölveczky and Verkman, who performed a detailed analysis of obstructed diffusion in cell organelles and demonstrated that geometric restrictions have surprisingly little impact on the diffusional properties (31). The dependency of release currents on buffering and diffusion properties of the lumen was also investigated by Thul et al. (32), and also suggested that total content of the lumen is, within a reasonable range, more important than changes in diffusion properties.
Effect of IP3 receptor clustering on Ca2+ responses after IP3 uncaging
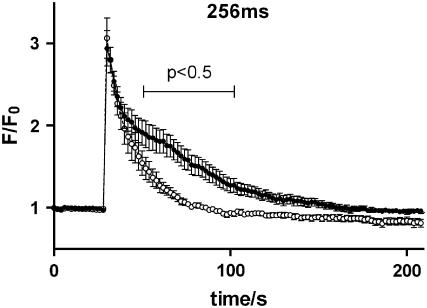
As a further test of our hypothesis, we sought experimental confirmation that IP3R clustering limits IP3-induced Ca2+ responses in live cells. Prior work had shown that brief exposure of RBL cells to ionomycin resulted in clustering of IP3 receptors (see Fig. 2). After washout of ionomycin and return of cytosolic calcium to baseline levels, the receptors remain clustered for >0.5 h. Our strategy was to microinject RBL cells with caged GPIP2, a photoactivatible analog of IP3 (33). The fluorescent calcium indicator dye, fluo3, was included in the injection solution to permit optical measurement of intracellular calcium levels. Injected cells were incubated for 10 min with vehicle (control) or with ionomycin (to induce clustering), followed by 30 min of recovery. Cells were then subjected to a UV light pulse of 256 ms to uncage IP3 and were continuously monitored for fluo3 fluorescence intensity. Results in Fig. 10 demonstrate that clustering of IP3Rs significantly attenuates both the magnitude and duration of sustained, influx-dependent responses in response to uncaging.
FIGURE 10.
Lowered calcium response to uncaging of microinjected IP3 occurs in RBL cells with preclustered receptors (open circles) versus cells with diffuse receptors (solid circles). These experiments were conducted in calcium-containing buffer, permitting store-operated calcium influx to contribute to the sustained phase of the response to IP3 uncaging. The difference between responses in cells with diffuse versus clustered receptors is significant in the bracketed region (p < 0.5).
SUMMARY AND FUTURE DIRECTIONS
Although three-dimensional finite element models are commonly applied to engineering problems, to our knowledge this is the first application of finite element methods to model intracellular calcium responses in physiologically realistic ER geometry. Another novel feature is the incorporation of stochastically gating ion channels within this context. We sought to test the concept of compartmentalization of the endoplasmic reticulum, an idea that is more than two decades old (34). We, and others, predicted that mobilization and refilling of calcium can be profoundly influenced by the unequal distribution of calcium-binding proteins and transporters (35–37). Parys et al. (38) suggested that the heterogeneous distribution of IP3 receptors might contribute to quantal Ca2+ release, by functionally dividing the store on the basis of IP3 sensitivity.
Using electron tomography, we reconstructed a representative fraction of the ER in RBL-2H3 cells. The ER of these cells forms a combined tubular-reticular structure. Although some of the ER tubules are quite narrow, we found no evidence of barriers capable of physically separating the ER into compartments. Clustering of IP3 receptors creates regions of the ER that are rich in SERCA channels and devoid of IP3 receptors. However, simulations show that gradients formed in the ER lumen during calcium release are small and rapidly dissipate. The lack of significant gradients is due in large part to the ER's powerful buffering capacity.
The principal outcome of IP3 receptor clustering seems to be the reduced rate of calcium release from the ER. Interestingly, our experimental data with the caged form of IP3 show similar results: calcium responses are significantly reduced after IP3Rs preclustering (Fig. 10). Our modeling results suggest that there are nanometer-scaled regions of elevated cytosolic Ca2+ around clusters containing active receptors. High calcium concentration within these regions lowers the open probability for neighboring receptors. The explanation for this is based upon knowledge that IP3 receptors are ligand-gated Ca2+ channels with multiple regulatory sites (8,39,40). They contain binding sites for Ca2+ (41) and elevations in free Ca2+ from nanomolar to micromolar concentrations can modify receptor properties—although there is variation among the three IP3 receptor subtypes. We concentrated here on the type II receptor, since it constitutes the major isoform in RBL cells (9).
The mechanisms for IP3 receptor clustering are presently unknown. However, recent work by Tateishi et al. (42) suggests that clustering is dependent upon a conformation change associated with channel opening. We are interested in pursuing the ramifications of induced receptor clustering on overall calcium responses, by expanding the model to include diffusion of IP3Rs within the ER membrane and cluster formation over an appropriate time course of receptor-induced IP3 synthesis. We also plan to introduce the production and degradation of IP3, already shown by Loew and colleagues to exhibit important spatiotemporal control of Purkinje cell calcium waves (43). Penner and colleagues (44) have proposed that IP3 phosphatase is localized to the cytoplasmic face of the ER. The impact of the close spatial relationship of IP3 targets and IP3 metabolism awaits computational analysis.
An important next step is to use the model to explore mechanisms of capacitative calcium entry and the missing links to the state of luminal calcium. Penner and colleagues have performed much of their pioneering work on the store-activated calcium current ICRAC in RBL cells (45–47), including their important observation that low concentrations of IP3 are sufficient to release substantial amounts from Ca2+ stores without activation of ICRAC. They showed that activation is nonlinearly related to stores release and occurs only with relatively high concentrations of IP3. Future iterations of our spatial model will explore the fit of TRP family members, and other candidates for Icrac, with experimentally measured calcium responses in stimulated RBL cells. We will also use the model to seek insight into the luminal sensor that triggers store activated currents and potentially generates the diffusible influx factor, CIF (48–50).
A powerful advantage of the spatial model is that it provides a platform for sequentially adding new components and testing their effects on the outcome. For example, our spatial reconstruction revealed mitochondria that are closely opposed to the ER, often within 50 nm. Incorporation of mitochondria and their calcium uptake into the model is in progress. As another example, our current model assumes that calmodulin is freely mobile in the cytoplasm. This may be an oversimplification, based upon recent evidence by Mori et al. (51) suggesting that calmodulin may be locally enriched near specific channels. Mori's group provided specific evidence for enrichment near L-type Ca2+ channels, that are not present in leukocytes, but we must consider the possibility that calmodulin is also enriched near IP3 receptors where it may directly modulate channel activity.
SUPPLEMENTARY MATERIAL
An online supplement to this article can be found by visiting BJ Online at http://www.biophysj.org.
Acknowledgments
We thank Dr. Janet Oliver for critical reading of the manuscript. We also gratefully acknowledge Mark Ellisman and John Crum for facilitating electron tomography studies at the National Center for Microscopy and Imaging Research at the University of San Diego.
This work was supported by grants from the National Institutes of Health (NIH No. R01 AI051575 to B.S.W.; NIH No. P20 BM0066283 to establish the UNM Center for Spatiotemporal Modeling of Cell Signaling Networks; NIH No. DK49194 to R.W.) and by the Department of Energy Office of Science MICS program. Sandia is a multiprogram laboratory operated by Sandia Corporation, A Lockheed Martin Company, for the United States Department of Energy under contract No. DC-AC04-94AL85000.
APPENDIX
Mathematical model description
Our current model incorporates both cytosol and the endoplasmic reticulum (ER) luminal spaces. The following species in the ER and the cytosol are represented:
Free calcium in ER
Free calcium in cytosol
Unbound mobile buffers in ER (calreticulin)
Unbound mobile buffers in cytosol (calmodulin)
Unbound immobile buffer in cytosol (mitochondria)
We assume a spatially homogeneous concentration of inositol-triphosphate (IP3), which is reflected as a parameter in the model and not a diffusive species proper. We elaborate on this later when we present our representation of IP3R channels. We let Cer, BCer, BPer Ccyt, BCcyt, BNcyt, and Icyt represent the concentrations of free calcium and unbound buffers in the ER and cytosol, respectively, where we include two noncooperative sites for each mobile buffer: sites C and P for calreticulin and C and N for calmodulin. The resulting equations, where we represent each ionic or protein species by Si, are then given by
 |
(A1) |
We treat the transport mechanisms at the ER luminal/cytosolic boundary as spatially localized source terms resulting in the flux for calcium ( ) including both reactions between calcium and the buffers, here
  and transport mechanisms,
  in the ER membrane such as IP3R channels and SERCA pumps. The Ji term represents the flux transport mechanisms for calcium at the cytosolic boundary with the extracellular space. Since no boundary flux transport occurs for the buffers, no J terms appear in their respective equations or in the Caer equation. Further, since I is an immobile (nondiffusive) species, its equation has no diffusive transport term.
Buffering reactions
In each space, the ER and the cytosol, we represent the overall mobile buffers with calreticulin and calmodulin, respectively. Each of these protein buffers have two types of binding sites (52–54), and in our model the distinct kinetics for these sites are represented as distinct and independent categories of binding sites. In the case of calreticulin, there are sites C and P, where site C is the larger capacity site, which can bind ∼ 20 mol of Ca2+ per mol of protein. Site P, on the other hand, binds only ∼1 mol Ca2+ per mol protein (54) and we depict this binding capacity as such in the initial concentrations of buffer. These sites are thus depicted as Bcer and Bper in the model. Calmodulin's two binding sites (at the N- and C-terminus) are of the same capacity, 2 mol of Ca2+ per mol protein, and again this capacity is reflected in the initial concentrations. Similar to the ER buffers, these are represented as Bncyt and Bccyt.
Mitochondrial buffering is given a simple representation as an immobile species homogeneously distributed throughout the cytosolic space. This is a similar representation as in the neuronal model utilized by Tang and Zucker (55), although we modify their total concentrations and reaction parameters. Such modification is a compromise with another model utilizing an immobile buffer species (56). Sala's model was intended to represent both mitochondrial and ER buffering as well as other immobile buffering, but we only implement the mitochondrial component here. Initial simulations with Zucker's parameters resulted in little or no response from immobile buffers; hence, we employ a geometric mean between Sala's and Zucker's concentrations and reaction kinetics due to these differences. Reaction kinetics for both mobile and immobile species of buffer are given in the table of parameters. Our mass-action kinetics reaction scheme is as follows:
 |
(A2) |
Membrane transport
Of primary interest for this model are the IP3 receptor channels, but we also require inclusion of SERCA on the ER membrane and PMCA on the plasma membrane. Both of these pumps operate with an opposing leakage flux that maintains equilibrium concentrations at experimentally observed levels. Hence, we expand the Φ-source and J-flux terms in Eq. A1 in illustration of these multiple flux terms:
 |
(A3) |
The spatially localized transport sources represented in the ΦCa_Membrane term are distributed either throughout the ER membrane domain as in the SERCA pumps and the ER leakage, or further localized in subdomains for the IP3R channels.
ER membrane fluxes: SERCA and leakage
The ER leakage and the SERCA activity are intimately related in this model. Leakage out of the ER into the cytosol is constructed in such a manner as to balance the SERCA at the experimentally observed baseline concentration for ER calcium. We apply the model of Shannon (26), who demonstrated that the SERCA exhibits a bidirectional operation when pumping against a high concentration gradient. At baseline concentrations of ER calcium, the bidirectional SERCA operates at a lower overall rate relative to previous unidirectional models (25). It is described by
 |
(A4) |
This formulation naturally includes both a forward, VSERCAf, and a reverse rate, VSERCAr. We follow Shannon in setting VSERCAf = VSERCAr, yet maintain distinct parameters for the corresponding binding and Hill coefficients. The Dirac delta, δErmemb (x–xSERCA), is a modified δ-localizing activity of the SERCA transporter to the geometric domain representative of the ER membrane, and is thus active only when the spatial vector  is in the membrane region. The δErmemb term is a scaling factor for conversion of molar flux to appropriate dimensions in a source term and we elaborate on this in a subsequent section.
The maximum rate of ER leakage of calcium into the cytosol is based upon the level of activity of the SERCA at baseline concentrations of cytosolic and ER calcium. Thus, the rate of leakage out of the ER is dependent on the density of SERCAs employed in our model. Overall, we employ a linear function representation of the concentration gradient between the ER lumen and cytosolic calcium for luminal calcium leakage into the cytosol, which is
 |
(A5) |
where
 |
and
 |
The baseline sub- and superscript indicates the terms here are at the initial values used for the respective concentrations and hence constant. The term  is simply the flux of calcium into the endoplasmic reticulum via the SERCA at the baseline values of cytosolic and ER luminal calcium. We thus construct the leakage term to balance the SERCA value at baseline concentrations. Beecroft (23) observed that ER calcium efflux through the leakage mechanism essentially shuts down when luminal calcium levels drop to ∼7% of baseline concentration. We represent this aspect of leakage via the φshutoff(Caer) function, which is a sigmoidal function crafted to smoothly shut down the leakage when the ER calcium reaches this observed threshold. Again, we include a spatial-localizing term in the Dirac-δ, similar to the SERCA implementation, and the σER scaling term.
Plasma membrane fluxes
Plasma membrane transport of cytosolic calcium into the extracellular space is based on the compartmental model in Smith et al. (57), where a simple linear functional dependence on Cacyt extrudes calcium from our simulated cytosol:
 |
(A6) |
The plasma membrane leakage of calcium into the cytosol from the extracellular space is then
 |
(A7) |
where the baseline superscript again indicates the leakage occurs at the constant rate of the PMCA when cytosolic calcium is at baseline levels.
IP3 receptor channel flux
Our model applies the single channel characteristics of type 2 IP3R, the most abundant isoform in RBL cells (58). Our approach resembles that of Shuai and Jung (59), where single channel kinetics are modeled as a five-state continuous time Markov chain with rates of opening and closing chosen to be consistent with open and closed dwell times reported for the IP3R. Thus, the flux through the IP3R can be described as
 |
(A8) |
Current through the IP3R channel is based on data from Tu et al. (28,29) and Bezprozvanny and Ehrlich (60), where Tu et al. (28,29) observed a unitary current of 1.9 pA (for all isoforms of IP3R) at a concentration difference of 50 mM across a lipid bilayer membrane, although they utilized Ba2+ as the charge carrier. For conversion from Ba2+ to Ca2+ we use the conductance ratio from Bezprozvanny and Ehrlich (60), and their expression i = imax/([Ba]) + KD, which results in a current of ∼0.064 pA at our baseline concentration difference of 500–0.1 μM = 499.9 μM Ca2+ (we utilize their KD = 9 mM (60)). This concentration difference dependency is implicitly part of the  and thus is of the appropriate dimensionality for inclusion in
  with the linear concentration term Caer–Cacyt. Note also this concentration term is calculated locally at the individual IP3R channel site.
The sum is over all the IP3R channels included for a simulation in the geometry, or  The function
  changes in time between 0 or 1, dependent on the times of opening and closing as determined by the stochastic gating described below. This function is included for ease in numerically resolving the opening and closing of the channel and is explained in detail in Numerical Methods. The value
  is a scaling factor for conversion of molar flux to appropriate dimensions in a source term similar to that one employed in the expression for SERCA pump flux (see above).
Five-state Monte Carlo representation for IP3R type II channel
We base our stochastically gated IP3R channel model on the presentation by Tu et al. (28,29), as given in Table 3 and as
 |
(A9) |
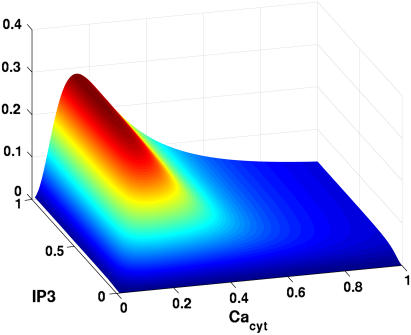
where Pmax is observed to be 0.27 for type II channels. A surface plot showing the probability dependencies on both concentrations of IP3 and cytosolic calcium is presented in Fig. A1 (adapted from (28,29)).
FIGURE A1.
Surface plot of Tu et al. (28,29), parameter dependency on IP3 and Cacyt. Based upon Tu et al. (28,29), maximal probabilities of IP3R activation at cytosolic calcium occur at ∼200 nM, and drop off quickly as it elevates to 500 nM and above.
TABLE 3.
| Parameter | Value |
|---|---|
| τopen | 7.3 (ms) |
| τclosed | 10.6 (ms) |
| kIP3 | 0.1 (μM) |
| n_IP3 | 2.2 |
| kCa | 0.16 (μM) |
| KCa | 0.15 (μM) |
| n_Ca | 2.05 |
In a manner consistent with the equilibrium open probability given by Eq. A9, we utilize a five-state representation of the IP3R similar to that presented in Bezprozvanny and Ehrlich (60):
Figure .
where the states, Si, represent the various states of the IP3R as
 |
The resulting open probability for this particular model is given by
 |
(A10) |
where Ki = ki/kir is then curve-fit to the data generated by the open probability as given in Eq. A9 with the parameters from Tu et al. (28,29); note we fix [IP3] to 2 μM for this fit as well since this is the value of IP3 concentration in the simulations. The parameter suite for the IP3R model was constrained such that the model exhibits the observed open time distribution as measured by Tu's group via the simple expression k4r = 1/τopen. Curve-fitting the data of Tu et al. to the Bezprozvanny model (60) gave us only the ratios of forward and reverse rates for the individual transitions, allowing us to explore a range of rate constants. Here we show the results obtained using two suites of parameters—suite 1 with very fast transition kinetics (loosely based on transition rates published by Baran (61)), and suite 2 with forward transition rates k1, k2, and k3 (set similar to DeYoung and Keizer (62)). Note that, in both suites, in agreement with a vast body of IP3R modeling literature (for review, see (63)), the timescale for an IP3R to exit the refractory state is much slower than other transitions. Note also that we employ a cooperativity exponent here, where n ∈ N. These parameters are listed in Table 4.
TABLE 4.
IP3R transition parameters
| Parameter | Value |
|---|---|
| k1 | 1492.7 (μM−2 s−1) (Fast; suite 1) |
| 400.0 (Slow; suite 2) | |
| k1r | 100.0 (s−1) |
| 2.68 | |
| k2 | 1000.0 (μM−2 s−1) |
| 20.0 | |
| k2r | 36.8 (s−1) |
| 0.736 | |
| k3 | 100.0 (μM−2 s−1) |
| 0.2 | |
| k3r | 1.6 (s−1) |
| 0.0032 | |
| k4 | 226.4 (s−1) |
| 226.4 | |
| k4r | 137.0 (s−1) |
| 137.0 | |
| n | 2 |
| 2 |
By virtue of our treatment of IP3 as a parameter in the model (see below) and not a diffusive species proper, we simplify the above five-state model into a four-state representation by assuming IP3 association and dissociation are sufficiently fast that the  transition rate is well approximated by
 |
(A11) |
With [IP3] set to 2.0 μM and the parameters as listed in Table 4, the IP3 binding site of IP3Rs is nearly saturated, that is, is almost always bound to the receptor so that the rate constant k2 in the five-state model is rescaled by a modest factor of 0.9835 or 0.9983 for parameter suites 1 and 2, respectively. This simplification results in the following four-state model:
Figure .
Determination of state transitions for a channel naturally depends on the current state of the channel at time t and the individual channel's transition probability. Selecting a uniformly distributed random number on the interval [0,1] and calling it Y, we then change a channel's state from, say, (S2) to (S3) if Y satisfies the relation Y ≤ k2IP3[Ca]n Δt. The suite of possible transitions is presented in Table 5 for the multitude of states. Note the multiple transitions from state (S3) or calcium-bound, active, and closed-to-open (S5), calcium-bound refractory (S4), or IP3-bound inactive (S2).
TABLE 5.
IP3R state transition conditions
| Current state | Possible transition | Transition condition |
|---|---|---|
| (S2) | (S3) | Y ≤ k2IP3[Ca]n Δt |
| (S3) | (S5) | Y ≤ k4 Δt |
| (S3) | (S2) | k4Δt < Y ≤ (k4+k2r) Δt |
| (S3) | (S4) | (k4+k2r) Δt < Y ≤ (k4+k2r+k3[Ca]n) Δt |
| (S4) | (S3) | Y ≤ k3r Δt |
| (S5) | (S3) | Y ≤ k4r Δt |
The time-step, Δt, is constrained by an adaptive time-stepping routine in the solver and is explained in detail below in Numerical Methods.
The linear difference term, (Caer–Cacyt), provides scaling of the IP3R transport as per the concentration gradient across the ER membrane at the local channel mouth, similar to the compartmental model in Michalak et al. (54). Also, analogously to the Dirac δ-terms in the SERCA and ER leakage representations, we include here a  term that restricts impact of IP3R transport to the subdomains constructed in the membrane geometry, which we depict with the vector notation
  Sections below provide elaboration on the scaling term,
  which we note here is typically unique for each individual IP3R channel in the ER reconstruction geometry due to variations in mesh size.
Single IP3R channel simulations
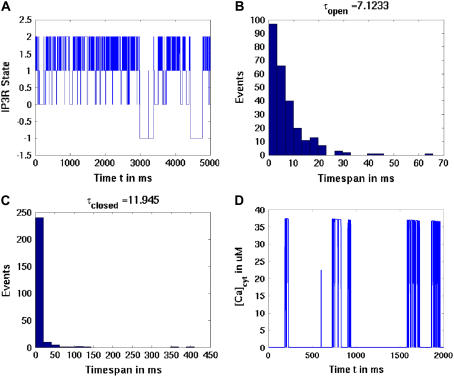
We performed numerous single-channel simulations on a simple disk geometric representation of the ER. Plots showing the results from these simulations are shown in Fig. A2, where we see the varying states of the individual IP3R over time (Fig. A2 A), as well as open and closed dwell-time distributions (Fig. A2, B and C). Concentration profile of cytosolic calcium at the channel mouth is also shown (Fig. A2 D).
FIGURE A2.
Single IP3R channel simulations. (A) One channel simulation with [IP3] set to a constant 2.0 μM and cytosolic calcium also fixed at 0.2 mM as in Tu et al. (28,29). Plot shows state of the individual IP3R over time, where the values correspond to channel state: −1 is refractory, 0 is inactive, 1 is closed, and 2 is open. (B) Distribution of open dwell times demonstrates an exponential distribution with an average open time of 7.1 ms, comparable to the data of Tu et al. of 7.3 ms. (C) Distribution of closed dwell times gives an average of ∼12 ms, again comparable to the 10.6 ms observed. (D) Calcium concentrations at the channel mouth over time, where we allow cytosolic and ER luminal calcium levels to vary as per transport through the channel mouth, albeit with a fixed [IP3] of 2.0 μM. Peak cytosolic calcium levels are ∼37 μM, although as more open events occur, we see a decrease in these peak values (most evident toward the end of the transient plot) due to the modest release of luminal ER.
IP3 representation
Crucial to calculation of the probabilities of activation in this IP3R model parameter scheme is the concentration of IP3. As noted earlier, we do not include IP3 as a diffusive species proper; rather, we represent IP3 as a parameter in our model. We assume spatial homogeneity for [IP3] and hence utilize a compartmental representation. Simulating the caged release of IP3 throughout the cytosol thus does not require the addition of another diffusive species in our system of equations.
MPSalsa and numerical solutions for reaction/diffusion
In this section, a representation of the governing system of diffusion/reaction partial differential equations (PDEs) is presented, along with a brief discussion of the PDEs describing the diffusion and reaction of Ca2+ (Caer, Cacyt) and the endogenous buffers (Ber, Bcyt, I) residing in three overall domains of the geometry: ER lumen, ER membrane, and the cytosolic domain. Discrete representations of the individual inositol triphosphate receptor (IP3R) calcium channels were each constructed with subdomains inside the ER membrane domain in either a diffuse or a clustered configuration, whereas the other ER membrane transport mechanisms (SERCA, ER Leak) were uniformly distributed over the ER membrane. The plasma membrane transports (PMCA, PM Leak) were applied on the cytosolic surface.
Briefly, we present a generalized notation for the governing diffusion/reaction systems of equations for the endoplasmic reticulum calcium model. This general notation allows us to present the essence of the finite element approximation that follows very compactly. The governing PDEs for multicomponent diffusion mass transfer and nonequilibrium chemical reactions are given by
 |
(A12) |
where Si is the concentration of species i; Di, is a 3 × 3 diffusion mass transfer tensor; Φi, is the volumetric source term for species i; and NS is the total number of unknown concentrations in the simulation. A detailed description of the complete set of PDEs is presented in succeeding sections. We present the differential equation for the free Ca2+ concentration here because it provides a useful reference for explaining the model and geometry,
 |
(A13) |
where ΦCer is the ER domain volumetric source term, ΦCyt is the cytosolic source term, and ΦMembrane is the effective membrane source term defined as
 |
(A14) |
Each Φ includes a scaling factor σ converting the molar surface flux dimensionality in Vmax flux into a source term as appropriate, which is essentially the surface/volume ratio in the interim domain where this transport source term is applied. Note, the typical dimensionality of a molar surface flux is mol/time × area. For a spatially localized representation of such a surface flux, we require the dimensions of mol/time × volume; hence, the conversion factor σ provides the appropriate dimension for the domain of activity of the source term (ER membrane or IP3R channel subdomain). Moreover, this scaling factor naturally appears in all the source-term transport mechanisms with molar surface flux maximal currents but it differs between the SERCA and ER leakage, and IP3R terms. The SERCA and Leakage transport sources are uniformly distributed throughout the interim ER membrane domain but the IP3R transport sources are localized in discrete subdomains whose meshing details are described in more detail below.
In the ER simulation, the diffusion tensor is simply a scalar coefficient, DCa, multiplying the identity tensor since diffusion in our system is isotropic. The buffering reactions are represented by the ΦCer and ΦCcyt terms, which include both mobile buffering in the ER and cytosol and immobile buffering only in the cytosol. Transport mechanisms that carry Ca2+ across the ER membrane are modeled as the local source terms,  ΦSERCA, and ΦERLeak, whereas plasma membrane transports (PMCA, PM Leak) are surface flux terms on the cytosolic surface, JPMCA and JPMLeak, as noted below.
Three-dimensional simulations (unstructured mesh finite element methods)
Simulations of the full three-dimensional model with the complex distribution of IP3R channels was carried out using a Galerkin finite element (FE) method as implemented in the MPSalsa transport/reaction simulation code (64). The system of NS reaction/diffusion equation is solved in bounded open region Ω in R3, with a sufficiently smooth boundary ∂Ω = Γext over the time interval (0,γ). The formal Galerkin weak form of the governing reaction/diffusion system is derived as follows. First, we multiply Eq. A15 by a test function ψ from the appropriate space  (65), which gives
 |
(A15) |
Using the Divergence theorem, we obtain the resulting weak form
 |
(A16) |
of the governing equations. As a result of using the Divergence theorem, the surface flux term (the last term in Eq. A16) is evident. This term accounts for fluxes across the external cytosolic boundary. In our case, this has two contributions, JPMCA and JPMLeak, which account for the plasma membrane extrusion via the PMCA and leakage into the cytosol from the extracellular space. A Galerkin finite element formulation for these equations restricts this system to a finite dimensional subspace In our implementation, we use linear hexahedral and tetrahedral elements that have a formal order of accuracy of O(h2).
To complete the description of the method, we define the approximation to the time derivative by a first- or second-order approximation based on a Backward Euler or Trapezoidal rule method, respectively. This discrete approximation forms a large sparse system of nonlinear algebraic equations. Below, we briefly overview the critical issues of spatial and temporal resolution of the diffusion/reaction system and the parallel nonlinear and linear solution methods that are employed to solve the FE system of equations. A more detailed discussion of the spatial and temporal accuracy of these methods applied to diffusion/reaction problems can be found in Ropp et al. (66).
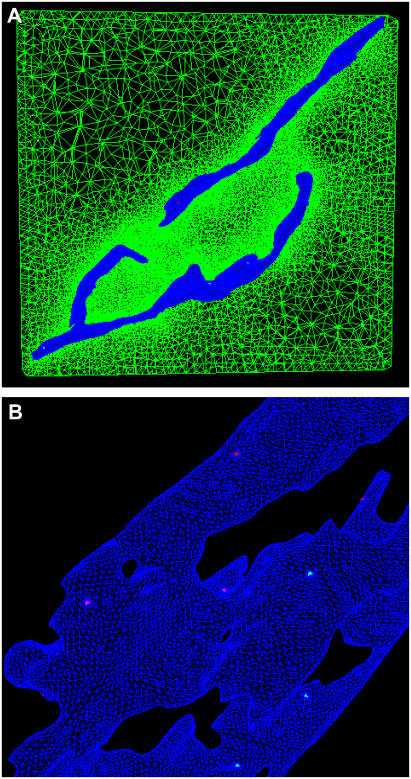
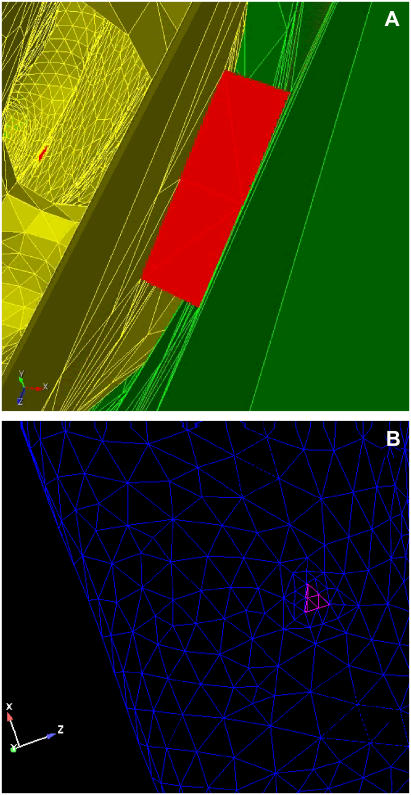
Implementation of the IP3R channel representations are essentially spatially localized source terms active in the channel subdomains embedded in the ER membrane's geometric domain. This geometry requires resolution of multiple length scales for the representation of small IP3R channel distributions and the overall ER and cytosolic cell domains, which we accomplish via unstructured finite element tetrahedral meshes. An example of this type of mesh is shown in Fig. A3. To adequately represent the smallest length scales (i.e., channels), local refinement around the channels are required. Elements remote from channels were increased in size to decrease the required number of elements in the simulation. In Fig. A4, we show a closeup of the local resolution of this unstructured FE mesh. The advantage of an unstructured FE method, over a structured mesh PDE approximation, is significant and makes solution of complex problems of this type tractable on modern parallel supercomputing hardware.
FIGURE A3.
ER surface and cytosolic mesh. (A) Slice plane intersecting tetrahedrons in the cytosolic domain surrounding the ER illustrates the unstructured mesh variation in tetrahedral size. The cytosolic tetrahedrons range from 1.1 × 10⁻⁸ to 1.9 × 10⁻³ μm3, allowing for higher resolution of the ER surface while reducing numbers of unknowns in the larger cytosolic space. (B) The surface of the ER mesh, typically comprised of triangles with surface area of ∼1.75 × 10⁻⁴ μm2, which ranges over 6.7 × 10⁻⁶ to 5.3 × 10⁻⁴ μm2. Individual IP3R channel subdomains are visible in a diffuse distribution, where we define “diffuse” as each channel having no neighboring channels within at least two elements.
FIGURE A4.
IP3R channel subdomain. (A) View of an IP3R subdomain. The group of tetrahedrons (12 per channel) embedded in the ER membrane subdomain is the site of calcium transport from the luminal (gold) to the cytosolic (green) domains. Each such channel subdomain is comprised of groups of tetrahedrons selected and refined given criteria such as surface area (10−4 μm2), corresponding to known ion channel mouth size, and aspect ratio. (B) Surface view of IP3R subdomain on ER membrane. Each channel region has a layer of surrounding triangles and tetrahedrons refined for greater resolution and improved convergence in the solver.
In general, the governing diffusion/reaction equations and the discrete approximations to these equations produce a stiff system with multiple timescales. The stiffness of these equations is produced by the discrete approximation to the diffusion operator and by the source term operator. To integrate this stiff system in a stable and efficient way, we employ fully implicit solution methods. These techniques allow the simulation to resolve the dynamical timescale of interest (in this case the activation of the IP3R channels and the subsequent diffusion wave front) while not requiring the simulation to run at the fastest stiff timescales of the system for stability. It has been recently shown that fully implicit methods can have significant advantages in stability and accuracy when compared to some common operator split or semi-implicit methods for a subset of diffusion/reaction systems (66,67). In the time integration of our model cell, a second-order (trapezoidal rule) method is used and the time-step size is adapted to obtain a selected user-defined error tolerance using a predictor/corrector strategy (64). To adequately resolve this IP3R channel release, we selected an initial time-step size of 0.01 ms; the adaptive time-stepping routine typically decreased the step size to a minimum of ∼0.001 ms during stimulation, and was allowed to increase to a maximum of 0.05 ms during recovery after stimulation.
Due to the stochastic nature of our IP3R model and the temporal dependence of transition probabilities, we require treatment of the time step such that the transition probabilities are not too large, i.e., no probability of transition >∼0.1. The existing adaptive time-stepping routine in MPSalsa was constructed to refine or coarsen the time step, depending on the convergence of the nonlinear solver. We therefore modified the adaptive time-stepping routine such that when a channel is in a state that experiences a transition probability exceeding 0.08, a global constraint on the maximal time step is applied. Since this global constraint can only apply to the successive time step, the upper bound of 0.08 provides a degree of latitude for the transition probability to increase at the next time step due to mass transfer increasing localized species' concentrations. Within this global time-step constraint, all transition probabilities for all IP3R channels are necessarily maintained within the upper bound of 0.1.
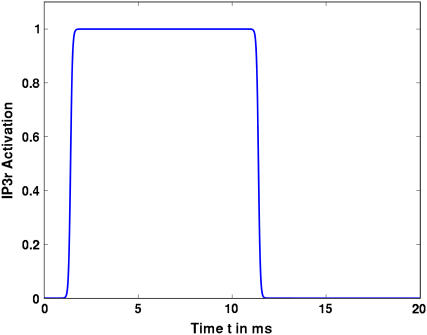
We modified the opening and closing behavior of the channels to improve the adaptive time-stepping for performance reasons. Thus we elaborate here on the function  which is used to ease difficulty for the adaptive time stepper in resolving the opening and closing of the IP3R channel. Note, it is not implemented as a simple Heaviside step-function. Initially, we used such a switching function, but initial simulations with such a stiff behavior of the channel resulted in time steps dropping to 0.0001 ms (within constraints applied to the adaptive time-stepping method). To improve the performance of the adaptive time-stepping resolution of this behavior, we instead stretch out the opening and closing of the channel with hyperbolic tangent functions as
 |
(A17) |
The  terms are simply for controlling the shape of the hyperbolic tangents such that it nearly approximates a square-impulse function but without the numerically challenging discontinuity. An example of this function is shown in Fig. A5.
FIGURE A5.
IP3R activation function plot. Example of hyperbolic tangent activation function,  The function activates at time t = 1 ms and remains open for 10 ms. Note the offset opening and closing curves due to the time lag between when the channel is activated and maximally open at the value of 1. Similarly, a delay occurs during closure when the channel shuts from the value of 1 to 0. The shape parameter,
  is set to 8, resulting in the nearly-square profile.
Numerical experiments were performed on simple geometries representing the ER/ER membrane/cytosolic domains, which demonstrated acceptable relative errors (<1% utilizing equilibrium concentrations from transport mechanisms as a norm) to determine that this integration procedure was accurate.
As presented above, the fully implicit FE approximation of the diffusion/reaction system produces a very large system of nonlinear algebraic equations. To solve these coupled systems, we use Newton's method as a nonlinear solver and employ Krylov iterative solver techniques (conjugate gradient or generalized minimum residual) with domain decomposition preconditioners to solve the linear systems at each substep. The decomposition and mapping of the FE domain (the ER lumen, ER membrane, and cytosol) onto the parallel machine is accomplished by a graph-portioning method. Chaco (68), a general graph partitioning tool, is used to partition the FE mesh into subdomains and make subdomain-to-processor assignments. Chaco constructs partitions and subdomain mappings that have low communication volume, good load balance, few message startups, and only small amounts of network congestion. In Fig. A6, we present an example partition of the cytosolic cell mesh on 64 processors. In this figure, the color assignment of FE nodes is used to visualize the assignment of contiguous elements to processors. Communication occurs across interprocessor boundaries to update information that is computed on neighboring processors. For a detailed description of parallel FE data structures and a discussion of the strong link between partitioning quality and parallel efficiency, see Hendrickson and Leland (68) and Shadid et al. (69). Finally, the domain decomposition preconditioners are based on parallel additive Schwarz domain decomposition methods (70) that use approximate incomplete LU solvers on each subdomain. These preconditioners are used to efficiently solve the linear systems with a high degree of parallel scalability to thousands of processors. For a typical time step, this solution procedure requires one or two Newton steps and ∼50 linear iterations per Newton step.
FIGURE A6.
Mesh decomposition. Each colored region in the image shows a partitioned domain assigned to an individual processor for the parallel solution of the problem. The static load-balancing code determines the number of elements assigned to each processor so that each processor receives an equivalent computational load. Note the decreased region size (interior view, right) as the tetrahedral density increases at the ER surface.
Alexander J. Smith's present address is Dept. of Physiology, University of Toronto, Toronto, Ontario M5S 1A8.
References
- 1.Barker, S. A., D. Lujan, and B. S. Wilson. 1999. Multiple roles for PI 3-kinase in the regulation of PLCγ activity and Ca2+ mobilization in antigen-stimulated mast cells. J. Leukoc. Biol. 65:321–329. [DOI] [PubMed] [Google Scholar]
- 2.Barker, S. A., K. K. Caldwell, A. Hall, A. M. Martinez, J. R. Pfeiffer, J. M. Oliver, and B. S. Wilson. 1995. Wortmannin blocks lipid and protein kinase activities associated with PI 3-kinase and inhibits a subset of responses induced by FcɛRI cross-linking. Mol. Biol. Cell. 6:1145–1158. [DOI] [PMC free article] [PubMed] [Google Scholar]
- 3.Barker, S. A., K. K. Caldwell, J. R. Pfeiffer, and B. S. Wilson. 1998. Wortmannin-sensitive phosphorylation, translocation and activation of PLCγ1, but not PLCγ2, in antigen-stimulated RBL-2H3 mast cells. Mol. Biol. Cell. 9:483–496. [DOI] [PMC free article] [PubMed] [Google Scholar]
- 4.Smith, A. J., Z. Surviladze, E. A. Gaudet, J. M. Backer, C. A. Mitchell, and B. S. Wilson. 2001. p110β and p110 δ-phosphatidylinositol 3-kinases up-regulate FcɛRI-activated Ca2+ influx by enhancing inositol 1,4,5-trisphosphate production. J. Biol. Chem. 276:17213–17220. [DOI] [PubMed] [Google Scholar]
- 5.Lee, R. J., D. E. Lujan, A. L. Hall, L. A. Sklar, B. S. Wilson, and J. M. Oliver. 1997. Cooperation between the FcɛR1 and formyl peptide receptor signaling pathways in RBL(FPR) cells: the contribution of receptor-specific Ca2+ mobilization responses. Biochem. Biophys. Res. Commun. 235:812–819. [DOI] [PubMed] [Google Scholar]
- 6.Fasolato, C., M. Hoth, and R. Penner. 1993. A GTP-dependent step in the activation mechanism of capacitative calcium influx. J. Biol. Chem. 268:20737–20740. [PubMed] [Google Scholar]
- 7.Beaven, M. S., J. Roger, J. P. Moore, T. R. Hesketh, G. A. Smith, and J. C. Metcalfe. 1984. The mechanisms of the calcium signal and correlation with histamine release in 2H3 cells. J. Biol. Chem. 259:7129–7136. [PubMed] [Google Scholar]
- 8.Bezprozvanny, I. 2005. The inositol 1,4,5-trisphosphate receptors. Cell Calcium. 38:261–272. [DOI] [PubMed] [Google Scholar]
- 9.Wilson, B. S., J. R. Pfeiffer, A. J. Smith, J. M. Oliver, J. A. Oberdorf, and R. J. Wojcikiewicz. 1998. Calcium-dependent clustering of inositol 1,4,5-trisphosphate receptors. Mol. Biol. Cell. 9:1465–1478. [DOI] [PMC free article] [PubMed] [Google Scholar]
- 10.Tomita, M. 2001. Whole-cell simulation: a grand challenge of the 21st century. Trends Biotechnol. 19:205–210. [DOI] [PubMed] [Google Scholar]
- 11.Slepchenko, B. M., J. C. Schaff, I. Macara, and L. M. Loew. 2003. Quantitative cell biology with the virtual cell. Trends Cell Biol. 13:570–576. [DOI] [PubMed] [Google Scholar]
- 12.Stiles, J. R., T. M. Bartol, Jr., E. E. Salpeter, and M. M. Salpeter. 1998. Monte Carlo simulation of neurotransmitter release using MCell, a general simulator of cellular physiological processes. In Computational Neuroscience. J. M. Bower, Editor. Plenum Press, NY. 279–284.
- 13.Coggan, J. S., T. M. Bartol, E. Esquenazi, J. R. Stiles, S. Lamont, M. E. Martone, D. K. Berg, M. H. Ellisman, and T. J. Sejnowski. 2005. Evidence for ectopic neurotransmission at a neuronal synapse. Science. 309:446–451. [DOI] [PMC free article] [PubMed] [Google Scholar]
- 14.Griffiths, G., G. Warren, P. Quinn, O. Mathieu-Costello, and H. Hoppeler. 1984. Density of newly synthesized plasma membrane proteins in intracellular membranes. I. Stereological studies. J. Cell Biol. 98:2133–2141. [DOI] [PMC free article] [PubMed] [Google Scholar]
- 15.Pfeiffer, J. R., J. C. Seagrave, B. H. Davis, G. G. Deanin, and J. M. Oliver. 1985. Membrane and cytoskeletal changes associated with IgE-mediated serotonin release from rat basophilic leukemia cells. J. Cell Biol. 101:2145–2155. [DOI] [PMC free article] [PubMed] [Google Scholar]
- 16.Wojcikiewicz, R. J. H., and S. G. Luo. 1998. Differences among type I, II, and III inositol-1,4,5-trisphosphate receptors in ligand-binding affinity influence the sensitivity of calcium stores to inositol-1,4,5-trisphosphate. Mol. Pharmacol. 53:656–662. [DOI] [PubMed] [Google Scholar]
- 17.Allbritton, N. L., T. Meyer, and L. Stryer. 1992. Range of messenger action of calcium ion and inositol 1,4,5-trisphosphate. Science. 258:1812–1815. [DOI] [PubMed] [Google Scholar]
- 18.Dayel, M. J., E. F. Hom, and A. S. Verkman. 1999. Diffusion of green fluorescent protein in the aqueous-phase lumen of endoplasmic reticulum. Biophys. J. 76:2843–2851. [DOI] [PMC free article] [PubMed] [Google Scholar]
- 19.Treves, S., A. De Mattei, M. Lanfredi, A. Villa, N. M. Green, D. H. MacLennan, J. Meldolesi, and T. Pozzan. 1990. Calreticulin is a candidate for a calsequestrin-like function in Ca2+-storage compartments (calciosomes) of liver and brain. Biochem. J. 272:473–480. [DOI] [PMC free article] [PubMed] [Google Scholar]
- 20.Chadwick, C. C., A. Saito, and S. Fleischer. 1990. Isolation and characterization of the inositol trisphosphate receptor from smooth muscle. Proc. Natl. Acad. Sci. USA. 87:2132–2136. [DOI] [PMC free article] [PubMed] [Google Scholar]
- 21.Jiang, Q. X., E. C. Thrower, D. W. Chester, B. E. Ehrlich, and F. J. Sigworth. 2002. Three-dimensional structure of the type 1 inositol 1,4,5-trisphosphate receptor at 24 Å resolution. EMBO J. 21:3575–3581. [DOI] [PMC free article] [PubMed] [Google Scholar]
- 22.Patterson, R. L., D. Boehning, and S. H. Snyder. 2004. Inositol 1,4,5-trisphosphate receptors as signal integrators. Annu. Rev. Biochem. 73:437–465. [DOI] [PubMed] [Google Scholar]
- 23.Beecroft, M. D., and C. W. Taylor. 1998. Luminal Ca2+ regulates passive Ca2+ efflux from the intracellular stores of hepatocytes. Biochem. J. 334:431–435. [DOI] [PMC free article] [PubMed] [Google Scholar]
- 24.Bergling, S., R. Dolmetsch, R. S. Lewis, and J. Keizer. 1998. A fluorometric method for estimating the calcium content of internal stores. Cell Calcium. 23:251–259. [DOI] [PubMed] [Google Scholar]
- 25.Berman, M. C. 1999. Regulation of Ca2+ transport by sarcoplasmic reticulum Ca2+-ATPase at limiting [Ca2+]. Biochim. Biophys. Acta. 1418:48–60. [DOI] [PubMed] [Google Scholar]
- 26.Shannon, T. R., K. S. Ginsburg, and D. M. Bers. 2000. Potentiation of fractional sarcoplasmic reticulum calcium release by total and free intra-sarcoplasmic reticulum calcium concentration. Biophys. J. 78:334–343. [DOI] [PMC free article] [PubMed] [Google Scholar]
- 27.da Fonseca, P. C., S. A. Morris, E. P. Nerou, C. W. Taylor, and E. P. Morris. 2003. Domain organization of the type 1 inositol 1,4,5-trisphosphate receptor as revealed by single-particle analysis. Proc. Natl. Acad. Sci. USA. 100:3936–3941. [DOI] [PMC free article] [PubMed] [Google Scholar]
- 28.Tu, H., Z. Wang, E. Nosyreva, H. De Smedt, and I. Bezprozvanny. 2005. Functional characterization of mammalian inositol 1,4,5-trisphosphate receptor isoforms. Biophys. J. 88:1046–1055. [DOI] [PMC free article] [PubMed] [Google Scholar]
- 29.Tu, H., Z. Wang, and I. Bezprozvanny. 2005. Modulation of mammalian inositol 1,4,5-trisphosphate receptor isoforms by calcium: a role of calcium sensor region. Biophys. J. 88:1056–1069. [DOI] [PMC free article] [PubMed] [Google Scholar]
- 30.Stump, R. F., J. R. Pfeiffer, M. C. Schneebeck, J. C. Seagrave, and J. M. Oliver. 1989. Mapping gold-labeled receptors on cell surfaces by backscattered electron imaging and digital image-analysis. Studies of the IgE receptor on mast cells. Am. J. Anat. 185:128–141. [DOI] [PubMed] [Google Scholar]
- 31.Ölveczky, B. P., and A. S. Verkman. 1998. Monte Carlo analysis of obstructed diffusion in three dimensions: application to molecular diffusion in organelles. Biophys. J. 74:2722–2730. [DOI] [PMC free article] [PubMed] [Google Scholar]
- 32.Thul, R., and M. Falcke. 2004. Release currents of IP3 receptor channel clusters and concentration profiles. Biophys. J. 86:2660–2673. [DOI] [PMC free article] [PubMed] [Google Scholar]
- 33.Bird, G. S., J. F. Obie, and J. W. J. Putney. 1992. Sustained Ca2+ signaling in mouse lacrimal acinar cells due to photolysis of “caged” glycerophosphoryl-myo-inositol 4,5-bisphosphate. J. Biol. Chem. 267:17722–17725. [PubMed] [Google Scholar]
- 34.Meldolesi, J., and T. Pozzan. 1998. The heterogeneity of ER Ca2+ stores has a key role in nonmuscle cell signaling and function. J. Cell Biol. 142:1395–1398. [DOI] [PMC free article] [PubMed] [Google Scholar]
- 35.Golovina, V. A., and M. P. Blaustein. 1997. Spatially and functionally distinct Ca2+ stores in sarcoplasmic and endoplasmic reticulum. Science. 275:1643–1648. [DOI] [PubMed] [Google Scholar]
- 36.Papp, S., E. Dziak, M. Michalak, and M. Opas. 2003. Is all of the endoplasmic reticulum created equal? The effects of the heterogeneous distribution of endoplasmic reticulum Ca2+-handling proteins. J. Cell Biol. 160:475–479. [DOI] [PMC free article] [PubMed] [Google Scholar]
- 37.Simpson, P. B., and J. T. Russell. 1997. Role of sarcoplasmic/endoplasmic-reticulum Ca2+-ATPases in mediating Ca2+ waves and local Ca2+-release microdomains in cultured glia. Biochem. J. 325:239–247. [DOI] [PMC free article] [PubMed] [Google Scholar]
- 38.Parys, J. B., L. Missiaen, H. DeSmedt, I. Sienaert, and R. Casteels. 1996. Mechanisms responsible for quantal Ca2+ release from inositol trisphosphate-sensitive calcium stores. Eur. J. Physiol. 432:359–367. [DOI] [PubMed] [Google Scholar]
- 39.Ferris, C. D., R. L. Huganir, S. Supattapone, and S. H. Snyder. 1989. Purified inositol 1,4,5-trisphosphate receptor mediates calcium flux in reconstituted lipid vesicles. Nature. 342:870–889. [DOI] [PubMed] [Google Scholar]
- 40.Perez, P. J., J. Ramos-Granco, M. Fill, and G. A. Mignery. 1997. Identification and functional reconstitution of the type 2 inositol 1,4,5-trisphosphate receptor from ventricular cardiac myocytes. J. Biol. Chem. 272:23961–23969. [DOI] [PubMed] [Google Scholar]
- 41.Sienaert, I., L. Missiaen, H. De Smedt, J. B. Parys, H. Sipma, and R. Casteels. 1997. Molecular and functional evidence for multiple Ca2+-binding domains in the type 1 inositol 1,4,5-trisphosphate receptor. J. Biol. Chem. 272:25899–25906. [DOI] [PubMed] [Google Scholar]
- 42.Tateishi, Y., M. Hattori, T. Nakayama, M. Iwai, H. Bannai, T. Nakamura, T. Michikawa, T. Inoue, and K. Mikoshiba. 2005. Cluster formation of inositol 1,4,5-trisphosphate receptor requires its transition to open state. J. Biol. Chem. 280:6816–6822. [DOI] [PubMed] [Google Scholar]
- 43.Fink, C. C., B. Slepchenko, I. I. Moraru, J. Schaff, J. Watras, and L. M. Loew. 1999. Morphological control of inositol-1,4,5-trisphosphate-dependent signals. J. Cell Biol. 147:929–936. [DOI] [PMC free article] [PubMed] [Google Scholar]
- 44.Hermosura, M. C., H. Takeuchi, A. Fleig, A. M. Riley, B. V. Potter, M. Hirata, and R. Penner. 2000. InsP4 facilitates store-operated calcium influx by inhibition of InsP3,5-phosphatase. Nature. 408:735–740. [DOI] [PubMed] [Google Scholar]
- 45.Hoth, M., and R. Penner. 1992. Depletion of intracellular calcium stores activates a calcium current in mast cells. Nature. 355:353–356. [DOI] [PubMed] [Google Scholar]
- 46.Parekh, A. B., and R. Penner. 1995. Depletion-activated calcium current is inhibited by protein kinase in RBL-2H3 cells. Proc. Natl. Acad. Sci. USA. 92:7907–7911. [DOI] [PMC free article] [PubMed] [Google Scholar]
- 47.Parekh, A. B., A. Fleig, and R. Penner. 1997. The store-operated calcium current ICRAC: nonlinear activation by InsP3 and dissociation from calcium release. Cell. 89:973–980. [DOI] [PubMed] [Google Scholar]
- 48.Bolotina, V. M. 2004. Store-operated channels: diversity and activation mechanisms. Sci. STKE. 243:34. [DOI] [PubMed] [Google Scholar]
- 49.Randriamampita, C., and R. Y. Tsien. 1993. Emptying of intracellular Ca2+ stores releases a novel small messenger that stimulates Ca2+ influx. Nature. 364:809–814. [DOI] [PubMed] [Google Scholar]
- 50.Smani, T., S. I. Zakharov, E. Leno, P. Csutora, E. S. Trepakova, and V. M. Bolotina. 2003. Ca2+-independent phospholipase A2 is a novel determinant of store-operated Ca2+ entry. J. Biol. Chem. 278:11909–11915. [DOI] [PubMed] [Google Scholar]
- 51.Mori, M. X., M. G. Erickson, and D. T. Yue. 2004. Functional stoichiometry and local enrichment of calmodulin interacting with Ca2+ channels. Science. 304:432–434. [DOI] [PubMed] [Google Scholar]
- 52.Baksh, S., and M. Michalak. 1991. Expression of calreticulin in Escherichia coli and identification of its Ca2+ binding domains. J. Biol. Chem. 266:21458–21465. [PubMed] [Google Scholar]
- 53.Johnson, J. D., C. Snyder, M. Walsh, and M. Flynn. 1996. Effects of myosin light chain kinase and peptides on Ca2+ exchange with the N- and C-terminal Ca2+ binding sites of calmodulin. J. Biol. Chem. 271:761–767. [DOI] [PubMed] [Google Scholar]
- 54.Michalak, M., E. F. Corbett, N. Mesaeli, K. Nakamura, and M. Opas. 1999. Calreticulin: one protein, one gene, many functions. Biochem. J. 344:281–292. [PMC free article] [PubMed] [Google Scholar]
- 55.Tang, Y., and R. S. Zucker. 1997. Mitochondrial involvement in post-tetanic potentiation of synaptic transmission. Neuron. 18:483–491. [DOI] [PubMed] [Google Scholar]
- 56.Sala, F., and A. Hernandez-Cruz. 1990. Calcium diffusion modeling in a spherical neuron. Relevance of buffering properties. Biophys. J. 57:313–324. [DOI] [PMC free article] [PubMed] [Google Scholar]
- 57.Smith, G. D., R. J. Lee, J. M. Oliver, and J. Keizer. 1996. Effect of Ca2+ influx on intracellular free Ca2+ responses in antigen-stimulated RBL-2H3 cells. Am. J. Physiol. 270:C939–C952. [DOI] [PubMed] [Google Scholar]
- 58.Tovey, S. C., P. de Smet, P. Lipp, D. Thomas, K. W. Young, L. Missiaen, H. De Smedt, J. B. Parys, M. J. Berridge, J. Thuring, A. Holmes, and M. D. Bootman. 2001. Calcium puffs are generic InsP3-activated elementary calcium signals and are downregulated by prolonged hormonal stimulation to inhibit cellular calcium responses. J. Cell Sci. 114:3979–3989. [DOI] [PubMed] [Google Scholar]
- 59.Shuai, J. W., and P. Jung. 2002. Stochastic properties of Ca2+ release of inositol 1,4,5-trisphosphate receptor clusters. Biophys. J. 83:87–97. [DOI] [PMC free article] [PubMed] [Google Scholar]
- 60.Bezprozvanny, I., and B. E. Ehrlich. 1994. Inositol (1,4,5)-trisphosphate (InsP3)-gated Ca channels from cerebellum: conduction properties for divalent cations and regulation by intraluminal calcium. J. Gen. Physiol. 104:821–856. [DOI] [PMC free article] [PubMed] [Google Scholar]
- 61.Baran, I. 2005. Gating mechanisms of the type-1 inositol trisphosphate receptor. Biophys. J. 89:979–998. [DOI] [PMC free article] [PubMed] [Google Scholar]
- 62.De Young, G. W., and J. Keizer. 1992. A single-pool inositol 1,4,5-trisphosphate-receptor-based model for agonist-stimulated oscillations in Ca2+ concentration. Proc. Natl. Acad. Sci. USA. 89:9895–9899. [DOI] [PMC free article] [PubMed] [Google Scholar]
- 63.Sneyd, J., and M. Falcke. 2005. Models of the inositol trisphosphate receptor. Prog. Biophys. Mol. Biol. 89:207–245. [DOI] [PubMed] [Google Scholar]
- 64.Shadid, J., A. Salinger, R. Schmidt, T. Smith, S. Hutchinson, G. Hennigan, K. Devine, and H. Moffat. 1998. MPSalsa, Ver. 1.5:A. MPSalsa: A Finite Element Computer Program for Reacting Flow Problems. Part 1: Theoretical Development. Sandia National Laboratories Technical Report, SAND98–2864.
- 65.Thomee, V. 1997. Galerkin Finite Element Methods for Parabolic Problems. Springer-Verlag, New York.
- 66.Ropp, D. L., J. N. Shadid, and C. C. Ober. 2004. Studies on the accuracy of time integration methods for reaction-diffusion equations. J. Comput. Phys. 194:544–574. [Google Scholar]
- 67.Knoll, D. A., L. Chacon, L. G. Margolin, and V. A. Mousseau. 2003. On balanced approximations for time integration of multiple timescale systems. J. Comput. Phys. 185:583–611. [Google Scholar]
- 68.Hendrickson, B., and R. Leland. 1995. The Chaco User's Guide, Ver. 2.0. Sandia National Laboratories Technical Report, SAND95–2344, Albuquerque, NM.
- 69.Shadid, J. N., S. A. Hutchinson, G. L. Hennigan, H. K. Moffat, K. D. Devine, and A. G. Salinger. 1997. Efficient parallel computation of unstructured finite element reacting flow solutions. Parallel Comput. 23:1307–1325. [Google Scholar]
- 70.Smith, B. F., P. E. Bjorstad, and W. D. Gropp. 1996. Domain Decomposition: Parallel Multilevel Methods for Elliptic Partial Differential Equations. Cambridge University Press, Cambridge, UK.
- 71.Yu, R., and P. M. Hinkle. 2000. Rapid turnover of calcium in the endoplasmic reticulum during signaling. Studies with chameleon calcium indicators. J. Biol. Chem. 275:23648–23653. [DOI] [PubMed] [Google Scholar]
- 72.Nasi, E., and D. Tillotson. 1985. The rate of diffusion of Ca2+ and Ba2+ in a nerve cell body. Biophys. J. 47:735–738. [DOI] [PMC free article] [PubMed] [Google Scholar]
- 73.Eisenrauch, A., and E. Bamberg. 1990. Voltage-dependent pump currents of the sarcoplasmic reticulum Ca2+-ATPase in planar lipid membranes. FEBS Lett. 268:152–156. [DOI] [PubMed] [Google Scholar]


