

Abstract
We constructed a microscope-based instrument capable of simultaneous, spatially coincident optical trapping and single-molecule fluorescence. The capabilities of this apparatus were demonstrated by studying the force-induced strand separation of a dye-labeled, 15-basepair region of double stranded DNA, with force applied either parallel (“unzipping” mode) or perpendicular (“shearing” mode) to the long axis of the region. Mechanical transitions corresponding to DNA hybrid rupture occurred simultaneously with discontinuous changes in the fluorescence emission. The rupture force was strongly dependent on the direction of applied force, indicating the existence of distinct unbinding pathways for the two force-loading modes. From the rupture force histograms, we determined the distance to the thermodynamic transition state and the thermal off rates in the absence of load for both processes.
Introduction
Optical trapping (OT) and single-molecule fluorescence (SMF) are two powerful techniques that have facilitated much of the progress in the new field of single-molecule biophysics. OT can supply well-controlled loads that modify the free energy landscape of catalysis, translocation, or folding/unfolding in macromolecules1. Position-detection systems incorporated into OT systems can report on the corresponding molecular displacements with sensitivities of nanometers. OT instruments have been used to explore the molecular mechanics of biological motors2, receptor-ligand binding3–5, and biopolymer physics6–8. SMF approaches can probe length scales even smaller than those accessible to optical traps. Moreover, interactions between fluorophores — such as either fluorescence resonant energy transfer (FRET) or fluorescence quenching — can report on the separation and relative orientations of different domains within a macromolecule. Such interactions provide a spatial resolution of angstroms, and can therefore be used to monitor conformational changes occurring within proteins and nucleic acids, as well as elucidate the dynamic and structural properties of biomolecules9–12.
As powerful as the two techniques are individually, they each suffer from specific limitations that can be overcome, in principle, by their application in concert. For example, it can be difficult to determine precisely where within a macromolecular complex the load imposed by OT exerts its effect. This location can be pinpointed by SMF, by attaching fluorescent probes to molecular subdomains and monitoring their subsequent motions. Conversely, the addition of an optical trap to a SMF experiment can provide the ability to transport (or constrain) a macromolecule to an area optimized for fluorescence excitation, reducing the background light produced by neighboring fluorophores. In addition, molecules of interest can be trapped and aligned prior to exposure to excitation light, thereby increasing the useful fluorescence lifetime. Finally, correlations between fluorescence and mechanical signals can supply more information than can be obtained from either alone. For example, one can relate structural rearrangements occurring within molecules to their larger-scale motions to explore the mechanisms underlying conformational changes. Similarly, molecular binding events observed by fluorescence can be related to structural changes perturbed by load to determine the coupling between mechanical and biochemical cycles13.
Marrying OT with SMF, however, poses technical challenges. The comparatively high light levels associated with the trapping and position detection lasers can reduce fluorophore lifetimes through unwanted multi-photon bleaching of dyes or other destructive photochemical routes. Moreover, the optical trap laser contributes light that can obscure the relatively weak fluorescence signal: a typical trap generates a photon flux roughly 15 orders of magnitude greater than that emitted by a single fluorophore. As a result, earlier attempts to combine OT with SMF did not achieve simultaneous, spatially coincident measurements. In previous work, these techniques were applied sequentially13, or separately14, by physically displacing the optical trap from the region of fluorescence excitation through a relatively large distance (~15 μm). While these alternative approaches avoid photobleaching problems arising from the optical trap, each carries certain drawbacks. Sequential application precludes the possibility of temporally correlating the mechanical and fluorescence signals, while spatial separation imposes fairly severe restrictions on the experimental geometries that can be achieved.
Here, we demonstrate simultaneous and spatially-coincident OT and SMF by using an optical trap to separate the two strands of individual, fluorescent dye-labeled DNA molecules while monitoring both force and fluorescence. A preliminary report of this work has appeared15. We dissociated the duplex molecules using forces applied either perpendicular or parallel to the long axis of a short, 15-bp hybrid region (termed “unzipping” or “shearing” modes, respectively), and compiled histograms of the rupture forces involved. These data constitute, to our knowledge, the first direct determination of the unzipping and shearing forces associated with a given DNA hybrid sequence. From the rupture force distributions, we extract zero-force parameters for the system, including the thermal off-rate in the absence of load and the distance to the transition state along the reaction coordinate. These parameters can be used to extend our knowledge of the energetics of DNA strand separation, providing a better understanding of the process by which DNA-related enzymes gain access to the genetic information encoded within the strands
Results and Discussion
Fig. 3 displays simultaneous single-molecule force (red) and fluorescence (blue) traces recorded for four different experimental geometries, exerting either an unzipping or shearing force on a 15-bp hybridized region of DNA with TAMRA dyes conjugated at the various positions shown (Fig. 2). Fig. 3a shows representative traces corresponding to an unzipping force, with the fluorophore linked to the long DNA strand. Prior to rupture, the dye fluoresces normally. Upon rupture, the fluorescence level decreases abruptly to an intermediate value as the bead-tethered fluorophore is pulled from the strongest region of evanescent wave excitation. The changes in the fluorescence and force are concurrent. The fluorescence level decreases to the background level when the computer, automatically detecting the rupture, instructs the optical trap to deflect the bead further from the excitation region (see Methods).
Figure 3.
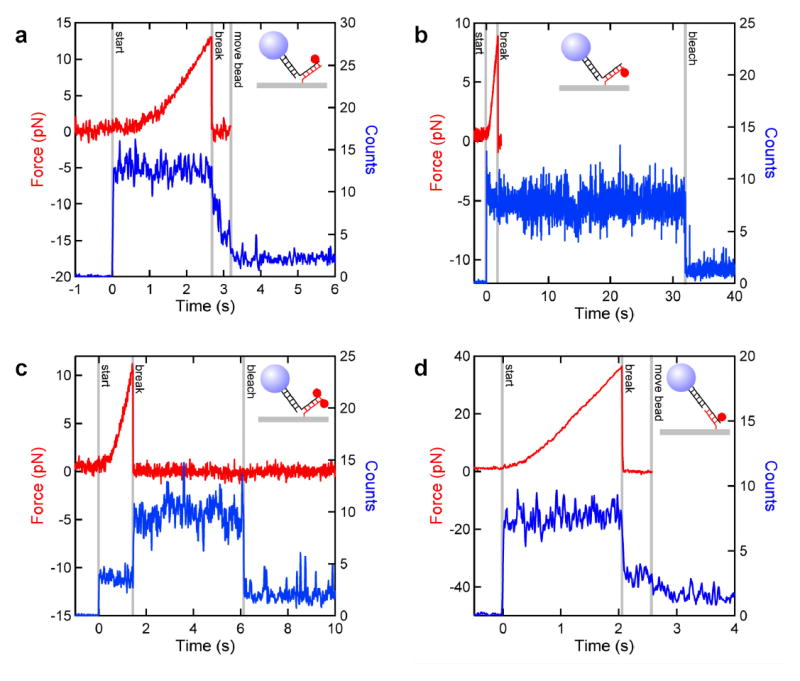
Simultaneous traces of the force (red) and photon counts (blue) recorded for four different experimental geometries shown (insets). Fluorescence traces were smoothed with a 3-pt boxcar filter. At the beginning of all four traces, the fluorescence excitation light was shuttered and the DNA tether was pretensioned by moving the stage and/or AODs. At “start” (vertical line, grey), the excitation light was unshuttered and the piezo stage began to move horizontally at 100 nm/sec. a, Unzipping force applied to a complex with the fluorophore attached to the long strand. Rupture occurred at t = 2.7 sec at a force of ~13 pN. Fluorescence levels decreased abruptly upon rupture, but remained slightly above background levels as the bead-tethered fluorophore diffused in and out of evanescent field. At “move bead”, the AODs moved the bead with its tethered fluorophore away, reducing the light to background levels. b, An unzipping force applied to a complex with the fluorophore attached to the 15-mer. Rupture occurred at t = 2 sec at a force of ~9 pN. The fluorophore photobleached in a single step at t = 32 sec. Fluorescence noise after the break and before bleaching reflects random motion of the unloaded DNA tether carrying the fluorophore. c, An unzipping force applied to a complex with fluorophores attached on complementary bases terminating the two strands. Rupture occurred at t = 1.5 sec at a force of ~11 pN. The dye bound to the surface unquenched at rupture, then bleached at t = 6 sec. d, A shearing force applied to a complex with the fluorophore attached to the DNA long strand. Rupture occurred at t = 2 sec at a force of ~35 pN. Noise in the force trace is lower, due to the increased tether stiffness associated of the application of higher forces.
Figure 2.
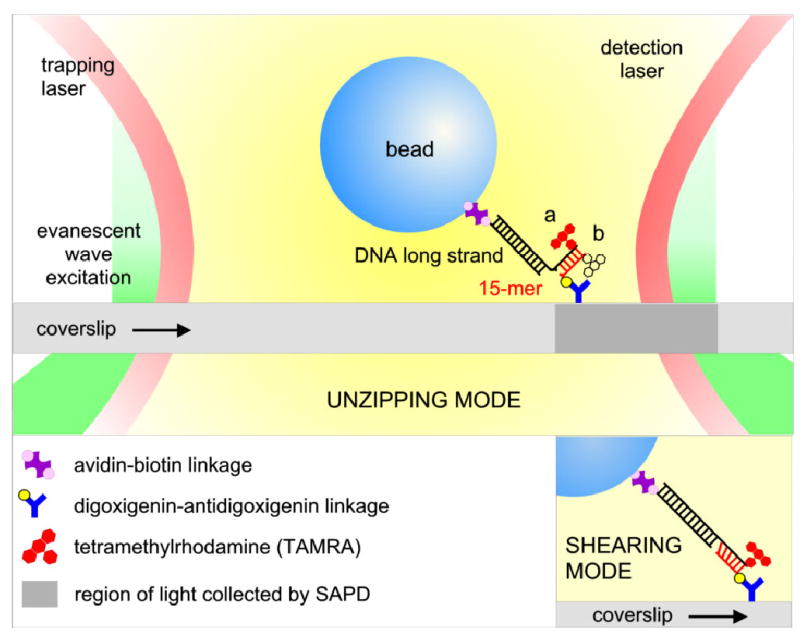
Cartoon of the experimental geometry for both pulling geometries. A 500-nm polystyrene bead is tethered to coverglass surface by a 1,010-bp–long DNA molecule, consisting of a long segment (black) joined to a shorter 15-bp duplex region (red). The optical trap captures the bead and applies force to unzip or shear the short duplex. The long segment is attached to bead via a biotin-streptavidin linkage, and the 15-mer is attached to coverglass surface via a digoxygenin-antibody linkage. a, Digoxygenin is attached to the 5′-end of the 15-mer for the unzipping mode. TAMRA dyes are attached to the end of DNA long strand (at position a) or to the 15-mer (at position b) for single fluorophore experiments, and attached at both positions for fluorescence unquenching experiments. b, Digoxygenin is attached to 3′-end of the 15-mer for the shearing mode.
To confirm that the drop in force corresponds to DNA strand dissociation and not, for example, to a breakage of the digoxygenin linkage holding the DNA:bead complex to the surface (or the like), we carried out parallel control experiments with the fluorophore incorporated into the short 15-mer instead of the long strand (Fig. 3b). Here, fluorescence levels do not decrease concomitant with rupture, but instead bleach to background levels in a single step at a variable time later (~10 s, on average). This demonstrates that a single dye molecule is involved and that its fluorescence lifetime is acceptably long despite irradiation by the trapping and detection beams.
To further substantiate that rupture corresponds to DNA strand dissociation, and to demonstrate the feasibility of using dye-pair quenching, we conducted unzipping experiments with TAMRA dyes conjugated to nucleotides on complementary bases, one located on the 3′-end of the 15-mer and the other on the 5′-end of the long strand (Fig. 3c). In these positions, the proximity of the dyes causes fluorescence quenching due to the formation of noncovalent dimers16. Prior to rupture, the low fluorescence level reflects the quenched emission. Upon rupture, the light level increases abruptly, corresponding to the mechanical separation of the two dyes, leaving an unquenched dye bound to the surface on the 15-mer. After several seconds, this dye photobleaches in a single step and the light drops to background levels. The fluorescence levels in both quenched and unquenched states are consistent with the absorption and emission spectra obtained in bulk fluorescence measurements17.
To test the dependence of rupture force on the direction of load application, we used the optical trap to apply a shearing force to the same DNA sequence, with the dye linked to the DNA long strand (Fig. 3d). Once again, the fluorescence levels dropped concomitant with the mechanical rupture, but a significantly higher force was required to separate the strands. In similar controls applying shearing forces to complexes with the dye on the 15-mer, the fluorescence level remained constant at rupture (data not shown).
To verify that TAMRA dyes fluoresced normally in the presence of all three laser beams, we performed additional control experiments where a DNA-tethered bead was moved back-and-forth in 20 nm increments by deflecting the trapping laser about a position directly above the bound fluorophore, under high trap power (Supplementary Materials). The fluorescence emission signal was uncorrelated with the movement of the trapping beam, and the dye photobleached in a single step.
Finally, to confirm that the rupture forces we obtain are not perturbed by the presence of conjugated TAMRA dyes, we compiled rupture force distributions for complexes carrying either one or two fluorophores (Supplementary Materials). For both shearing and unzipping modes, the rupture force distributions were statistically indistinguishable for complexes bearing one or two fluorophores, suggesting that dyes conjugated to terminal nucleotides contribute negligibly to the energetic stability of the helix.
Previous single-molecule studies have not determined unzipping and shearing forces for a given DNA sequence, but these have been estimated separately. Essevaz-Roulet et al. measured the force required to unzip 48,000 bp of λ-phage DNA using a microneedle arrangement18, and reported unzipping forces on the order of 10–15 pN, depending on the local G:C content. Rief et al.19 measured both shearing and unzipping forces using atomic force microscopy (AFM), first to shear apart a longer molecule of dsDNA and then to unzip the shorter hairpins that formed in the resulting ssDNA. They reported shearing forces of ~150 pN for λ DNA, and unzipping forces between 9 and 20 pN for the hairpins. These values are not readily interpreted, however, due to the unknown sequences and lengths of the hairpins formed. Moreover, the DNA was nonspecifically bound to the AFM probe20. In another recent study by Albrecht et al.21, DNA molecules carrying single fluorophores were bound at either end to each of two derivatized, apposing microchip surfaces. These surfaces were then mechanically separated, causing the DNA to rupture and leaving the fluorophore bound to one surface or the other. By determining the fluorescence signal recovered from each surface after strand separation, it is possible to compare the strengths of various DNA binding forces with respect to a reference signal from a control hybrid. This approach supplies rapid, qualitative information about the relative strengths of unzipping and shearing forces for ensembles of molecules, but does not lead to quantitative estimates.
Here, we present rupture-force distributions for both unzipping and shearing geometries for the same 15-bp sequence of DNA. As anticipated, we find that significantly greater forces are required to separate the strands in shearing mode than unzipping mode, and furthermore that the variance of the shearing force distribution is wider than that of the unzipping force distribution (Fig. 4). The most probable unzipping rupture force was 10.3 ± 0.3 pN (s.e.m., N = 100 events); the most probable shearing rupture force was 37.1 ± 1.1 pN (s.e.m., N = 83 events). A stiffer optical trap was required to shear DNA complexes, increasing the loading rate used for shearing measurements to ~24 pN/s from the value of ~11 pN/s used for unzipping. Because of the known dependence of apparent binding strength on the rate of application of force22, this increased loading rate would be expected to produce a 9% increase in the critical breaking force, insufficient to account for the observed 3.6-fold difference.
Figure 4.
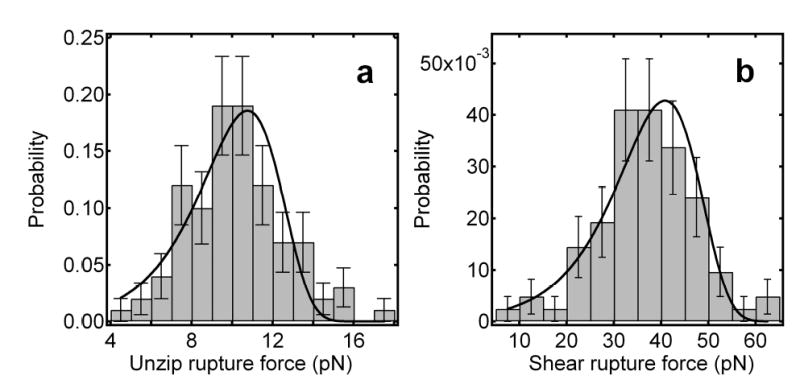
Histograms of unbinding and shearing forces with fits to the probability distribution function for breakage force developed by Evans and Ritchie28, as described in the text. a, Distribution of unzipping rupture forces; the most probable unzipping rupture force is 10.3 ± 0.5 pN (FWHM 5 pN, N = 100). b, Distribution of shearing rupture forces; the most probable shearing rupture force is 37.1 ± 1.1 pN (FWHM 15 pN, N = 83).
Directly fitting the rupture force distribution to the theoretical rupture probability density function supplies an accurate means of estimating of the distance to the transition state and the thermal off rate in the absence of load23. Here, we assume the single energy barrier formalism developed by Evans and Ritchie22 and fit the rupture distributions to the following probability density22,23:
where ν0 is the thermal off-rate in the absence of load, kBT is Boltzmann’s constant times the temperature, ∂F/∂t is the (constant) loading rate, x is the distance to the transition state, and F represents the x-component of the rupture force; ν0 and x were used as free parameters in the fit.
A fit to the unzipping force distribution gave x = 1.9 ± 0.2 nm: this distance can be interpreted physically as the difference in the distance measured between the 5′- and 3′-ends of the DNA duplex from the bound state to the transition state (Supplementary Materials)24. Assuming an interphosphate distance of 0.42 nm for adjacent nucleotides in ssDNA under 10 pN load25–27, we can relate x directly to the number of basepairs unzipped at transition: ~4.5 bp. Unzipping one base pair of dsDNA yields two base pairs of ssDNA, so this suggests that between 2 and 3 bp of the dsDNA duplex are unzipped at transition, in reasonable agreement with the unzipping transition “bubble” of ~4 bp predicted by nucleation theory24, as well as the 3 bp nucleation bubble found for a poly(A)poly(U) acid28. For comparison purposes, we also computed the predicted free energy for hairpin unzipping under an external load of 10.5 pN (Supplementary Materials).
A fit to the shearing force distribution gave x = 0.49 ± 0.05 nm. In this case, the distance to the transition state is interpreted physically as the difference in the distance between the two 5′-ends of the DNA duplex between the bound state and the transition state (Supplementary Materials). Modified wormlike chain (WLC) models of dsDNA elasticity predict that adjacent base pairs should remain separated by nearly their rest lengths (~0.34 nm) at the relatively low forces applied in these experiments29, so the difference in end-to-end separation provides a direct measure of the distance by which complementary strands are pulled out of register prior to rupture; the value for x suggests that an axial displacement of between 1 and 2 basepairs occurs at transition.
The two thermal off-rates estimated from the fits to shearing and unzipping distributions agree within error (ν0 = 0.03 ± 0.01 s−1 for unzipping vs. ν0 = 0.021 ± 0.009 s−1 for shearing). These values are ~3–5 fold lower than the off-rate reported in a temperature-jump kinetics study (0.1 s−1) for a 16-bp DNA duplex (19% G:C content; pH 7.0; 200 mM Na+)30. Thermal off-rates are known to be a strong function of the G:C content, however, particularly for GC pairs located at the opening of the helix31, and this may account for some of the difference. However, we note that prior reports of thermal off-rates estimated from mechanical data vary by over 5 orders of magnitude20,24,31.
In summary, we designed and built an apparatus for simultaneous optical trapping and single-molecule fluorescence, and demonstrated its practicality by measuring the forces required to unzip or shear a short DNA duplex. We were able to surmount technical difficulties by broadly separating the laser wavelengths devoted to trapping and position detection from those devoted to fluorescence; by judicious choices of dyes and filters; by minimizing stray light and collateral illumination; and by extensive computer automation of the instrument function to take full advantage of the limited dye fluorescence lifetime. With minor modifications, the instrument reported here may be readily adapted for a variety of SMF modalities, such as FRET (to monitor intramolecular distances), polarized fluorescence excitation/emission (to monitor angular orientation), and fluorescence lifetime measurements. The ability to carry out fluorescence measurements while optically trapping the same macromolecule should open up an entire range of biophysical experiments that were previously inaccessible.
Methods
Instrument Design
Our design aim was to combine OT and SMF without unduly compromising the capabilities of either technique. The instrument is based on a commercial inverted light microscope (Nikon TE200) equipped with four lasers: one for trapping (1064 nm Nd:YVO4 laser; Spectra Physics); one for position detection (827 nm diode laser; Point Source); and one for fluorescence excitation (either a 514 nm Argon-ion laser; Melles Griot Photonics, or a 532 nm diode-pumped frequency-doubled Nd:YAG laser; Coherent). The light from all three lasers overlaps at the specimen location. Several design considerations allow OT and SMF to co-exist. The laser wavelengths used for trapping and position detection were chosen to be well separated from those devoted to fluorescence excitation and emission, allowing the use of high-efficiency filters to reject the infrared trapping and detection light without compromising the fluorescence signal. High overall optical throughput in the infrared and careful control of beam diameter leads to improved trapping efficiency and detection sensitivity while minimizing the amount of laser power required, thereby reducing potentially damaging photon flux. Finally, computer automation of the instrument increases the useable lifetime of fluorophores by minimizing exposure to light during an experiment.
The optical layout is shown in Fig. 1. Details of the optical trapping and position detection subsystems are similar to those reported earlier32. Conventional methods of prism-based total internal reflection fluorescence (TIRF) were impractical in this system due to spatial conflicts with the condenser lens used for position detection. Instead, fluorescence excitation light was coupled as an evanescent wave into the specimen via the objective (100X/1.4NA oil immersion IR; Nikon)33. An additional benefit to objective-side TIRF is that the evanescent field is located immediately adjacent to the coverglass, where optical trap efficiency is also highest, minimizing the power required to trap (and also eliminating the need for specialized, thin flow cells).
Figure 1.
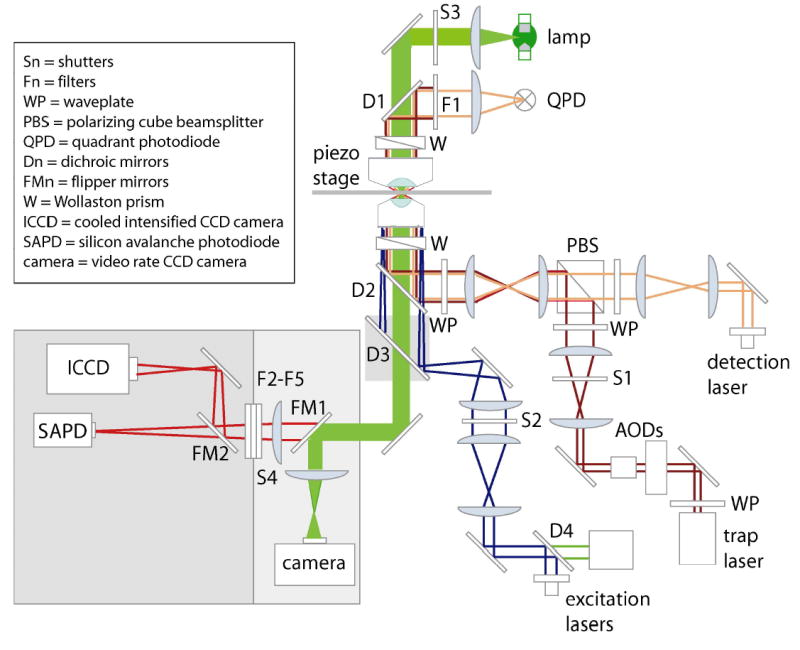
Schematic optical layout of the instrument (not all components displayed). Light pathways are indicated for the mercury-arc transillumination (light green), trapping laser (dark red), position detection laser (orange), fluorescence excitation lasers (dark blue, green) and fluorescence emission (red). Photodetectors include a QPD for position sensing, a video-rate analog camera for general imaging, a digital cooled intensified CCD camera for SMF imaging, and a SAPD for photon counting. Electronic shutters provide automatic control of the trapping beam (S1), fluorescence excitation beam (S2), bright-field illumination (S3), and light entering the ICCD/SAPD (S4). Multiple optical filters isolate the diode laser emission (F1) and block the trap, detection, and excitation laser wavelengths prior to fluorescence detection (F2–F5). Flipper mirrors alternate between the video-rate camera and SMF subsystem (FM1) and choose the desired SMF detector (ICCD camera or SAPD) (FM2).
Two types of fluorescence detection were used: a cooled, intensified CCD camera for visualization of fluorophores (Princeton Instruments) and a high quantum efficiency silicon avalanche photodiode (SAPD) for subsequent photon counting (EG&G Ortec). A motorized flipper mirror switches between the two detectors.
Efficient filters are necessary to allow the three laser beams to overlap in the specimen plane without drastically reducing fluorophore lifetimes or contributing excess noise from collateral illumination. To eliminate stray broadband diode emission from the detection laser, we isolated it with an ultranarrow bandpass filter positioned in the detection beam path before the specimen plane (Andover Corporation). Further filters were used to block collateral light downstream in the optical path: a glass filter for the trapping wavelength (KG5, Schott Glass Filters), and holographic notch filters (Kaiser Optical) for the detection and fluorescence excitation wavelengths. A beam block was used to extinguish the reflected TIRF light emerging from the objective.
DNA duplex design
We constructed dye-labeled DNA tethers using the following scheme, which allows for the efficient substitution of different fluorophores and for different surface-attachment chemistries. A 1,010-bp DNA duplex carrying a single-stranded 15-bp, 5′-overhang was attached to a 500-nm polystyrene bead at its blunt end (via a biotin-avidin linkage). The overhang was annealed to a complementary 15-bp synthetic oligonucleotide, anchored directly to the coverglass surface of a flow cell (via a digoxygenin-antibody linkage). The digoxygenin-linked base in the oligonucleotide can be placed at either end of the 15-mer, allowing force to be applied perpendicular or parallel to the axis of the short DNA hybrid for unzipping or shearing, respectively, as shown in Fig. 2. Tetramethylrhodamine (TAMRA) dyes were conjugated to terminal nucleotides of the long (1,010 bp) strand, the 15-mer, or to both strands. TAMRA dyes were used because we found that lifetimes of carbocyanine-based (Cy) dyes were dramatically reduced in the presence of the trapping light, whereas rhodamine or Alexa dye lifetimes remained comparatively unchanged. A similar finding has recently been reported34. We suspect that the use of Cy dyes in prior studies may have contributed to an inability to achieve simultaneous OT and SMF13,14.
Double-stranded DNA was amplified from a M13mp18 plasmid (Bayou Biolabs) by Autosticky PCR35, which in our hands gave higher yields than asymmetric PCR36. This approach generates the necessary 15-bp overhang (5′–TTGAAATACCGACCG) by using a primer with an internal abasic site that prevents readthrough by the polymerase. All linkages and fluorophores were incorporated via conjugation to the PCR primers (QIAGEN Operon).
The long dsDNA strands were annealed to short 15-bp oligomers with a digoxygenin label incorporated at the 5′-end for unzipping experiments or at the 3′-end for shearing experiments. The annealing process was incubated at 60°C for 5 min, followed by cooling at 1°C/min to 10°C. For experiments requiring dyes on the 15-mer, we used oligonucleotides with TAMRA conjugated to the 3′-end. To ensure that there were no free single-stranded ends remaining on the long strands after annealing, the initial concentration of short oligos was set to 5-fold that of the complexes. To confirm the specificity of the attachment of DNA to the glass surface, we prepared complexes lacking digoxygenin to verify that no bead tethers formed. Avidin-coated polystyrene beads (500 nm diameter) were prepared as described previously37. The molar concentration of beads used was 4-fold that of the dsDNA to ensure that most beads would be tethered to the cover-glass by a single DNA molecule.
Complexes were bound to the surface of a coverglass in a ~20 μL flowcell, constructed by using two strips of double-sticky tape to form a channel between the microscope slide and a #1½ thickness coverglass (Corning, Acton, MA). Slides and coverglasses were cleaned by sonication in 5M ethanolic KOH, rinsed in ethanol followed by water, then oven-dried. The cell was incubated for 40 min with 20 μg/ml anti-digoxygenin polyclonal antibody (Roche Molecular Biochemicals) dissolved in PBS, rinsed with 0.1 mg/ml BSA solution, incubated with 3.0 mg/ml BSA solution for 20 min, then incubated with bead:DNA complexes for 20 min. After incubation with the complexes, the flow cells were rinsed with 0.1 mg/ml BSA solution, then rinsed again with 3.0 mg/ml BSA solution containing 0.1% β-mercaptoethanol and de-gassed with a light vacuum. All BSA solutions were prepared in 100 mM Na-phosphate buffer pH 7.5 containing 0.1% Tween to prevent beads from clumping.
Data Collection and Analysis
The apparatus was used to apply force to a bead attached to a fluorescently-labeled DNA tether complex while concurrently recording the bead displacement and the fluorescent light emitted by the fluorophore(s). To do so, the bead was first optically trapped, then maintained in the trap as the stage carrying the flow cell was moved piezoelectrically at constant speed, pulling the bead from its equilibrium position at the trap center.
Measurement and calibration procedures were fully computer automated using custom software written in LabView (National Instruments). To begin each measurement, the detector beam was aligned with the center of the trap and the QPD as previously described32. Next, the tethered bead was centered in (x, y, z) based on measurements of the elastic extension of the DNA tether38. Rare tethers producing stretching curves with abnormal shapes or yielding incorrect contour lengths were discarded: this procedure eliminates beads with multiple tethers or nonspecific attachments. Beads were positioned close to the coverglass surface to minimize movement in the z-direction. Under computer-control, each bead is raster-scanned over the detection region to calibrate the QPD sensitivity32. During the centering and calibration procedures, the tether complex is exposed to light from the trapping and detection beams only, with the trap set to low power to minimize flux. After calibration, the stage moves the attachment point of the tether by 400 nm relative to the trap to remove slack from the tether before pulling begins.
At the start of data collection, the excitation shutter opens to allow fluorescence excitation light to reach the sample, and the stage pulls the bead out of the trap center, increasing the restoring force on the complex until rupture. During data collection, the sample is exposed to light from all three lasers while the SAPD counts photons and the QPD collects position information at 200 Hz (filtered at 100 Hz). After rupture is detected, the AODs are used to move the trapped bead beyond the fluorescence excitation region to reduce background light emitted by trapped, dye-labeled bead/tether complexes diffusing in and out of the evanescent wave. In cases where the fluorophore remains fixed to the coverglass surface, the APD continues to monitor the fluorescence signal until a photobleaching event occurs. Automated procedures reduce the time required to obtain a data record to about 3 minutes and limit the exposure of the dyes to unnecessary light.
Bead displacement from the center of the trap at the point of rupture is converted to a force in the x-direction based on the measured trap stiffness, determined separately. The true force component along the direction of the DNA tether is slightly greater than this force due to the changing angle between the stretching DNA and the plane of the coverglass. This angular correction is small, and contributes no more than a 10% increase from the values reported here.
Supplementary Material
Acknowledgments
This work was supported by grants to SMB from the NIH. PMF acknowledges support from an NSF pre-doctoral fellowship and a Lieberman Award Fellowship; AE was supported by the Stanford Biophysics Training Grant from the NIH; MJL was supported by a postdoctoral fellowship from the Jane Coffin Childs Foundation. The authors thank the entire Block Lab for helpful discussions, and Josh Shaevitz for assistance with energy landscape calculations.
Footnotes
Supplementary Information accompanies the paper on www.nature.com/naturemethods
Competing Interests Statement
The authors declare that they have no competing financial interests.
References
- 1.Merkel R, Nassoy P, Leung A, Ritchie K, Evans E. Energy landscapes of receptor-ligand bonds explored with dynamic force spectroscopy. Nature. 1999;397:50–3. doi: 10.1038/16219. [DOI] [PubMed] [Google Scholar]
- 2.Schnitzer MJ, Visscher K, Block SM. Force production by single kinesin motors. Nat Cell Biol. 2000;2:718–723. doi: 10.1038/35036345. [DOI] [PubMed] [Google Scholar]
- 3.Miyata H, Yasuda R, Kinosita K., Jr Strength and lifetime of the bond between actin and skeletal muscle alpha-actinin studied with an optical trapping technique. Biochim Biophys Acta. 1996;1290:83–88. doi: 10.1016/0304-4165(96)00003-7. [DOI] [PubMed] [Google Scholar]
- 4.Kawaguchi K, Ishiwata S. Nucleotide-dependent single- to double-headed binding of kinesin. Science. 2001;291:667–9. doi: 10.1126/science.291.5504.667. [DOI] [PubMed] [Google Scholar]
- 5.Nishizaka T, Miyata H, Yoshikawa H, Ishiwata S, Kinosita K., Jr Unbinding force of a single motor molecule of muscle measured using optical tweezers. Nature. 1995;377:251–4. doi: 10.1038/377251a0. [DOI] [PubMed] [Google Scholar]
- 6.Sun YL, Luo ZP, An KN. Stretching short biopolymers using optical tweezers. Biochem Biophys Res Commun. 2001;286:826–830. doi: 10.1006/bbrc.2001.5426. [DOI] [PubMed] [Google Scholar]
- 7.Wang MD, Yin H, Landick R, Gelles J, Block SM. Stretching DNA with optical tweezers. Biophys J. 1997;72:1335–46. doi: 10.1016/S0006-3495(97)78780-0. [DOI] [PMC free article] [PubMed] [Google Scholar]
- 8.Cui Y, Bustamante C. Pulling a single chromatin fiber reveals the forces that maintain its higher-order structure. Proc Natl Acad Sci U S A. 2000;97:127–132. doi: 10.1073/pnas.97.1.127. [DOI] [PMC free article] [PubMed] [Google Scholar]
- 9.Liphardt J, Onoa B, Smith SB, Tinoco I, Jr, Bustamante C. Reversible unfolding of single RNA molecules by mechanical force. Science. 2001;292:733–7. doi: 10.1126/science.1058498. [DOI] [PubMed] [Google Scholar]
- 10.Onoa B, Dumont S, Liphardt J, Smith SB, Tinoco I, Jr, Bustamante C. Identifying kinetic barriers to mechanical unfolding of the T. thermophila ribozyme. Science. 2003;299:1892–5. doi: 10.1126/science.1081338. [DOI] [PMC free article] [PubMed] [Google Scholar]
- 11.Peterman EJ, Sosa H, Goldstein LS, Moerner WE. Polarized fluorescence microscopy of individual and many kinesin motors bound to axonemal microtubules. Biophys J. 2001;81:2851–63. doi: 10.1016/S0006-3495(01)75926-7. [DOI] [PMC free article] [PubMed] [Google Scholar]
- 12.Forkey JN, Quinlan ME, Goldman YE. Protein structural dynamics by single-molecule fluorescence polarization. Prog Biophys Mol Bio. 2000;74:1–35. doi: 10.1016/s0079-6107(00)00015-8. [DOI] [PubMed] [Google Scholar]
- 13.Funatsu T, et al. Imaging and nano-manipulation of single biomolecules. Biophys Chem. 1997;68:63–72. doi: 10.1016/s0301-4622(97)00008-2. [DOI] [PubMed] [Google Scholar]
- 14.Ishijima A, et al. Simultaneous observation of individual ATPase and mechanical events by a single myosin molecule during interaction with actin. Cell. 1998;92:161–71. doi: 10.1016/s0092-8674(00)80911-3. [DOI] [PubMed] [Google Scholar]
- 15.Lang MJ, Fordyce PM, Block SM. Combined optical trapping and single-molecule fluorescence. J Biol. 2003;2:6. doi: 10.1186/1475-4924-2-6. [DOI] [PMC free article] [PubMed] [Google Scholar]
- 16.Blackman MJ, Corrie JET, Croney JC, Kelly G, Eccleston JF, Jameson DM. Structural and biochemical characterization of a fluorogenic rhodamine-labeled malarial protease substrate. Biochemistry. 2002;41:12244–12252. doi: 10.1021/bi0263661. [DOI] [PubMed] [Google Scholar]
- 17.Rosenfeld SS, Xing J, Jefferson GM, Cheung HC, King PH. Measuring kinesin’s first step. J Biol Chem. 2002;277:36731–36739. doi: 10.1074/jbc.M205261200. [DOI] [PubMed] [Google Scholar]
- 18.Essevaz-Roulet B, Bockelmann U, Heslot F. Mechanical separation of the complementary strands of DNA. Proc Natl Acad Sci U S A. 1997;94:11935–11940. doi: 10.1073/pnas.94.22.11935. [DOI] [PMC free article] [PubMed] [Google Scholar]
- 19.Rief M, Clausen-Schaumann H, Gaub HE. Sequence-dependent mechanics of single DNA molecules. Nat Struct Biol. 1999;6:346–349. doi: 10.1038/7582. [DOI] [PubMed] [Google Scholar]
- 20.Strunz T, Oroszlan K, Schafer R, Guntherodt HJ. Dynamic force spectroscopy of single DNA molecules. Proc Natl Acad Sci U S A. 1999;96:11277–11282. doi: 10.1073/pnas.96.20.11277. [DOI] [PMC free article] [PubMed] [Google Scholar]
- 21.Albrecht C, Blank K, Lalic-Multhaler M, Hirler S, Mai T, Gilbert I, Schiffmann S, Bayer T, Clausen-Schaumann H, Gaub HE. DNA: A programmable force sensor. Science. 2003;301:367–70. doi: 10.1126/science.1084713. [DOI] [PubMed] [Google Scholar]
- 22.Evans E, Ritchie K. Dynamic strength of molecular adhesion bonds. Biophys J. 1997;72:1541–1555. doi: 10.1016/S0006-3495(97)78802-7. [DOI] [PMC free article] [PubMed] [Google Scholar]
- 23.Friedsam C, Wehle AK, Kuhner F, Gaub HE. Dynamic single-molecule force spectroscopy: bond rupture analysis with variable spacer length. J Phys - Condens Mat. 2003;15:S1709–23. [Google Scholar]
- 24.Cocco S, Monasson R, Marko JF. Force and kinetic barriers to initiation of DNA unzipping. Phys Rev E. 2002;65:041907-1–041907-23. doi: 10.1103/PhysRevE.65.041907. [DOI] [PubMed] [Google Scholar]
- 25.Williams MC, Wenner JR, Rouzina I, Bloomfield VA. Effect of pH on the overstretching transition of double-stranded DNA: evidence of force-induced DNA melting. Biophys J. 2001;80:874–81. doi: 10.1016/S0006-3495(01)76066-3. [DOI] [PMC free article] [PubMed] [Google Scholar]
- 26.Bustamante C, Smith SB, Liphardt J, Smith D. Single-molecule studies of DNA mechanics. Curr Opin Struc Biol. 2000;10:279–85. doi: 10.1016/s0959-440x(00)00085-3. [DOI] [PubMed] [Google Scholar]
- 27.Cocco S, Marko JF, Monasson R, Sarkar A, Yan J. Force-extension behavior of folding polymers. Eur Phys J E. 2003;10:249–63. doi: 10.1140/epje/i2002-10113-2. [DOI] [PubMed] [Google Scholar]
- 28.Porschke D, Eigen M. Co-operative non-enzymic base recognition. J Mol Biol. 1971;62:361–81. doi: 10.1016/0022-2836(71)90433-5. [DOI] [PubMed] [Google Scholar]
- 29.Bouchiat C, Wang MD, Alleman J-F, Strick T, Block SM, Croquette V. Estimating the persistence length of a worm-like chain molecule from force-extension measurements. Biophys J. 1999;76:409–13. doi: 10.1016/s0006-3495(99)77207-3. [DOI] [PMC free article] [PubMed] [Google Scholar]
- 30.Turner DH, Sugimoto N, Frier SM. Thermodynamics and kinetics of base-pairing and of DNA and RNA self-assembly and helix coil transition. Landolt-Bornstein, New Series VII. 1990;1c:201–227. [Google Scholar]
- 31.Porschke D. Elementary steps of base recognition and helix-coil transitions in nucleic acids. J Biol Biochem Biophys. 1977;24:191–218. doi: 10.1007/978-3-642-81117-3_5. [DOI] [PubMed] [Google Scholar]
- 32.Lang MJ, Asbury CL, Shaevitz JW, Block SM. An automated two-dimensional optical force clamp for single molecule studies. Biophys J. 2002;83:491–501. doi: 10.1016/S0006-3495(02)75185-0. [DOI] [PMC free article] [PubMed] [Google Scholar]
- 33.Tokunaga M, Kitamura K, Saito K, Iwane AH, Yanagida T. Single molecule imaging of fluorophores and enzymatic reactions achieved by objective-type total internal reflection fluorescence microscopy. Biochem Biophys Res Commun. 1997;235:47–53. doi: 10.1006/bbrc.1997.6732. [DOI] [PubMed] [Google Scholar]
- 34.van Dijk MA, Kapitein LC, van Mameren J, Schmidt CF, Peterman EJG. Combining optical trapping and single-molecule fluorescence spectroscopy: enhanced photobleaching of fluorophores. J Phys Chem B. 2004;108:6479–6484. doi: 10.1021/jp049805+. [DOI] [PubMed] [Google Scholar]
- 35.Gal J, Schnell R, Szekers S, MKalman M. Directional cloning of native PCR products with preformed sticky ends (Autosticky PCR) Molecular Gen Genet. 1999;260:569–573. doi: 10.1007/s004380050930. [DOI] [PubMed] [Google Scholar]
- 36.Ausubel, F. M., Brent, R., Kingston, R.E., Moore, D.D., Seidman, J.G., Smith, J.A., and K. Struhl (ed.) Short protocols in molecular biology (John Wiley and Sons, Inc., 2002).
- 37.Neuman KC, Abbondanzieri EA, Landick R, Gelles J, Block SM. Ubiquitous transcriptional pausing is independent of RNA polymerase backtracking. Cell. 2003;115:437–47. doi: 10.1016/s0092-8674(03)00845-6. [DOI] [PubMed] [Google Scholar]
- 38.Perkins TT, Dalal RV, Mitsis PG, Block SM. Sequence-dependent pausing of single lambda exonuclease molecules. Science. 2003;301:1914–8. doi: 10.1126/science.1088047. [DOI] [PMC free article] [PubMed] [Google Scholar]
Associated Data
This section collects any data citations, data availability statements, or supplementary materials included in this article.