

Abstract
Purpose
Malignant pleural mesothelioma (MPM) is a highly lethal neoplasm with limited pretreatment prognostication strategies. In this report, we examine the accuracy of a previously proposed prognostic test in an independent cohort of MPM patients. This test uses simple ratios of gene expression levels to provide a novel prognostication scheme.
Experimental Design
Gene expression data using high-density oligonucleotide microarrays (∼22,000 genes) were obtained for a new cohort of human MPM tumors from patients undergoing similar treatments (n = 39). The relative expression levels for specific genes were also determined using real-time quantitative reverse transcription-PCR. We also used a subset of these tumors associated with widely divergent patient survival (n = 23) as a training set to identify new treatment-specific candidate prognostic molecular markers and gene ratio–based prognostic tests. The predictive nature of these newly discovered markers and gene ratio–based prognostic tests were then examined in an independent group of tumors (n = 52) using microarray data and quantitative reverse transcription-PCR.
Results
Previously described MPM prognostic genes and gene ratio–based prognostic tests predicted clinical outcome in 39 independent MPM tumor specimens in a statistically significant manner. Newly discovered treatment-specific prognostic genes and gene ratio–based prognostic tests were highly accurate and statistically significant when examined in an independent group of 52 tumors from patients undergoing similar treatment.
Conclusions
The data support the use of gene ratios in translating gene expression data into easily reproducible, statistically validated clinical tests for the prediction of outcome in MPM.
Keywords: expression profiling, prognosis, gene ratios
Malignant pleural mesothelioma (MPM) is a highly lethal malignancy affecting 3,000 patients in the United States annually for which current therapy is limited (1-6). There are three distinct histologic subtypes of MPM: epithelial, sarcomatoid, and mixed (7, 8). The expected median survival of patients presenting with MPM is between 4 and 12 months (1). The best chemotherapy regimen (Alimta, cisplatin combination) prolongs median survival only by a few months (e.g., from 9 to 12 months; ref. 9). Aggressive cytoreductive therapy, including surgery (i.e., extrapleural pneumonectomy) followed by combination chemotherapy and radiation therapy (trimodality therapy), has been shown to prolong survival in selected patients with early MPM (8). However, most patients do not undergo trimodality therapy due to insufficient cardiopulmonary reserve, advanced disease, or lack of access to specialized centers.
Whereas most MPM patients succumb within 1 or 2 years, some survive as long as 10 years. Certain features, such as epithelial histology, negative lymph nodes, and negative resection margins, have been proposed as markers for good prognosis. However, determination of nearly all of these requires major surgical exploration making accurate pretreatment staging or prognostication essentially impossible.
We have previously profiled using microarrays 31 MPM tissues (10) and designed gene expression ratio–based prognostic tests whose predictive value was statistically confirmed in an independent set of 29 patients (11). Pass et al. (12) also profiled 21 MPM patients and created a 27-gene neural network classifier to predict clinical outcome with near statistical significance in an independent smaller patient population. In the current study, we profiled using microarrays MPM tumors from 39 additional patients that received similar trimodality treatment to validate our proposed prognostic test (11). We also use these data to identify new treatment-specific candidate prognostic molecular markers and design new ratio-based prognostic tests.
Materials and Methods
Tissues profiled using microarrays
Microarray analysis was done on MPM surgical specimens (n = 39) freshly collected (and snap frozen) from patients undergoing surgery at Boston's Brigham and Women's Hospital between October 1998 and August 2000 (see Supplemental Table S1 for select clinical data). These patients were enrolled in a phase I dose-escalation trial of intraoperative, intracavitary hyperthermic cisplatin immediately following extrapleural pneumonectomy. Specimens were obtained before cisplatin exposure and before any therapy (other than surgery). The patients were subsequently administered low (50-150 mg/m2), intermediate (175-225 mg/m2), or high-dose (250-275 mg/m2) intracavitary cisplatin. Most patients received additional adjuvant systemic chemotherapy and/or radiation therapy off protocol. The histology of all MPM samples used were reviewed by one of us (J. Glickman) to confirm the diagnosis, histologic subclassification, and the number of tumor cells per high power field (>50% minimum) examined in a section adjacent to the tissue used for RNA extraction. Specimen identities were rendered anonymous and linked to clinical and pathologic data. Specimens used in additional data sets have been previously described (10, 11). Studies utilizing human tissues were approved by and conducted in accordance with the policies of the Institutional Review Board at Brigham and Women's Hospital.
Isolation of RNA and microarray experiments
Sample preparation and hybridization to microarrays was done as described in the Affymetrix Expression Analysis Technical Manual. Total RNA (7 μg) was prepared from whole tumor blocks using Trizol Reagent (Invitrogen Life Technologies, Carlsbad, CA). Hybridization experiments were scanned for artifacts and gene expression levels (i.e., Affymetrix “Signal”) were generated and scaled for each microarray to a “target intensity” of 100 using Affymetrix Microarray Suite v.5.0.
Real-time quantitative reverse transcription-PCR
Real-time quantitative reverse transcription-PCR (RT-PCR) was done using a SYBR-Green fluorometric-based detection system (Applied Biosystems, Foster City, CA, http://www.appliedbiosystems.com/, see technical bulletin no. 4310251). Total RNA (2 μg) was isolated and reverse-transcribed (11). All RT-PCR primers were used at a final concentration of 800 nmol/L in the reaction mixture. Primer sequences for L6, GDIA1, CTHBP, and KIAA0977 are published (11). Other primers synthesized (Invitrogen Life Technologies) were as follows (forward and reverse): CD9 (5′-CCACTATGCGTTGAACTGCT-3′ and 5′-CACGGTGAAGGTTTCGAGTA-3′), DLG5 (5′-ATCTGTCATCGACCCACTGA-3′ and 5′-GGGTCTTCTTGTTGGCATCT-3′), KIAA1199 (5′-TTAAGGCAGCACACTTGGAG-3′ and 5′-TCATAACCTCCCCTTTCGTC-3′), and THBD (5′-ATGTTTTGCAACCAGACTGC-3′ and 5′-GATGTCCGTGCAGATGAAAC-3′). PCR was done using a Stratagene MX 3000P device with appropriate controls and expression levels were obtained using the comparative CT equation (Applied Biosystems) with slight modifications (11).
Validation of prognostic genes in independent cohorts
The predictive nature of previously described prognostic genes (11) was examined in the 39 tumors profiled in the current study using the Partitioning Around Medoids (PAM) clustering algorithm (13). We also examined a previously described gene expression ratio–based prognostic test (11) in these 39 samples using quantitative RT-PCR. For gene expression level ratio–based prognosis, data from multiple gene expression ratios were combined by calculating the geometric mean as previously described (11).
Identification of new prognostic genes
We identified new treatment-specific candidate prognostic molecular markers and created an expression level ratio–based outcome predictor model similar to previous studies (11, 14, 15) using a subset of the 39 samples profiled in this study as training set. We searched the Affymetrix U133A microarray to identify all genes with expression levels that differed significantly (P ≤0.01) and by at least 2-fold between good-outcome (n = 13, survival >17 months) and poor-outcome (n = 10 survival <6 months) training set tumors to identify new treatment-specific prognostic markers. We further refined this gene list by requiring that their mean expression levels be >300 in at least one of the two sample sets, similar to previous studies (11, 14). Significance Analysis of Microarrays software (16) was used to estimate the false discovery rate.
New treatment-specific prognostic genes discovered were examined using PAM in additional independent MPM samples (n = 26) originating from patients with similar treatment (i.e., extrapleural pneumonectomy) for which previously published microarray and linked clinical data was available (10, 11). Gene expression ratio–based prognostic tests similarly discovered using these 39 samples were examined using quantitative RT-PCR in 23 of 26 samples previously used for microarrays (10) for which cDNA was still available, plus an additional 27 samples (11) and 2 samples never used previously that also originated from patients who underwent extrapleural pneumonectomy (i.e., the “test set,” n = 52 total).
The gene expression levels of 22 of 27 previously published MPM prognostic genes discovered by other investigators (12) were also analyzed in the 39 tumors profiled in the current study using hierarchical clustering, similar to the original study, and PAM (two genes were not represented on the Affymetrix U133A platform, and an additional three genes were removed from consideration because they were not called “Present” for a majority of samples): probe sets 35792_at, 34303_at, 38749_at, 39020_at, and 38650_at.
Survival studies and statistical analysis
Kaplan-Meier curves were used to estimate patient survival among groups of samples defined by predictions made using microarray data (using PAM and/or hierarchical clustering) and quantitative RT-PCR data (using optimal ratio-based prognostic tests). The log-rank test was used to statistically assess differences among multiple survival curves in univariate survival analysis. The statistical significance of survival differences observed using multiple candidate prognostic genes was evaluated by comparing to those obtained using a random selection of genes. Specifically, for each analysis, we constructed 10,000 data sets consisting of the expression levels of an equal number of randomly chosen genes in the same sample cohort. In each iteration, we did clustering with PAM and survival analysis to determine the likelihood of obtaining a P value (log-rank test) equal to or lower than the original P value observed.
A Cox proportional hazards regression model was used for multivariate analysis to identify coefficients that best described the effect of a given variable on censored survival data. Dichotomous variables included histologic subtype (epithelial or nonepithelial), lymph node status (positive or negative), surgical resection margins (positive or negative), and predictions made using ratio-based prognostic tests (good or poor outcome). (Coding for these analyses can be found in Supplemental Tables S2 and S3, as referenced in Results.) Individual P values reported for multivariate analysis were calculated by considering the Wald statistics of the individual parameters in the combined model. Individual hazard ratios (HR) and 95% confidence intervals are expressed as the exponentiated coefficient values and are interpretable as multiplicative effects on the hazard. The likelihood-ratio test was used to test the null hypothesis that all of the coefficients are zero. All calculations and statistical comparisons were generated using S-PLUS with a significance cutoff of P < 0.05 unless otherwise stated.
Results
Validation of a previously proposed prognostic test
We previously identified 46 candidate prognostic genes for MPM (11). We analyzed the predictive nature of the 20 most significantly differentially expressed genes from the original study (see Table 2 in ref. 11) in the 39 MPM samples profiled in the current study. Ten each of these genes were expressed at relatively higher levels in samples associated with good or poor outcome, respectively, with survival cutoffs defined using the same criteria as in the present study (11). The histologic distribution and the estimated median patient survival (14 months; Fig. 1A) of these 39 samples were representative of MPM patients in our practice (8). PAM clustering of the 39 MPM samples using these 20 predictive genes delineated two patient subsets with significantly different clinical outcome (P = 0.00102; Fig. 1B) by Kaplan-Meier survival analysis. A random selection of genes showed that there was a low likelihood of observing these results by chance alone (∼0.1%; i.e., 14 of 10,000 iterations; see Materials and Methods).
Table 2.
Clinical characteristics of MPM training set tumors
| Sample no. | Age | Histology | BWH stage | Survival | Status* |
|---|---|---|---|---|---|
| Good outcome | |||||
| 3 | 53 | Mixed | 3 | 17 | 2 |
| 23 | 51 | Mixed | 3 | 19 | 2 |
| 32 | 66 | Epithelial | 2 | 21 | 2 |
| 34 | 71 | Epithelial | 3 | 25 | 1 |
| 18 | 56 | Epithelial | 3 | 28 | 2 |
| 25 | 71 | Epithelial | 2 | 30 | 1 |
| 22 | 65 | Epithelial | 3 | 33 | 2 |
| 11 | 34 | Epithelial | 2 | 35 | 2 |
| 12 | 28 | Epithelial | 2 | 34 | 1 |
| 19 | 55 | Epithelial | 1 | 35 | 1 |
| 10 | 60 | Epithelial | 3 | 36 | 1 |
| 14 | 43 | Epithelial | 3 | 37 | 1 |
| 9 | 55 | Epithelial | 3 | 39 | 1 |
| Poor outcome | |||||
| 36 | 76 | Mixed | 3 | 0.8 | 2 |
| 27 | 62 | Mixed | 3 | 2 | 2 |
| 7 | 47 | Epithelial | 2 | 3 | 2 |
| 6 | 58 | Epithelial | 2 | 4 | 2 |
| 29 | 53 | Epithelial | 3 | 5 | 2 |
| 37 | 71 | Mixed | 3 | 5 | 2 |
| 30 | 55 | Epithelial | 3 | 6 | 2 |
| 1 | 59 | Epithelial | 2 | 6 | 2 |
| 16 | 61 | Mixed | 3 | 6 | 2 |
| 20 | 59 | Mixed | 3 | 6 | 2 |
Abbreviation: BWH, Brigham and Women's Hospital.
1, Alive; 2, deceased.
Fig. 1.
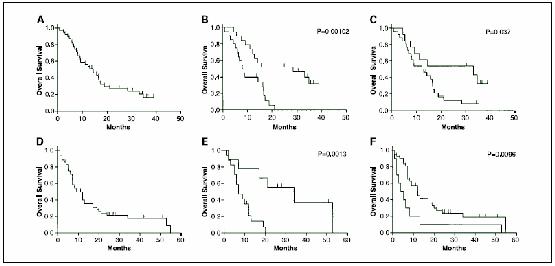
Kaplan-Meier survival predictions for MPM patients. Genes associated with favorable prognosis in MPM were examined in multiple contexts. In one experiment (A-C), previously described MPM prognostic genes and ratio-based tests (12) were examined in the 39 samples of the current study with linked clinical data using microarray data and quantitative RT-PCR. In a separate analysis (D-F), prognostic genes were identified in a training set of samples (Table 2) using current microarray data and examined in additional 26 independent samples with previously published microarray data and linked clinical data. Select ratio-based prognostic tests developed using these genes were subsequently validated in 23 of these 26 samples plus an additional 29 independent samples (i.e., the test set; see Materials and Methods) using quantitative RT-PCR only. A, overall survival for the 39 samples of the current study that were profiled using microarrays. The estimated median survival for this cohort (14 months) is consistent with that expected for MPM patients in general. B, overall survival of patient subsets defined based on the results of supervised clustering using 20 previously described MPM prognostic genes and the 39 samples of the current study. The overall survival of both subsets were found to differ significantly (P = 0.00102). C, overall survival in the 39 current samples for good-outcome (top line, median survival = 33 months) and poor-outcome (bottom line, median survival = 12 months) sample subsets as defined by a previously described four gene expression ratio model were found to differ significantly (P = 0.037). D, overall survival for the test set of 52 samples. The estimated median survival for this cohort (9 months) is consistent with that expected for MPM patients in general though moderately lower than in (A). E, overall survival in patient subsets defined based on the results of supervised clustering using microarray data for 26 independent samples and the prognostic genes from Table 3. The overall survival of both subsets differed significantly (P = 0.0013) and the estimated median survivals differed by nearly 5-fold. F, overall survival in the entire test set of 52 samples for good-outcome (top line, median survival = 12 months) and poor-outcome (bottom line, median survival = 5 months) sample subsets as defined by the same four-ratio model were found to differ significantly (P = 0.0096). Hash marks, censored data.
We also analyzed these 39 samples using our previously proposed ratio-based prognostic test for MPM (11). This test uses four genes in three gene pair ratios: KIAA0977/GDIA1, L6/CTHBP, and L6/GDIA1. Using quantitative RT-PCR, we first calculated the combined score for these three ratios in 20 of the 39 samples associated with widely divergent patient survival using cutoff criteria similar to that of the training set of tumors (11) originally used to discover these prognostic genes (i.e., survival greater than and less than the 75th and 25th percentiles, respectively). Each sample was assigned to an outcome group as previously (i.e., combined scores >1 and <1 were predicted to be associated with good and poor outcome, respectively). In these 20 samples, the three-ratio test was 75% (15 of 20) accurate and assigned 70% (7 of 10) of the long-term survivors (i.e., ≥24.8 months) to “good outcome” and 80% (8 of 10) of the short-term survivors (i.e., ≤6.8 months) to “poor outcome.” Finally, we added the remaining 19 samples to the analysis to comprehensively examine predictions made by the three-ratio test in all 39 samples. We found that this test significantly (P = 0.037) predicted patient outcome associated with these 39 samples (Fig. 1C). The estimated median survival (33 months) of the good-outcome subset was over 2.5-fold higher than the estimated median survival of the poor-outcome subset (12 months).
We have previously shown that positive resection margins, mixed histology, and positive lymph nodes are statistically significant negative prognostic markers in a large (n = 183) cohort of similarly treated MPM patients (17). Therefore, we used multivariate survival analysis to examine whether our results using expression ratios were independent of the above prognostic variables. The results of fitting a Cox proportional hazards regression model to these survival data are shown in Table 1 (see Supplemental Table S2 for codes). None of the clinical variables achieves individual statistical significance likely due to a lack of statistical power resulting from a small sample size, unbalanced patient distribution pertaining to stage, and the fact that this cohort was not optimized to detect these differences (i.e., neither histologic subtype nor lymph node status were statistically significant prognostic variables in univariate survival analysis). However, the result of a likelihood-ratio test (P = 0.036) suggests that at least one of the regression coefficients is not zero. Examination of the point estimate HRs revealed that the combined score of the expression ratio test (HR, 2.00) was higher than that for both histologic subtype (HR, 1.49) and positive resection margins (HR, 1.23) and was similar to that for lymph node status (HR, 2.34).
Table 1.
Multivariate survival analysis of MPM tumors using a previously validated ratio-based prognostic test
| Variable | Hazard ratio (95% CI) | P |
|---|---|---|
| Mixed (nonepithelial) cell type | 1.49 (0.62-3.60) | 0.37 |
| Extrapleural lymph node metastasis | 2.34 (0.77-7.16) | 0.14 |
| Positive resection margins | 1.23 (0.33-4.65) | 0.76 |
| Prognostic test | 2.00 (0.79-5.09) | 0.14 |
NOTE: Hazard ratios and P values were generated by fitting a Cox proportional hazards regression model to censored survival data linked to specimens profiled in the current study (n = 39) as detailed in Materials and Methods. Clinical variables were converted to binary format and column codings used in multivariate analysis can be found in Supplemental Table S2. The “Prognostic test” variable refers to predictions made using a previously described (ref. 12) combination of three prognostic expression ratios according to criteria outlined in Results.
Abbreviation: 95% CI, 95% confidence interval.
Identification of new treatment-specific prognostic markers
Next, we identified new treatment-specific prognostic genes and gene ratio–based tests using the expression profiling data of the 39 MPM specimens of the current study. These tissues originated from patients who received slightly different therapy from the first cohort (i.e., heated intrapleural chemotherapy; refs. 11) with surgical cytoreduction in common. Also, the new microarray platform included additional genes compared with that used in our original work (11). We identified candidate prognostic molecular markers and created an expression ratio–based outcome predictor model in a training set of samples associated with widely divergent survivals (n = 23; Table 2). We found a total of eight candidate prognostic genes that fit the filtering criteria (Table 3). Four of these were expressed at relatively higher levels in good-outcome samples and four were expressed at relatively higher levels in poor-outcome samples. Using Significance Analysis of Microarrays, we found that the smallest list of significant genes that contained the prognostic genes discovered using our filtering criteria consisted of 477 genes with an estimated false-discovery rate of 68%. The unusually high false-discovery rate reflects the fact that the overwhelming majority of these 477 genes were expressed at relatively low levels (mean < 100) in both good and poor-outcome samples. Although some of these genes may be statistically significant, we have generally found, during gene discovery using microarrays for the purpose of designing accurate and reproducible ratio-based prognostic tests, that it is desirable for genes to be sufficiently highly expressed in either good- or poor-outcome samples even if P values increase modestly as a result (11, 14).
Table 3.
Mesothelioma prognostic genes
| Accession no. | P | Ratio* | Locus Link ID; Unigene title |
|---|---|---|---|
| Expressed at relatively higher levels in good-outcome tumors | |||
| AL049381 | 0.0015 | 2.8 | EST; Homo sapiens mRNA; cDNA DKFZp586J2118 (from clone DKFZp586J2118) |
| NM.001769 | 0.0057 | 2.2 | CD9; CD9 antigen (p24) |
| AB011155 | 0.0073 | 2.0 | DLG5; discs, large (Drosophila) homologue 5 |
| NM.000064 | 0.0116 | 2.1 | C3; complement component 3 |
| Expressed at relatively higher levels in poor-outcome tumors | |||
| AK000168† | 0.0064 | 0.30 | CD24; CD24 antigen (small cell lung carcinoma cluster 4 antigen) |
| AB033025 | 0.0101 | 0.35 | KIAA1199; KIAA1199 protein |
| AA761181† | 0.0110 | 0.24 | CD24; CD24 antigen (small cell lung carcinoma cluster 4 antigen) |
| NM.000361 | 0.0144 | 0.35 | THBD; thrombomodulin |
NOTE: P values were obtained using a two-tailed Student's t test to identify genes whose average expression levels were statistically significantly different between groups of tumor samples from patients with good and poor outcome, respectively, as detailed in Materials and Methods.
Average expression level in good outcome samples/average expression level in poor-outcome samples.
CD24 is listed twice in the lower portion of the table because this gene is represented by multiple Affymetrix probe sets, serving as an internal hybridization control.
Using the eight prognostic genes, we determined whether expression ratios could accurately classify the 23 samples used to train the model. We calculated a total of 16 possible expression ratios per sample by dividing the expression value of each of the four genes expressed at relatively higher levels in good-outcome samples (i.e., EST, CD9, DLG5, and C3) by the expression value of each of the four genes expressed at relatively higher levels in poor-outcome samples (i.e., CD24, KIAA1199, CD24, and THBD). (Note that CD24 is listed twice because this gene is represented by multiple Affymetrix probe sets and as such serves as an internal control.) Samples with ratio values >1 were predicted to be “good outcome” and those with ratio values <1 were predicted to be “poor outcome.” The overall accuracy of each of the 16 expression ratios varied widely (average = 71%, range 57-83%). To incorporate the predictive power of multiple prognostic genes (i.e., ratios), we calculated the combined score (i.e., geometric mean; see Materials and Methods) for all 560 possible three-ratio combinations and similar to previous studies (11, 14). We found that we could easily identify training samples with accuracy that met or exceeded that of any of the gene pair ratios when used alone. The three most accurate three-ratio combinations were all similarly accurate (87%) in identifying training set samples. These three tests used a total of four gene pair ratios in multiple combinations: CD9/KIAA1199, CD9/THBD, DLG5/KIAA1199, and DLG5/THBD. The combined score of this four-ratio test resulted in the same classification accuracy as any of the three-ratio tests, so we decided to additionally examine this four-ratio test going forward.
Validation of prognostic genes
To eliminate the need for internal cross-validation, we examined using multiple techniques the predictive nature of candidate prognostic markers from above in a separate cohort (n = 52; i.e., the test set; Table 4). (Microarray data was available for 26 of these samples; see Materials and Methods). The histologic distribution and the estimated median patient survival (9 months; Fig. 1D) of the test set of samples was representative of those expected for MPM patients. The median survival of this cohort (9 months; Fig. 1D) is moderately shorter (but not statistically significantly) than that for the more current cohort (14 months; Fig. 1A) likely due to slightly different treatments and/or effects-of-time trends. None of the genes from Table 3 were identified in our initial discovery of optimal candidate MPM prognostic genes (11), likely due to excessive variability and/or the slightly different treatments between cohorts, although only CD9 was not represented on the previous expression profiling platform. However, the average expression levels for all remaining genes in previous samples were substantially higher in the predicted group with the exception of DLG5 and the EST, for which average expression levels in both good and poor-outcome groups were nearly identical. Although fold change differences in the average expression levels for these genes were relatively high between good and poor-outcome samples (11), there was substantial variability among individual samples as reflected in the originally calculated P value (gene, average fold-change difference, P value): C3, 13-fold higher in good-outcome samples, P = 0.079; CD24, 24-fold higher in poor-outcome samples, P = 0.030; KIAA1199, 2-fold higher in poor-outcome samples, P = 0.32; THBD, 2-fold higher in poor-outcome samples, P = 0.25.
Table 4.
Clinical characteristics of the test set of MPM tumors
| Sample* | Source† | Age | Survival | Status‡ | Histology | Node | Margins§ |
|---|---|---|---|---|---|---|---|
| 2∥ | 1 | 44 | 26 | 1 | Epithelial | Positive | Positive |
| 5 | 2 | 51 | 8 | 2 | Epithelial | Positive | Positive |
| 6 | 1 | 39 | 5 | 2 | Epithelial | Positive | Positive |
| 33 | 1 | 60 | 20 | 2 | Epithelial | Negative | Positive |
| 34 | 1 | 52 | 34 | 2 | Mixed | Positive | Positive |
| 42∥ | 1 | 64 | 10 | 2 | Mixed | Negative | Negative |
| 44 | 2 | 57 | 2 | 2 | Mixed | Positive | Positive |
| 51 | 1 | 49 | 13 | 2 | Mixed | Negative | Positive |
| 53 | 0 | 67 | 2 | 2 | Mixed | Positive | Positive |
| 57 | 1 | 61 | 7 | 2 | Epithelial | Negative | Positive |
| 68 | 1 | 61 | 21 | 2 | Epithelial | Positive | Positive |
| 70 | 2 | 57 | 8 | 2 | Sarcomatoid | Negative | Positive |
| 72 | 1 | 46 | 53 | 2 | Mixed | Negative | Positive |
| 74 | 1 | 40 | 51 | 1 | Epithelial | Negative | Negative |
| 76 | 1 | 67 | 17 | 2 | Epithelial | Negative | Negative |
| 82 | 1 | 68 | 1 | 2 | Mixed | Positive | Positive |
| 86 | 1 | 42 | 9 | 2 | Epithelial | Negative | Positive |
| 89 | 1 | 55 | 3 | 2 | Mixed | Positive | Positive |
| 90 | 1 | 48 | 28 | 1 | Epithelial | Positive | Positive |
| 96 | 2 | 40 | 1 | 2 | Epithelial | Positive | Positive |
| 104 | 2 | 40 | 5 | 2 | Epithelial | Positive | Positive |
| 105 | 1 | 66 | 12 | 2 | Mixed | Positive | Positive |
| 109 | 1 | 62 | 19 | 2 | Epithelial | Positive | Positive |
| 110 | 2 | 64 | 5 | 2 | Epithelial | Negative | Positive |
| 111 | 0 | 56 | 7 | 2 | Mixed | Positive | Positive |
| 112 | 2 | 31 | 55 | 2 | Epithelial | Positive | Positive |
| 114∥ | 1 | 51 | 2 | 2 | Mixed | Positive | Positive |
| 118 | 1 | 74 | 7 | 2 | Mixed | Negative | Positive |
| 130 | 1 | 55 | 6 | 2 | Mixed | Positive | Positive |
| 133 | 1 | 69 | 2 | 2 | Mixed | Positive | Positive |
| 134 | 2 | 56 | 1 | 2 | Epithelial | Negative | Positive |
| 146 | 2 | 67 | 7 | 2 | Epithelial | Positive | Positive |
| 148 | 2 | 59 | 17 | 2 | Epithelial | Negative | Positive |
| 150 | 2 | 58 | 3.6 | 2 | Mixed | Negative | Positive |
| 154 | 2 | 56 | 9 | 2 | Mixed | Positive | Positive |
| 161 | 2 | 59 | 12 | 2 | Mixed | Positive | Positive |
| 163 | 2 | 68 | 25 | 1 | Epithelial | Positive | Positive |
| 165 | 2 | 51 | 27 | 1 | Epithelial | Positive | Positive |
| 166 | 1 | 66 | 6 | 2 | Sarcomatoid | Negative | Positive |
| 167 | 1 | 53 | 7 | 2 | Epithelial | Positive | Positive |
| 169 | 2 | 46 | 7 | 2 | Epithelial | Positive | Positive |
| 206 | 2 | 45 | 45 | 1 | Mixed | Positive | Negative |
| 208 | 2 | 63 | 7 | 1 | Epithelial | Positive | Negative |
| 212 | 1 | 62 | 12 | 2 | Mixed | Positive | Negative |
| 213 | 1 | 55 | 11 | 1 | Mixed | Negative | Positive |
| 216 | 2 | 43 | 8 | 1 | Epithelial | Positive | Negative |
| 217 | 2 | 57 | 5 | 1 | Mixed | Negative | Negative |
| 219 | 2 | 39 | 6 | 1 | Epithelial | Negative | Positive |
| 220 | 2 | 72 | 12 | 2 | Mixed | Negative | Positive |
| 224 | 2 | 68 | 6 | 1 | Epithelial | Negative | Positive |
| 225 | 2 | 35 | 42 | 1 | Epithelial | Positive | Positive |
| 228 | 2 | 73 | 4 | 2 | Sarcomatoid | Negative | Positive |
| 229 | 1 | 33 | 5 | 2 | Epithelial | Positive | Positive |
| 235 | 2 | 46 | 24 | 2 | Mixed | Positive | Positive |
| 302 | 2 | 54 | 13 | 2 | Mixed | Positive | Positive |
All samples originated from consented stage I or II patients who underwent surgery (extrapleural pneumenectomy). See Materials and Methods.
0, never used previously; 1, microarray data previously published (see reference); 2, used for quantitative RT-PCR analysis only (see reference).
1, Alive; 2, deceased.
For details, see reference.
Only microarray data (and not RT-PCR data) were used in the current study for these samples because of a lack of sufficient quantities of cDNA leaving 52 samples in the “comprehensive test set” (see text for details).
We did supervised clustering and Kaplan-Meier survival analysis using the 26 samples for which microarray data was previously available (10) to validate the general predictive nature of the eight new candidate prognostic genes from Table 3. We found that these prognostic genes were capable of defining two subsets of MPM patients with significantly different clinical outcome (P = 0.0013) and estimated median survivals that differed by nearly 5-fold (Fig. 1E). Then, using random selection of genes, we estimated the likelihood of obtaining the observed survival difference by chance alone at ∼0.2% (i.e., 17 of 10,000 iterations; see Materials and Methods).
Next, we examined the prognostic call of the four-ratio test in 26 of the 52 samples associated with widely divergent patient survival as above (i.e., survival greater than and less than the 75th and 25th percentiles, respectively). We used quantitative RT-PCR to obtain the relative gene expression levels of the genes comprising the four most accurate gene pair ratios from above (CD9/KIAA1199, CD9/THBD, DLG5/KIAA1199, and DLG5/THBD) then calculated a combined score of the four-ratio combination. Samples with combined scores >1 and <1 were predicted to be associated with good and poor outcome, respectively. In these 26 samples, the four-ratio test was 69% (18 of 26) accurate and called 92% (12 of 13) of the long-term survivors (≥18 months) “good outcome” and 46% (6 of 13) of the short-term survivors (≤5 months) “poor outcome.” Finally, we analyzed all 52 samples of the test set using quantitative RT-PCR and found that the estimated survival associated with “good” and “poor” prognosis subjects identified using expression ratios were significantly different (P = 0.0096; Fig. 1F). The estimated median survival (12 months) of the good-outcome subset was over 2-fold higher than the estimated median survival of the poor-outcome subset (5 months).
As before, we did multivariate survival analysis to examine ratio-based predictions in the context of previously described prognostic variables (17). The results of fitting a Cox proportional hazards regression model to censored survival data are shown in Table 5 (see Supplemental Table S3 for codes). No individual prognostic variable was found to be statistically significant in the combined model likely for reasons similar to those stated previously. Nevertheless, the result of a likelihood-ratio test (P = 0.041) suggests that at least one of the regression coefficients is not zero. Importantly, the HR point estimate for the combined score of the expression ratio test (HR, 2.06) was higher than that for both histologic subtype (HR, 1.38) and lymph node status (HR, 1.21) and was moderately lower than that for positive resection margins (HR, 3.29).
Table 5.
Multivariate survival analysis of the comprehensive test set of MPM tumors
| Variable | Hazard ratio (95% CI) | P |
|---|---|---|
| Mixed (nonepithelial) cell type | 1.38 (0.67-2.84) | 0.38 |
| Extrapleural lymph node metastasis | 1.21 (0.54-2.73) | 0.64 |
| Positive resection margins | 3.29 (0.78-13.98) | 0.11 |
| Prognostic test | 2.06 (0.75-5.62) | 0.16 |
NOTE: Hazard ratios and P values were generated by fitting a Cox proportional hazards regression model to censored survival data (n = 52) as described in Materials and Methods. Clinical variables were converted to binary format and column codings used in multivariate analysis can be found in Supplemental Table S3. The “Prognostic test” variable refers to predictions made using the combination of four optimal expression ratios according to criteria outlined in Materials and Methods and Results.
Examination of prognostic genes proposed by others
We examined the expression levels of 22 of the 27 genes identified by Pass et al. (12) from an independent cohort of 21 MPM patients using microarray data from this study given that patient demographics, treatment, and Kaplan-Meier median survival (10 versus 14 months) were similar. Hierarchical clustering (dendrogram not shown) revealed two major subclasses consisting of 16 and 23 tumors with nearly identical patient median survivals (13 and 14 months, P = 0.194). When only the 20 patients with widely divergent survival were considered, the median survival of both subsets (5 and 31 months) was similar to the original cutoff points corresponding to the 25th survival percentile (6.8 months) and 75th survival percentile (24.8 months), respectively, of the cohort of 39 samples (P = 0.174). Using PAM to cluster the samples achieved similar results. In fact, the majority of samples (34 of 39, 87%) remained in the same subclass, suggesting that the original classification using hierarchical clustering was relatively robust. Although the median survivals associated with each group were separated nearly 2-fold (17 and 9 months), the difference was not statistically significant (P = 0.118). The median survival of each subset (6 and 33 months) was essentially the same as previously when only the 20 samples with widely divergent survival were considered and once again did not achieve statistical significance (P = 0.478).
Discussion
In this report, we have first validated previously proposed prognostic genes and a specific prognostic gene ratio–based test in a new cohort of MPM patients. In addition, we identified additional treatment-specific prognostic genes and designed a new ratio-based prognostic test in MPM by performing gene expression profiling of tumors obtained from patients undergoing definitive surgery for MPM at our institution. All but one of these patients were either at stage II or III and all received intraoperative, intracavitary hyperthermic cisplatin immediately following extrapleural pneumonectomy as part of a phase I dose escalation clinical trial. Therefore, it is significant (a) that prognostic genes discovered in an earlier study (11) were also similarly predictive when examined in the current patient cohort and (b) that the general expression patterns of the new prognostic genes were similarly predictive in an independent patient cohort that also received cytoreductive therapy (but not intraoperative, intracavitary hyperthermic cisplatin) and were all either stage I or II. In both cases, we used prognostic genes discovered in each cohort to design a ratio-based test for the prediction of outcome in MPM that was tested in the other cohort. We found in univariate survival analysis that ratio-based tests were able to identify two groups of patients with statistically significantly survival differences in each case.
There was no overlap in previously discovered MPM prognostic genes (11) and those discovered in the current study despite the fact that both sets of genes were discovered in surgical patients undergoing similar therapies at the same institution and that each set was statistically predictive of survival when examined in the other cohort. There are at least two likely explanations for this apparent discrepancy: (a) experimental and biological variability and (b) inherent differences in patient treatment between both cohorts. Sources of variability include general reproducibility issues pertaining to all microarray studies (18), different profiling platforms used to analyze each patient cohort, different numbers of samples used in the discovery of each set of prognostic genes, and inherent genetic differences likely present in tumors from patients with different stage disease. Nevertheless, it was encouraging that prognostic genes discovered in the current study had predicted expression patterns in the other cohort and average expression levels in tumors from patients associated with extreme survival differences that differed with near-statistical significance.
The median survival of the good-outcome subset from the new test (CD9/KIAA1199, CD9/THBD, DLG5/KIAA1199, and DLG5/THBD) was identical (12 months) to that for the poor-outcome subset of the initial test (KIAA0977/GDIA1, L6/CTHBP, and L6/GDIA1). The cause of this observation likely relates to the fact that the overall median survival increased by ∼50% in the second cohort (e.g., compare Fig. 1A and D). Other explanations may relate to the relatively small sample size of each group and/or the fact that treatments were slightly different for each set of patients. Nevertheless, the fact that previously described prognostic genes remain valid in the current MPM patients supports the predictive nature of the selected genes and the gene ratio method in general. Furthermore, the HR point estimates for both ratio-based predictions are very similar in multivariate survival analysis (Tables 1 and 5). This would suggest that the gene-ratio approach is able to distinguish between patient prognoses with approximately the same relative risk, although the actual survival within each prognostic group may vary.
Our first test (11) identified 75% (15 of 20) of the patients with extreme survival differences. It is desirable to identify a higher percentage of poor prognosis patients because these patients are unlikely to benefit from upfront surgery. Our new test identified a similar number of patients with extreme survival differences (18 of 26, 69%), but interestingly identified a greater number (12 of 13, 92%) of long-term survivors (≥18 months) but fewer (6 of 13, 46%) of the short-term survivors (≤5 months) compared with the first test. The cause of this observation was not immediately clear, but also likely reflects the fact that both patient cohorts were of different stage and received slightly different treatments. The fact that both tests worked suggests that they are more in tune either with the degree of tumor aggressiveness or with the cytoreductive nature of the treatment than with the specific chemotherapy given at surgery. Importantly, when examined in an independent set of patients with similar stage who received identical therapy, the accuracy (88%) of the original prognostic test (KIAA0977/GDIA1, L6/CTHBP, and L6/GDIA1) was much higher (11).
A more complex 27-gene neural network classifier proposed by Pass et al. (12) was 76% accurate when validated using hierarchical clustering in an independent data set, including patients with widely divergent survival. Our analyses using either our previous (11) or newly developed ratio-based tests attained a similar accuracy (69% and 75%) despite the utilization of fewer genes and a simpler approach. It is also noteworthy that both of our ratio-based tests from the current and original studies resulted in statistically significant differences in survival when samples that originated from tumors associated with a range of patient survival were analyzed (Fig. 1D and H). It is unknown whether the 27-gene classifier of Pass et al. (12) would have significantly predicted survival under these circumstances in the original analysis.
An important result of these studies is the identification of mechanisms potentially involved in malignant transformation in MPM. Several of the prognostic genes discovered in the current study have previously documented roles in cancer. The CD9 gene codes for a member of the transmembrane-4 superfamily (also known as the tetraspanin family) whose proteins mediate signal transduction events regulating cell development, activation, growth, and motility. Two other members of this gene family have also been shown to be associated with good prognosis in MPM: the gene encoding the L6 tumor antigen (a.k.a. TM4SF1) previously reported by our laboratory (11) and the plasmolipin gene previously reported by Pass et al. (12). In other studies, low expression of CD9 is thought to contribute to a more aggressive (metastatic) phenotype in small cell lung cancer (19), gastric cancer (20), and breast cancer (21). These observations are generally consistent with our finding of CD9 expressed at significantly higher levels in tumors from patients with relatively good prognosis. Thrombomodulin (THBD) is a type I membrane receptor that has been suggested as a potential tumor diagnostic marker because it is expressed by up to 75% of MPMs (22, 23) and 83% of cardiac myxomas (24). Expression of the CD24 cell surface antigen has been observed in multiple malignancies and seems to function as a ligand for the adhesion molecule P-selectin. Recently, CD24 has been shown to be an independent and statistically significantly predictive indicator in multivariate survival analysis in non–small cell lung cancer (25) and ovarian cancer (26). In these studies, high levels of CD24 were associated with shorter survival times, consistent with our results in MPM.
In this study, we identify and validate MPM prognostic genes both in a general context and as part of a predictive test. We again show the utility of the gene ratio technique (10, 11, 14, 15) in MPM by designing and testing multiple clinically relevant prognostic tests. Prognostication using typical bioinformatics tools (e.g., hierarchical clustering) is not easily amenable to the analysis of a single patient at a time and without reference to an additional group of patients whose gene expression data was similarly acquired. Furthermore, many of these bioinformatics techniques are inherently sensitive to sources of variability, such as the number of genes used in the model, the data acquisition platform, and inherent biological variability. Consequently, these classification techniques are not likely to quickly impact patient clinical management. Because ratio-based tests offer several advantages over traditional bioinformatics tools (10), it is likely that they will prove useful in future clinical scenarios as an adjunct to traditional staging techniques.
Footnotes
Grant support: Brigham Surgical Group Foundation, Cancer Research and Prevention Foundation, National Cancer Institute grant CA-105249-02, and Mesothelioma Applied Research Foundation (G.J. Gordon); National Cancer Institute grants CA-102591-01 and CA-100315-01, Mesothelioma Applied Research Foundation, and Vancouver Foundation (R. Bueno).
The costs of publication of this article were defrayed in part by the payment of page charges. This article must therefore be hereby marked advertisement in accordance with 18 U.S.C. Section 1734 solely to indicate this fact.
Note: Expression profiling raw data and supplemental information are available at http://www.generatios.com/, under “Publications”.
References
- 1.Pass H. Malignant pleural mesothelioma: surgical roles and novel therapies. Clin Lung Cancer. 2001;3:102–17. doi: 10.3816/clc.2001.n.021. Medline. [DOI] [PubMed] [Google Scholar]
- 2.Peto J, Decarli A, La Vecchia C, Levi F, Negri E. The European mesothelioma epidemic. Br J Cancer. 1999;79:666–72. doi: 10.1038/sj.bjc.6690105. Medline. [DOI] [PMC free article] [PubMed] [Google Scholar]
- 3.Peto J, Hodgson JT, Matthews FE, Jones JR. Continuing increase in mesothelioma mortality in Britain. Lancet. 1995;345:535–9. doi: 10.1016/s0140-6736(95)90462-x. Medline. [DOI] [PubMed] [Google Scholar]
- 4.Sugarbaker DJ, Liptay MJ. Therapeutic approaches in malignant mesothelioma. In: Aisner J, Arriagada R, Green MR, Martini N, Perry MC, editors. Comprehensive textbook of thoracic oncology. Williams and Wilkins; Baltimore (MD): 1996. pp. 786–98. [Google Scholar]
- 5.Aisner J. Diagnosis, staging, and natural history of pleural mesothelioma. In: Aisner J, Arriagada R, Green MR, Martini N, Perry MC, editors. Comprehensive textbook of thoracic oncology. Williams and Wilkins; Baltimore (MD): 1996. pp. 799–85. [Google Scholar]
- 6.Britton M. The Epidemiology of Mesothelioma. Semin Surg Oncol. 2002;29:18–25. doi: 10.1053/sonc.2002.30237. [DOI] [PubMed] [Google Scholar]
- 7.Corson JM, Renshaw AA. Pathology of mesothelioma. In: Aisner J, Arriagada R, Green MR, Martini N, Perry MC, editors. Comprehensive textbook of thoracic oncology. Williams and Wilkins; Baltimore (MD): 1996. pp. 757–8. [Google Scholar]
- 8.Sugarbaker DJ, Garcia JP, Richards WG, et al. Extrapleural pneumonectomy in the multimodality therapy of malignant pleural mesothelioma. Results in 120 consecutive patients. Ann Surg. 1996;224:288–94. doi: 10.1097/00000658-199609000-00005. Medline. [DOI] [PMC free article] [PubMed] [Google Scholar]
- 9.Vogelzang NJ, Rusthoven JJ, Symanowski J, et al. Phase III study of pemetrexed in combination with cisplatin versus cisplatin alone in patients with malignant pleural mesothelioma. J Clin Oncol. 2003;21:2636–44. doi: 10.1200/JCO.2003.11.136. Abstract/Free Full Text. [DOI] [PubMed] [Google Scholar]
- 10.Gordon GJ, Jensen RV, Hsiao L-L, et al. Translation of microarray data into clinically relevant cancer diagnostic tests using gene expression ratios in lung cancer and mesothelioma. Cancer Res. 2002;62:4963–7. Abstract/Free Full Text. [PubMed] [Google Scholar]
- 11.Gordon GJ, Hsiao L-L, Jensen RV, et al. Using gene expression ratios to predict outcome among patients with mesothelioma. J Natl Cancer Inst. 2003;95:598–6058. doi: 10.1093/jnci/95.8.598. Abstract/Free Full Text. [DOI] [PubMed] [Google Scholar]
- 12.Pass HI, Liu Z, Wali A, et al. Gene expression profiles predict survival and progression of pleural mesothelioma. Clin Cancer Res. 2004;10:849–59. doi: 10.1158/1078-0432.ccr-0607-3. Abstract/Free Full Text. [DOI] [PubMed] [Google Scholar]
- 13.Venables WN, Riley BD. Modern applied statistics with S-Plus. Springer; New York: 1997. [Google Scholar]
- 14.Gordon GJ, Richards WG, Sugarbaker DJ, Jaklitsch MT, Bueno R. A prognostic test for adenocarcinoma of the lung from gene expression profiling data. Cancer Epidemiol Biomarkers Prev. 2003;12:905–10. Abstract/Free Full Text. [PubMed] [Google Scholar]
- 15.Bueno R, Loughlin KR, Powell MH, Gordon GJ. A diagnostic test for prostate cancer from gene expression profiling data. J Urol. 2004;171:903–6. doi: 10.1097/01.ju.0000095446.10443.52. Medline. [DOI] [PubMed] [Google Scholar]
- 16.Tusher VG, Tibshirani R, Chu G. Significance analysis of microarrays applied to the ionizing radiation response. Proc Natl Acad Sci U S A. 2001;98:5116–21. doi: 10.1073/pnas.091062498. Abstract/Free Full Text. [DOI] [PMC free article] [PubMed] [Google Scholar]
- 17.Sugarbaker DJ, Flores RM, Jaklitsch MT, et al. Resection margins, extrapleural nodal status, and cell type determine postoperative long-term survival in trimodality therapy of malignant pleural mesothelioma: results in 183 patients. J Thorac Cardiovasc Surg. 1999;117:54–65. doi: 10.1016/s0022-5223(99)70469-1. Abstract/Free Full Text. [DOI] [PubMed] [Google Scholar]
- 18.Gullans SR. Of microarrays and meandering data points. Nat Genet. 2000;26:4–5. doi: 10.1038/79159. Medline. [DOI] [PubMed] [Google Scholar]
- 19.Funakoshi T, Tachibana I, Hoshida Y, et al. Expression of tetraspanins in human lung cancer cells: frequent downregulation of CD9 and its contribution to cell motility in small cell lung cancer. Oncogene. 2003;22:674–87. doi: 10.1038/sj.onc.1206106. Medline. [DOI] [PubMed] [Google Scholar]
- 20.Murayama Y, Miyagawa J, Shinomura Y, et al. Significance of the association between heparin-binding epidermal growth factor-like growth factor and CD9 in human gastric cancer. Int J Cancer. 2002;98:505–13. doi: 10.1002/ijc.10198. Medline. [DOI] [PubMed] [Google Scholar]
- 21.Sauer G, Kurzeder C, Grundmann R, et al. Expression of tetraspanin adaptor proteins below defined threshold values is associated with in vitro invasiveness of mammary carcinoma cells. Oncol Rep. 2003;10:405–10. Medline. [PubMed] [Google Scholar]
- 22.Ordonez NG. The value of antibodies 44-36A, SM3, HBME-1, and thrombomodulin in differentiating epithelial pleural mesothelioma from lung adenocarcinoma. Am J Surg Pathol. 1997;21:1399–408. doi: 10.1097/00000478-199712000-00002. Medline. [DOI] [PubMed] [Google Scholar]
- 23.Ordonez NG. The immunohistochemical diagnosis of mesothelioma: a comparative study of epithelioid mesothelioma and lung adenocarcinoma. Am J Surg Pathol. 2003;27:1031–51. doi: 10.1097/00000478-200308000-00001. Medline. [DOI] [PubMed] [Google Scholar]
- 24.Acebo E, Val-Bernal JF, Gomez-Roman JJ. Thrombomodulin, calretinin and c-kit (CD117) expression in cardiac myxoma. Histol Histopathol. 2001;16:1031–6. doi: 10.14670/HH-16.1031. Medline. [DOI] [PubMed] [Google Scholar]
- 25.Kristiansen G, Schluns K, Yongwei Y, et al. CD24 is an independent prognostic marker of survival in nonsmall cell lung cancer patients. Br J Cancer. 2003;88:231–6. doi: 10.1038/sj.bjc.6600702. Medline. [DOI] [PMC free article] [PubMed] [Google Scholar]
- 26.Kristiansen G, Denkert C, Schluns K, et al. CD24 is expressed in ovarian cancer and is a new independent prognostic marker of patient survival. Am J Pathol. 2002;161:1215–21. doi: 10.1016/S0002-9440(10)64398-2. Abstract/Free Full Text. [DOI] [PMC free article] [PubMed] [Google Scholar]