Abstract
I consider conformational spaces of tRNAphe defined by sets of suboptimal structures from the perspective of small-world networks. Herein, the influence of modifications on typical small-world network properties and the shape of energy landscapes is discussed. Results indicate that natural modifications influence the degree of local clustering and mean path lengths far more than random or no modifications. High frequencies in the thermodynamic ensemble coincide with high numbers of neighboring structures that one conformation can adopt by one elementary move. Conformation spaces indicate the existence of modular substructures. It can be shown that modifications leave the nature of small-world topology untouched albeit natural modifications have a reasonable enhancing and streamlining effect on the degree of clustering and therefore on the substructures of the conformational space.
INTRODUCTION
Structures of RNA molecules can be discussed at an empirically well established level of resolution known as secondary structure, which addresses the topology of binary contacts that arise from specific base pairings [Watson–Crick pairs (AU, UA, GC, CG) and GU] instead of the geometry cast in terms of coordinates and distances. While the driving force behind secondary structure formation is the stacking of contiguous base pairs, the formation of an energetically favorable double-stranded region implies the simultaneous formation of energetically unfavorable loops as well. These ‘frustrated’ energetics lead to vast combinatorics of helix and loop arrangements, which span the structural repertoire of an individual RNA sequence.
A secondary structure can be conveniently discretized as a graph that represents a pattern of base pair contacts. Of particular interest are secondary structures having minimal free energy, which can be computed by dynamic programming (1–4) as well as kinetically probable structures (5–7). Folding paths of RNA structures are subject to the shape of the underlying free-energy landscape. Theoretical calculations of such landscapes predict cases that indicate low barrier heights between local energy minima (8).
Algorithms capable of calculating suboptimal RNA (9,10) were introduced in order to investigate statistical properties of tRNA structures. As a result, base modifications considerably sharpen the definition of the ground-state structure by constraining energetically adjacent structures near to the ground state (10).
Most recently, the conformational space of a simple lattice polymer chain was mapped onto a network (11). In this representation, conformations are connected if they are compatible by a step out of a predefined elementary move set of conformational changes. The geometric properties of the network were found to be similar to those of small-world networks. Networks that adopt this particular topology proved to appear in a variety of real systems (12–17).
An initial regular graph can be manipulated by cutting edges with a probability p, which are subsequently rewired randomly (12). Thus, this regime interpolates between two limiting cases of a regular graph (p = 0) and a random one (p = 1). Formally defined, small-world networks are sparse graphs that are much more highly clustered than equally sparse random graphs (18). Furthermore, they provide average shortest distances that increase logarithmically with the size of the network as for random graphs (12). It was already found that the appearance of small-world behavior is not a phase transition but a crossover phenomenon that depends both on the network size and the degree of disorder (19).
Since it was found that tRNA sequences and related sets of suboptimal structures have uniform properties, I consider the conformational spaces of a typical tRNA sequence, Escherichia coli tRNAphe. In order to study the properties of tRNAphe, the conformational spaces of the naturally modified and unmodified sequences will be mapped onto networks. Subsequently, the topology of these networks will be investigated and results discussed.
MATERIALS AND METHODS
Secondary structures
A RNA sequence is denoted by a string | = (x1, x2, …, xn) of n positions over the familiar nucleotide alphabet, xI ∈ A = {A, U, G, C}. The bases x1 and xn are the nucleotides at the 5′ and 3′ ends, respectively. The usual representation (2,20) treats a secondary structure S as a graph whose nodes represent nucleotides at positions i = 1, …, n of a RNA sequence of length n. The set of edges connecting the nodes consists of two disjointed subsets. One is common to all secondary structure graphs, while the other is specific to each sequence. The common set represents the covalent backbone connecting node i with node i + 1, ∀i = 1, …,n – 1. The sequence-specific part consists of a set Π of edges i · j, Π = {i · j | i ≠ j and j ≠ i + 1}, representing admissible hydrogen bonds between the bases at positions i and j, such that (i) every edge in Π connects a node to, at most, one other node and (ii) the pseudoknot constraint is met. The latter states that, if both i · j and k · l are in Π then i < k < j implies that i < l < j. Failure to meet this constraint results in interactions that are considered to be tertiary contacts (pseudoknots). A sequence s is called compatible with a secondary structure S, whenever positions that pair in the specification of S [i · j ∈ Π (s)] are occupied by nucleotides that can actually pair with each other: i · j → [xi, xj] ∈ B = {AU, UA, GC, CG, GU, UG},∀i · j ∈ Π(s). In other words, the set of admissible base pairs that we shall consider consists of the Watson–Crick pairs {AU, UA, GC, CG} and {GU, UG}. A sequence | specifies a set of structures S with which it is compatible, S(|) = {S0, S1, …, Sm} ∪ {O}, where S0 is the minimum free energy (mfe) structure and S1, …, Sm are suboptimal conformations ordered with respect to their energy. O denotes the open chain conformation.
RNA folding algorithms
A single RNA sequence can adopt roughly Sn ≈ n –3/2 × 1.85n (21), if n is the length of the RNA sequence. Thus, it is computationally expensive to calculate all secondary structures and henceforth to set up the respective conformational space. So, the set of conformations was restricted to suboptimal structures within a certain energy range above the mfe structure. These structures were computed with the program RNAsubopt (10), which is part of the Vienna RNA package (http://www.tbi.univie.ac.at/∼ivo/RNA/) (3). Essentially, RNAsubopt extends the standard RNA folding algorithm, which emphasizes dynamic programming by an extended backtracking procedure. This admits the alternative arrangement of secondary structure elements in conformations that are within a certain energy range above the energy of the energetically most stable structure.
In order to obtain and investigate structures that prove to be local energy minima and saddle points, which connect minima by a downhill walk starting from them, the program Barriers was used (http://www.tbi.univie.ac.at/∼ivo/RNA/Barriers/) (8). Taking the output of RNAsubopt, Barriers starts to scan the vicinity of the mfe structure in order to detect adjacent structures that might either be transient structures on the way to other optima, local minima or saddle points connecting them. This procedure is repeated for the whole set of suboptimal structures. Energy barriers are the energy difference between a local minima and its saddle points.
Conformational space
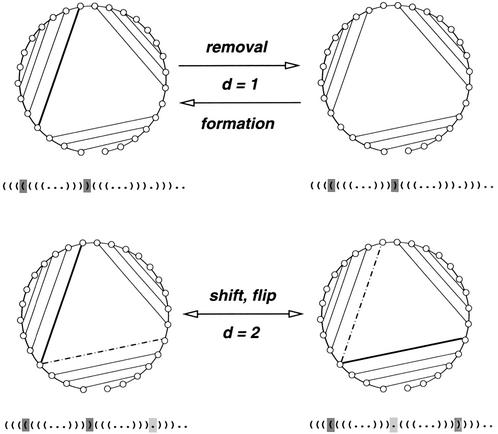
The set S forms the conformational space GC (VC, EC), which considers its structures as the set of vertices VC. The set of undirected edges EC represents elementary moves between conformations that are restricted to the formation, removal and shift or flip move of base pairs. Figure 1 gives a schematic overview of these conformational changes. These can be considered from the perspective of a base pair based metric. Removal and formation of a base pair would cause a base pair distance dbp = 1 since one base pair is immediately affected. A shift or flip move of base pairs would result in base pair distance dbp = 2, since two base pairs have been changed in the underlying conformation.
Figure 1.
Elementary moves in the conformational space of RNA. Secondary structures are shown in circle and corresponding bracket representation. Base pairs that are going to change are indicated as bold in the circular and shaded in the bracket representation. Base pairs after a move are shown dot-dashed and light shaded. Removal and formation of a base pair causes dbp = 1 as the base pair distance between the conformations, since one base pair is immediately affected. A shift or flip move of base pairs results in base pair distance dbp = 2, since two base pairs have changed the underlying conformations.
In this graph, the degree k of a vertex is the number of other vertices to which it is linked. In other words, k represents the number of adjacent structures that are reachable with one elementary move from the given one.
The mean path length L from a vertex to any other vertex of the graph is defined as the average of the path lengths to all other vertices.
Another important quantity is the clustering coefficient C(v) of a vertex v. It measures the fraction of vertices connected to v, which are also connected to each other. Thus, it is defined as C(v) = 2n / kv (kv + 1), where n denotes the number of links connecting the kv nearest neighbors of node v. In extension, the mean clustering coefficient C of the graph is defined as the average of C(v) over all v.
Small-world networks
Growing amounts of empirical and theoretical data about the topologies of large complex networks indicate the emergence of several network types. Basically, these types are classified by the connectivity distribution P(k) of nodes. Exponential networks are characterized by P(k), which peaks at an average 〈k〉 and decays exponentially. Prominent protagonists of this type are the random graph model (22) and the small-world model (12). Both lead to fairly homogeneous networks with nodes comprising approximately the same number of links k ∼ 〈k〉 (23), which is in clear contrast to currently highly emphasized scale-free networks (23,24). A small-world graph adopts a sparse topology emphasizing mean path lengths L, which prove to be at least equal to or greater than the respective number of a random graph of equal length, i.e. L ≥ Lrandom. Moreover, small-world networks remain more clustered than their random counterparts of equal size, i.e. C ≫ Crandom (12). Demonstratively, small-world networks provide relatively short mean path lengths by a logarithmic dependency from the underlying network size (12).
Ravasz et al. considered the hierarchical architecture of metabolic networks. In their investigation, they showed the independence of the mean clustering coefficient C from the number of nodes. Furthermore, a considerable correlation with the degree of nodes, was observed in metabolic networks of 43 organisms (25). These observations found their explanation by considering small, highly integrated subnetworks that were repeatedly assembled in higher order modules resembling a kind of iterative and hierarchical structure. This intrinsic organization of a hierarchy is characterized by a correlation of the mean clustering coefficient C and the corresponding degree of a node, v, yielding C(v) ∼ kv–1 if kv is the degree of node v (26).
Graph tools
Graph analysis tools were written in C++ using the LEDA library of data types (27). PAJEK (the Slovene word for spider), a program for large network analysis and visualization, was used for the illustrations of graphs (28) (available at http://vlado.fmf.uni-lj.si/pub/networks/pajek/).
tRNA sequences
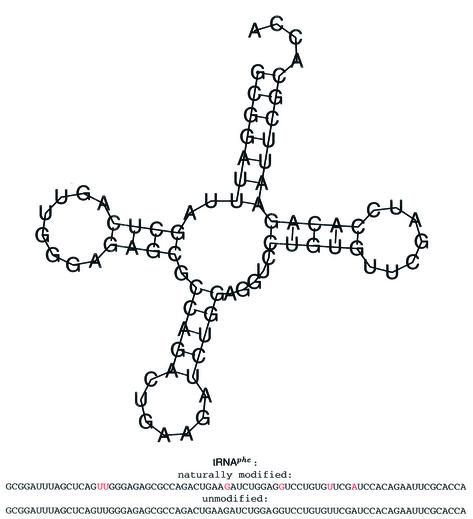
It had already been found that tRNA sequences constitute similar statistical properties (10). Hence, the E.coli tRNAphe sequence (EMBL accession no. RF6280) was exemplarily chosen as a typical protagonist of tRNAs from the compilation of Sprinzl et al. (available at http://www.uni-bayreuth.de/departments/biochemie/sprinzl/trna/) (29). Modifications of bases are translated as suggested by Higgs (30). Some of these still prevent the affected bases from pairing. Figure 2 gives a schematic impression.
Figure 2.
Secondary structure of tRNAphe (RF6280) and its sequences used throughout the analysis. The structure was obtained with the RNA fold algorithm. Modified bases are indicated in red.
Sets of suboptimal structures within different energy ranges above the respective minimum free energies at 37°C were computed and conformational spaces thus obtained.
RESULTS
Small-world behavior strongly emphasizes the existence of considerably short mean path lengths through the network and predominantly a high local clustering of nodes.
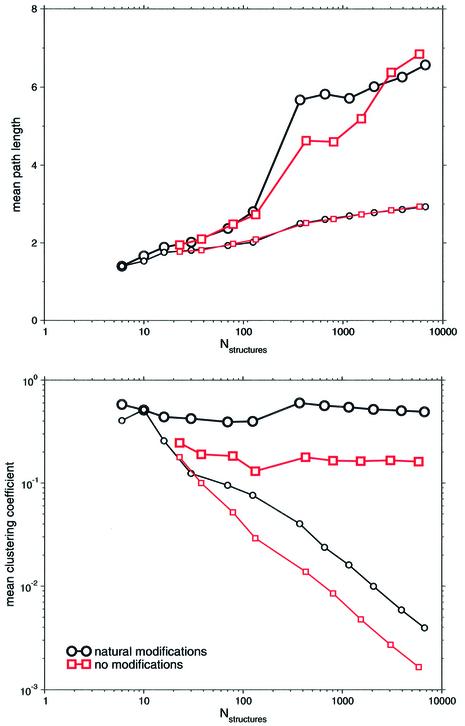
Figure 3 considers these parameters of conformation spaces set up with suboptimal structures within different energy ranges above the respective minimum free energies. Significantly, mean path lengths, L, always significantly exceed the respective numbers of equal sized random networks with growing size of the conformation space. Furthermore, L correlates well with the logarithm of the number of nodes, L ∼ log N, of the underlying network which is typical for random graphs (31) as well as for small-world networks (23). Obviously, these correlations only hold for a sufficiently large number of nodes in order to be statistically significant.
Figure 3.
Total number of structures versus mean path length and mean clustering coefficient of the underlying conformational space. Modified and unmodified sequences of E.coli tRNAphe were considered. Large symbols refer to these data points. Each data point refers to a conformation space set up with suboptimal structures within 3–14 kT (modified sequence) and 3–11 kT (unmodified sequence). Analogously, the respective numbers of random graphs of equal size were plotted, to which the small symbols refer.
Regarding modifications, the correlation is qualitatively, and roughly quantitatively, independent of the modifications superimposed onto the tRNA sequence.
Considering mean clustering coefficient, C, as the other intrinsic parameter of small-world behavior, Figure 3 reveals significantly, that growing network sizes increase the differences of C between conformation spaces and random networks of equal size. Thus, another criterion of small-worldedness is met by the conformation spaces of tRNA. This observation is qualitatively independent of the modification of the tRNA. As an additional commonness, degrees of local clustering feature independence of the intrinsic network sizes. However, the conformational space of the modified tRNA tends to be significantly more clustered than the respective space of the unmodified tRNA. Obviously, this is in clear contrast to the distribution of the mean path length, L.
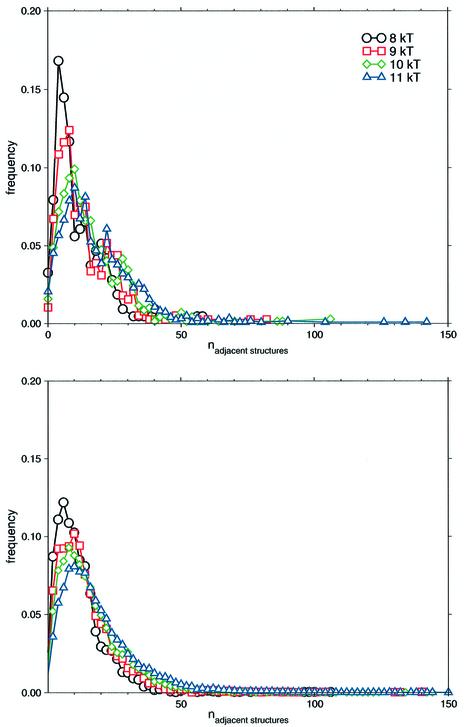
Figure 4 shows connectivity distributions of the conformational spaces under consideration. Regardless of the tRNA modifications, the decaying connectivities remind to exponential distributions, which are typical for random graph topology as well as for small-world networks. Obviously, the shape of the curves depends on the number of nodes the respective networks have. However, the different numbers of nodes do not affect the exponential nature of the connectivity distributions. Thus, the topology of networks is not subject to the actual size of the network.
Figure 4.
Connectivity distribution of the conformational spaces. Modified and unmodified sequences of E.coli tRNAphe were considered. Suboptimal structures lie within 8–11 kT above the respective mfe. Connectivity numbers were binned and frequencies thus obtained.
In a Boltzmann-weighted ensemble, the probability of the ith suboptimal structure to occur is defined as
where the sum over all suboptimal structures defines the partition function.
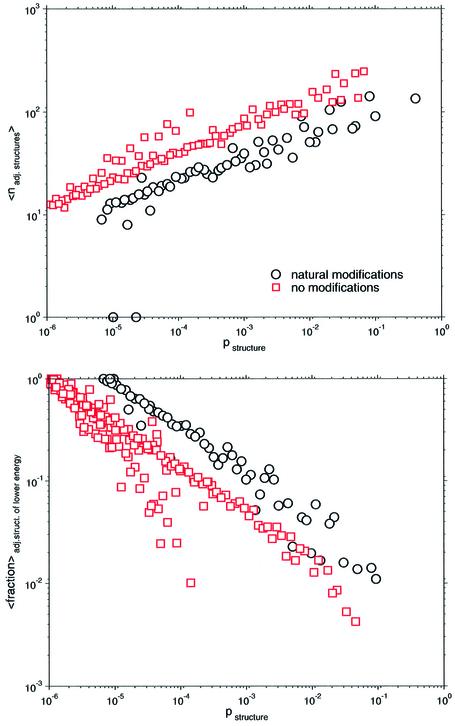
Figure 5 shows correlations that are related to this ensemble probability of structures. Interestingly, regardless of the degree of modification, all conformational spaces show a positive power-law dependency of the probability of structures to the arithmetic mean number of transitions to other structures. In other words, the more probable (i.e. stable in thermodynamic terms) the structure in the ensemble, the higher the probability of finding it frequently in the vicinity of other structures. In contrast, the more frequently one structure occurs in the ensemble, the lower the probability of finding a structure of lower energy in its vicinity, which is indicated by its mean fractions. Since modified bases are regarded as non-pairing, a considerable number of conformations must not occur, which shifts distributions of modified sequences to higher ensemble probabilities. Interestingly, power-law exponents prove to be approximately the same for all distributions. Again, modifications prevent conformations from folding but leave the structure and size of the underlying conformational spaces essentially unchanged (data not shown).
Figure 5.
Probability of a certain structure against arithmetic mean number of adjacent structures and arithmetic mean fraction of links, which point to structures of lower energy. Conformational spaces of modified and unmodified sequences of E.coli tRNAphe set up by suboptimal structures within 11 kT were considered.
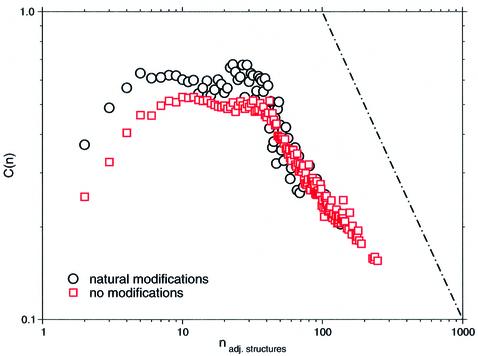
The clustering coefficient C(v) of a node v has already been found to be independent of the current network’s size. However, quantitative numbers of C(v) depend on modifications. Figure 6 indicates another interesting correlation of C(v) with the number of adjacent structures of one particular structure, i.e. its degree kv. Recent contributions report the emergence of hierarchical networks that exhibit the latter one particularly. Regarding regions of higher connectivity among structures, distributions reflect this dependency, C(v) ∼ kv–1, which seems to be fairly independent from any modifications. Furthermore, this correlation is shown to be independent of the size of the conformational space (data not shown).
Figure 6.
Dependence of the clustering coefficient C(n) to the number of adjacent structures n. Escherichia coli tRNAphe. Conformational spaces of modified and unmodified sequences of E.coli tRNAphe set up by suboptimal structures within 11 kT were considered.
DISCUSSION
Data of conformation spaces
It has already been mentioned that the total number of structures estimated is tremendous. Thus, I only considered cutouts of the respective conformational spaces, as the complete knowledge of the whole structure space is not necessary in order to comprehend its fundamental properties. It was explicitly shown that modifications, as well as different numbers of structures thus obtained, keep the fundamental topology of the conformational space unaffected.
Structures were computed with energy parameters, which were measured mainly at 37°C. In principle, conformational spaces might also have been set up with structures calculated at different temperatures. Many energetic parameters at different temperatures are subject to approximation. Results suggest, however, that there is no reason to expect altered topologies of the conformational space due to temperature changes.
Nature of small worlds
The topology of small-world networks uncovers nodes that prove to be more highly linked than the average nodes. In other works, these particular nodes were credited a special role. This particular set of nodes was identified as an evolutionary ‘core’ in metabolic networks (13,14). Similarly, some protein domains were found to serve as starting points of proteome evolution (16). Obviously, highly linked structures can be credited a similar role. They prove to be energetically stable and frequently occur in the thermodynamic ensemble, which denotes a local minimum in a reasonable number of cases. Since these conformations show high numbers of structures in their vicinity, they have to comprise a structural and energetic disposition, which enables them to transit from one structure to the other. However, it should also be kept in mind that this observation is subject to the move set, which essentially shapes the conformational space.
The most salient features of small-world topology in conformational spaces of RNA is the high degree of local clustering. Results indicate that natural modifications influence the degree of local clustering far more than no modifications. The immediate result is a shift towards higher values of mean clustering coefficient C (Fig. 3). Thus, the natural modifications have a subtle streamlining effect on the shape of the conformational space.
To conclude, modifications leave the nature of small-world topology untouched albeit natural modifications have a reasonable enhancing and streamlining effect on the features of this topology.
Energy landscapes
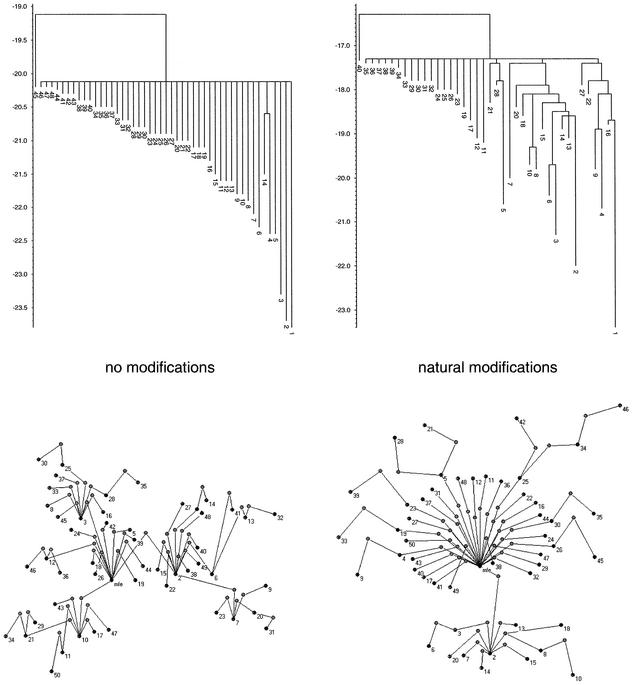
With the results obtained so far a comprehensive picture of tRNA landscapes can be drawn. Modifications inhibit some structures from folding. Thus, the conformational space of the modified sequence emerges more sparsely than the corresponding unmodified one. Henceforth, modifications also prevent partly energetically unfavorable barriers leading to energy minima, which might be traps for the folding process. Thus, conformational spaces of unmodified RNA sequences show a sculptured landscape with considerably more possibilities to slow the folding process by getting trapped preferentially in an energetically unfavorable energy minimum (Fig. 7). The barrier tree of the unmodified conformation space displays this observation very significantly. Obviously, a large number of local minima are connected by considerably low barrier heights. The probability that the folding process stops in a particular minimum in this smooth landscape depends essentially on the barrier heights. Thus, a lot of different folding funnels emerge. Focusing on conformational spaces that were shaped with the aid of modifications, the topology is quantitatively modified but remains qualitatively unaltered. Figure 7 summarizes the results of this study. Since the folding opportunities and transitions between them are substantially limited, certain folding funnels emerge and lead more frequently to distinct kinetically favorable structures. Considering stochastic simulations of tRNA conformation spaces, they frequently prove to be the biologically meaningful ones (5).
Figure 7.
Barrier trees and merged landscape of the unmodified and naturally modified E.coli tRNAphe sequence. Scales of the barrier trees denote free energy. Black dots characterize local minima, light gray ones denote saddle points. Numbers on each half of the figure refer to the same structures.
This observation coincides with an increased degree of connectivity and local clustering, which enhances the relevance of folding funnels and focuses the mean number of steps through the conformational space. Mean clustering coefficient opens the possibility of treating the whole conformational space from a hierarchical perspective. Basically, concepts that yield the inverse correlation of the mean clustering coefficient to the degree of a particular node, C(v) ∼ kv–1, consider the set up of networks from an iterative or hierarchical point of view. This network architecture is made of numerous small, highly integrated modules, which themselves are assembled into larger higher order modules. Thus, the small ones are less integrated but clearly distinguishable from the higher order formation. This idea of generating a network could be repeated several times ending up in a constantly less cohesive topology that still emphasizes separable lower order modules. This model might be directly relevant to these investigations. In this sense, modules might be set up by local similar substructures of the RNA that are easily convertible to each other by simple elementary moves. Highly connected nodes in the conformational space, mainly local minima, would be structures that interconnect such substructural modules along a path of elementary moves. Hence, they describe neuralgic points on the folding paths towards other substructural modules. Saddle points that essentially connect local minima might be those points of these folding paths which peak at highest energy.
The idea that modifications help to streamline the underlying conformational space by sharpening small-world properties, i.e. C, fits the picture perfectly. Thus, modifications are the key to enhancing the clustered structure of the conformational space as well as its set up by substructural modules.
Acknowledgments
ACKNOWLEDGEMENTS
Fruitful discussions with Ursula Kummer, Ralph Gauges, Carola Busse, Albert-Laszlo Barabasi and Kelly Elkins are gratefully acknowledged. The Klaus-Tschira Foundation (KTF) is acknowledged for funding this project.
REFERENCES
- 1.Zuker M. and Stiegler,P. (1981) Optimal computer folding of larger RNA sequences using thermodynamics and auxiliary information. Nucleic Acids Res., 9, 133–148. [DOI] [PMC free article] [PubMed] [Google Scholar]
- 2.Zuker M. and Sankoff,D. (1984) RNA secondary structures and their prediction. Bull. Math. Biol., 46, 591–621. [Google Scholar]
- 3.Hofacker I.L., Fontana,W., Stadler,P.F., Bonhoeffer,S., Tacker,M. and Schuster,P. (1994) Fast folding and comparison of RNA secondary structures. Monatsh. Chem., 125, 167–188. [Google Scholar]
- 4.Zuker M. (2000) Calculating nucleic acid secondary structure. Curr. Opin. Struct. Biol., 10, 303–310. [DOI] [PubMed] [Google Scholar]
- 5.Flamm C., Fontana,W., Hofacker,I. and Schuster,P. (2000) RNA folding at elementary step resolution. RNA, 6, 325–338. [DOI] [PMC free article] [PubMed] [Google Scholar]
- 6.Isambert H. and Siggia,E. (2000) Modeling RNA folding paths with pseudoknots: application to hepatitis delta virus ribozyme. Proc. Natl Acad. Sci. USA, 97, 6515–6520. [DOI] [PMC free article] [PubMed] [Google Scholar]
- 7.Flamm C., Hofacker,I. and Stadler,P. (1999) RNA in silico: the computational biology of RNA secondary structures. Adv. Complex Syst., 2, 65–90. [Google Scholar]
- 8.Flamm C., Hofacker,I., Stadler,P. and Wolfinger,M. (2002) Barrier trees of degenerate landscape. Z. Phys. Chem., 216, 155–173. [Google Scholar]
- 9.Zuker M. (1989) On finding all suboptimal foldings of an RNA molecule. Science, 244, 48–52. [DOI] [PubMed] [Google Scholar]
- 10.Wuchty S., Fontana,W., Hofacker,I. and Schuster,P. (1999) Complete suboptimal folding of RNA and the stability of secondary structures. Biopolymers, 49, 145–165. [DOI] [PubMed] [Google Scholar]
- 11.Scala A., Amaral,L. and Barthélémy,M. (2001) Small-world networks and the conformation space of a short lattice polymer chain. Europhys. Lett., 55, 594–599. [Google Scholar]
- 12.Watts D. and Strogatz,S. (1998) Collective dynamics of ‘small-world’ networks. Nature, 393, 440–442. [DOI] [PubMed] [Google Scholar]
- 13.Wagner A. and Fell,D. (2001) The small world inside large metabolic networks. Proc. R. Soc. Lond. B Biol. Sci., 268, 1803–1810. [DOI] [PMC free article] [PubMed] [Google Scholar]
- 14.Fell D. and Wagner,A. (2000) The small world of metabolism. Nat. Biotechnol., 189, 1121–1122. [DOI] [PubMed] [Google Scholar]
- 15.Newman M. (2001) The structure of scientific collaboration networks. Proc. Natl Acad. Sci. USA, 98, 404–409. [DOI] [PMC free article] [PubMed] [Google Scholar]
- 16.Wuchty S. (2001) Scale-free behavior in protein domain networks. Mol. Biol. Evol., 18, 1694–1702. [DOI] [PubMed] [Google Scholar]
- 17.Milgram S. (1967) The small-world problem. Psychol. Today, 2, 60–67. [Google Scholar]
- 18.Bollobás B. (1985) Random Graphs. Academic Press Inc., London-New York.
- 19.Barthélémy M. and Amaral,L. (1999) Small-world networks: evidence for a crossover picture. Phys. Rev. Lett., 82, 3180–3183. [Google Scholar]
- 20.Waterman M. (1995) Introduction to Computational Biology. Chapman and Hall, London.
- 21.Schuster P., Fontana,W., Stadler,P. and Hofacker,I. (1994) From sequences to shapes and back: a case study in RNA secondary structures. Proc. R. Soc. Lond. B Biol. Sci., 255, 279–284. [DOI] [PubMed] [Google Scholar]
- 22.Erdös P. and Rényi,A. (1960) On the evolution of random graphs. Publ. Math. Inst. Hung. Acad. Sci., 5, 17–61. [Google Scholar]
- 23.Barabási A., Albert,R. and Jeong,H. (1999) Mean-field theory for scale-free random networks. Physica A, 272, 173–187. [Google Scholar]
- 24.Barabási A. and Albert,R. (1999) Emergence of scaling in random networks. Science, 286, 509–512. [DOI] [PubMed] [Google Scholar]
- 25.Ravasz E., Somera,A., Mongru,D., Oltvai,Z. and Barabai,A. (2002) Hierarchical organization of modularity in metabolic networks. Science, 297, 1551–1555. [DOI] [PubMed] [Google Scholar]
- 26.Dorogovtsev S., Goltsev,A. and Mendes,J. (2002) Pseudofractal scale-free web. Phys. Rev. E Stat. Nonlin. Soft Matter Phys., 066122. [DOI] [PubMed] [Google Scholar]
- 27.Mehlhorn K. and Naeher,S. (1999) The LEDA Platform of Combinatorial Computing. Cambridge University Press, Cambridge.
- 28.Batagelj V. and Mrvar,A. (1998) PAJEK—Program for large network analysis. Connections, 21, 47–57. [Google Scholar]
- 29.Sprinzl M., Horn,C., Brown,M., Ioudovitch,A. and Steinberg,S. (1998) Compilation of tRNA sequences and sequences of tRNA genes. Nucleic Acids Res., 26, 148–153. [DOI] [PMC free article] [PubMed] [Google Scholar]
- 30.Higgs P.G. (1995) Thermodynamic properties of transfer RNA: a computational study. J. Chem. Soc. Faraday Transactions, 91, 2531–2540. [Google Scholar]
- 31.Bollobás B. (1998) Modern Graph Theory. Springer, New York.


