Abstract
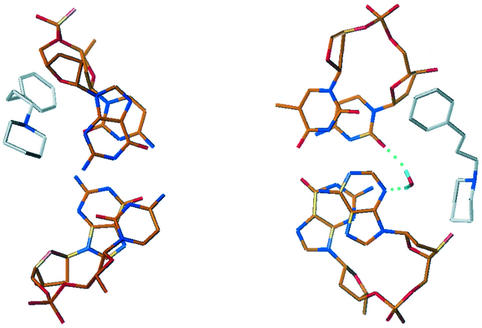
The binding of two symmetric bis-benzimidazole compounds, 2,2-bis-[4′-(3″-dimethylamino-1″-propyloxy)phenyl]-5,5-bi-1H-benzimidazole and its piperidinpropylphenyl analog, to the minor groove of DNA, have been studied by DNA footprinting, surface plasmon resonance (SPR) methods and molecular dynamics simulations in explicit solvent. The footprinting and SPR methods find that the former compound has enhanced affinity and selectivity for AT sequences in DNA. The molecular modeling studies have suggested that, due to the presence of the oxygen atom in each side chain of the former compound, a water molecule is immobilized and effectively bridges between side chain and DNA base edges via hydrogen bonding interactions. This additional contribution to ligand–DNA interactions would be expected to result in enhanced DNA affinity, as is observed.
INTRODUCTION
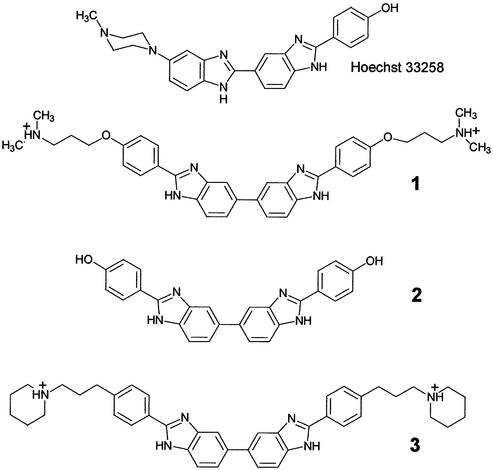
Specific recognition of DNA sequences by small organic molecules is of importance both for the targeting of specific genes in a genome, and for chemotherapeutic purposes (1,2). A large variety of such compounds have been developed, notably pyrrole/imidazole polyamides (3,4), polybenzamides (5,6), diphenylfuran diamidines (7–9), carbazoles (10) and cyclopropylpyrroloindoles related to bizelesin and adozelesin (11). These are typically crescent shaped for optimal isohelicity, and cationic. One of the most extensively investigated classes of compounds that bind to the minor groove of DNA contains the bis-benzimidazole group derived from the anthelmintic compound Hoechst 33258 (H33258, pibenzimole; Fig. 1). A number of structures of H33258 bound to the minor groove of a 4–6 bp long AT-tract oligonucleotide have been solved by NMR and X-ray crystallography (12–23). These structural studies provide a basis to identify factors controlling DNA sequence recognition (24–26), and models to rationally design DNA-reading molecules that could ultimately be used as tools or therapeutic agents to control gene expression in cells.
Figure 1.
Structure of the drugs used in this study.
The vast majority of H33258 derivatives designed to date are asymmetric and possess two, sometimes three, benzimidazole heterocycles associated in a head-to-tail manner (25,27–34). Usually, they also contain a positively charged terminal group such as amidinium, or tetrahydropyrimidinium, that mimics the N-methyl-piperazino group of H33258 (35–37). At the other end of the molecule, the phenol ring is usually maintained or capped with an ethoxy group as is the case with the fluorescent dye H33342 frequently used in cytometry studies of DNA condensation. Recently, an alternative series of symmetric head-to-head bis-benzimidazoles has been synthesized and evaluated as antitumor agents (38). X-ray crystallographic structural studies have shown that compound 1, 2,2-bis-[4′-(3″-dimethylamino-1″-propyloxy)phenyl]-5,5-bi-1H-benzimidazole binds to four consecutive AT base pairs in the minor groove of the duplex d(CGCGAATTCGCG)2. Its promising anticancer activity, in particular against ovarian carcinomas, makes this compound a new lead candidate for the rational development of tumor-active minor-groove binders (38).
In the present study, we have compared the sequence recognition properties of compound 1 and two other symmetric head-to-head bis-benzimidazoles by means of DNase I footprinting and surface plasmon resonance (SPR). The uncharged analog 2 lacks the dimethylaminopropyl groups at the two tails of 1, whereas the analog 3 has two piperidinpropylphenyl side chains. This side chain was examined in the hope that it would confer enhanced DNA affinity. This study reveals that this is not the case, and that the kinetics of DNA association and dissociation together with consideration of the role of discrete minor-groove water molecules, are key elements in explaining the A/T selectivity of the compounds. This information may be of use in guiding the design of future effective DNA-binding molecules.
MATERIALS AND METHODS
Drugs, buffers, DNA and oligonucleotides
The syntheses of compounds 1 and 2 have recently been described (38). Compound 3 was prepared in an analogous manner. HBS-EP buffer sterile filtered and degassed was obtained from Biacore (0.01 M HEPES pH 7.4, 0.15 M NaCl, 3 mM EDTA, 0.0005% Surfactant P20). Three different 5′-biotin labeled hairpins (Midland Certified Reagent Co.; HPLC purified) were used in SPR studies (hairpin loop under lined): d(biotin-CGAATTCGTCTCCGAATTCG); d(biotin-CATATATATCCCCATATATATG); d(biotin-CGCGCGC GTTTTCGCGCGCG). All other chemicals were analytical grade reagents.
Purification of DNA restriction fragments and radiolabeling
Plasmids pBS and pKS (Stratagene) were isolated from Escherichia coli by a standard sodium dodecyl sulfate–sodium hydroxide lysis procedure and purified by banding in CsCl-ethidium bromide gradients. Ethidium was removed by several isopropanol extractions followed by exhaustive dialysis against Tris-EDTA buffered solution. The purified plasmid was then precipitated and resuspended in appropriate buffered medium prior to digestion by the restriction enzymes. The two pBS DNA fragments were prepared by 3′-[32P]-end labeling of the EcoRI–PvuII double digest of the plasmid using α-[32P]dATP and AMV reverse transcriptase. Similarly, the 178mer fragment was prepared by 3′-end labeling of the EcoRI–PvuII digest of plasmid pLAZ3. In each case, the labeled digestion products were separated on a 6% polyacrylamide gel under non-denaturing conditions in TBE buffer (89 mM Tris-borate pH 8.3, 1 mM EDTA). After autoradiography, the requisite band of DNA was excised, crushed and soaked in water overnight at 37°C. This suspension was filtered through a Millipore 0.22 µm filter and the DNA was precipitated with ethanol. Following washing with 70% ethanol and vacuum drying of the precipitate, the labeled DNA was resuspended in 10 mM Tris adjusted to pH 7.0 containing 10 mM NaCl.
DNase I footprinting
Experiments were performed essentially as previously described (39). Briefly, reactions were conducted in a total volume of 10 µl. Samples (3 µl) of the labeled DNA fragments were incubated with 5 µl of the buffered solution containing the ligand at appropriate concentration. After 30 min of incubation at 37°C to ensure equilibration of the binding reaction, the digestion was initiated by the addition of 2 µl of a DNase I solution whose concentration was adjusted to yield a final enzyme concentration of ∼0.01 U/ml in the reaction mixture. After 3 min, the reaction was stopped by freeze-drying. Samples were lyophilized and resuspended in 5 µl of an 80% formamide solution containing tracking dyes. The DNA samples were then heated at 90°C for 4 min and chilled in ice for 4 min prior to electrophoresis.
Electrophoresis and quantitation by storage phosphorimaging
DNA cleavage products were resolved by polyacrylamide gel electrophoresis under denaturating conditions (0.3 mm thick, 8% acrylamide containing 8 M urea). After electrophoresis (∼2.5 h at 60 W, 1600 V in Tris-Borate-EDTA buffered solution, BRL sequencer model S2), gels were soaked in 10% acetic acid for 10 min, transferred to Whatman 3MM paper, and dried under vacuum at 80°C. A Molecular Dynamics 425E PhosphorImager was used to collect data from the storage screens exposed to dried gels overnight at room temperature. Base line-corrected scans were analyzed by integrating all the densities between two selected boundaries using ImageQuant3.3. Each resolved band was assigned to a particular bond within the DNA fragments by comparison of its position relative to sequencing standards generated by treatment of the DNA with dimethylsulfate followed by piperidine-induced cleavage at the modified guanine bases in DNA (G-track).
Determination of binding constants by SPR
SPR measurements were performed with a four-channel BIAcore 3000 optical biosensor system and streptavidin-coated sensor chips (SA). Three consecutive 1 min injections of 1 M NaCl in 50 mM NaOH followed by extensive washing with buffer were used to prepare the sensor chips. Nearly the same amounts of 5′-biotinylated oligomers (25 nM) in HBS-EP buffer were immobilized on the surface by non-covalent capture, leaving one of the flow cells blank as a control. Manual injection was used with a flow rate of 2 µl/min to achieve long contact times with the surface and to control the amount of the DNA bound to the surface. Solutions of compound with known concentrations were prepared in filtered and degassed buffer by serial dilutions from stock solution and passed over the immobilized DNA surfaces for a predetermined time period (typically 10–20 min) at a flow rate of 20–30 µl/min and 25°C. Buffer flow alone during 20 min was generally sufficient to dissociate the drug from DNA for surface regeneration.
Average fitting of the sensorgrams at the steady-state level was performed with the BIAevaluation 3.0 or 3.1 programs. To obtain the affinity constants the results from the steady-state region were fitted to one- or two-site interaction models (equation 1) using Kaleidagraph for nonlinear least squares optimization of the binding.
r = (K1 ∗ Cfree + 2 ∗ K1 ∗ K2 ∗ Cfree2) / (1 + K1 ∗ Cfree + K1 ∗ K2 ∗ Cfree2)1
where r = RU / RUmax, K1 and K2 are the variable parameters to fit, RU is the response at the steady-state level, RUmax is the maximum response for binding one molecule per binding site, Cfree is the concentration of the compound in solution and K1 and K2 are the macroscopic binding constants. K2 is zero for a single-site binding model. The RUmax was determined as previously described (40) from the DNA molecular weight, amount of DNA on the flow cell, the compound molecular weight and the refractive index gradient ratio of the compound and DNA. The K values are determined for each set of sensorgrams by nonlinear least square fitting of r versus Cfree plots for compound bound to each DNA.
Molecular modeling
The coordinates of the X-ray crystal structure of the complex between d(CGCGAATTCGCG) and compound 1 (Nucleic Acid Database entry no. DD0036) were used as a starting model. Minimization and dynamics of the complex were performed using the AMBER 6.0 force field and the SANDER module (AMBER 6.0, University of California, San Francisco). A 10 Å non-bonded Lennard-Jones cutoff was used. The particle-mesh-Ewald summation term was activated for all simulations in order to take into account the long-range electrostatic interactions. The force-field parameters for the ligand were extrapolated from existing values for analogous groups in the AMBER and CFF force fields (INSIGHTII Modelling Environment, Molecular Simulations Inc., San Diego, 1999). Ligand charges were calculated using the AM1 semi-empirical formalism in the MOPAC package within the INSIGHT II suite. The complex was neutralized by adding 22 sodium ions at grid points of negative Coulombic potential and it was subsequently solvated (using the WATBOX216 routine) in a periodic water box (∼55 × 56 × 72 Å), which extended at least 10 Å from any solute atom. An equilibration protocol was adopted to allow the water molecules to reorient in order to make favorable contacts with the solute. First, a 1000 iterations potential energy minimization was carried out with 50 kcal/mol-residue harmonic restraint on the starting structure, followed by 3 ps molecular dynamics at 300 K. The harmonic restraint was then released during five steps (10 kcal/mol-residue each step) of conjugate gradient minimization (1000 iterations). A final dynamics production run of 1000 ps (1 fs step) was carried out at 300 K, using the SHAKE routine (41).
The structure of a complex between compound 3 and the dodecamer duplex DNA sequence d(CGCGAATTCGCG)2 was constructed, starting from the known structure of the dodecanucleotide complex with compound 1 (see above). The geometry and orientation of the bis-benzimidazole group were left exactly as they were in the X-ray crystal structure. Instead the terminal dimethylaminopropyloxy side chains of 1 were mutated into the two piperidinopropyl groups of 3. The solvated complex was then subjected to 3 ps molecular dynamics at 300 K followed by 200 steps of conjugate gradient minimization with a 50 kcal/mol-residue harmonic restraint on the DNA and on the bis-benzimidazole central moiety. The complex was then neutralized, solvated and equilibrated using the same protocols as described above for 1. Finally, a dynamics production run of 1000 ps (1 fs step) was carried out at 300 K. Relative binding energies were calculated (42) from the structures averaged over the production runs, which were then subjected to molecular mechanics minimizations to convergence.
RESULTS
DNase I footprinting
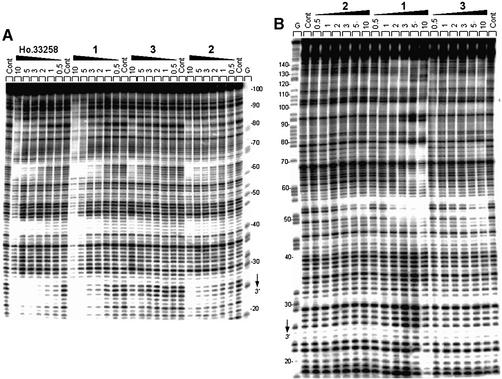
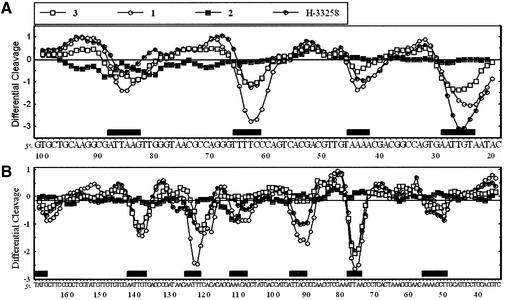
Three different DNA restriction fragments of 117, 178 and 265 bp, all 3′-end labeled, were employed to investigate sequence recognition by the symmetric head-to-head bisbenzimidazoles. Footprinting studies were performed using the endonuclease DNase I, which is a sensitive enzyme for mapping DNA-binding sites of small molecules. Examples of autoradiographs of the sequencing gels used to fractionate the products of partial digestion of the 117 and 178 bp DNA fragments complexed with the three test compounds are shown in Figure 2. Visual inspection of the gels shows clearly that the head-to-head bis-benzimidazoles are sequence- selective binders, as is the case for the head-to-tail compound Hoechst 33258 used as a control. But the magnitude of the footprints varies significantly depending on the structure of the drug. With compounds 2 and 3 there was relatively little inhibition of DNase I cuttin, whereas compound 1 strongly affected the cleavage of the DNA substrates by the nuclease. With compound 1, numerous bands in the drug-containing lanes were weaker than the same bands in the drug-free lane, corresponding to attenuated cleavage, while others display relative enhancement of cutting. The positions of the footprint are identical for compound 1 and Hoechst 33258, indicating that these two compounds exhibit the same sequence preference. A densitometric analysis of the autoradiographs obtained with the 117 and 265 bp fragments from plasmid pBS is shown in Figure 3. In the presence of 2 µM of compound 1, several regions of attenuated DNA cleavage can be discerned around positions 26, 44, 64, 85 (117mer) and 53, 77, 92, 110, 123, 139 and 168 (265mer). The footprints all coincide with the position of AT-rich sequences, such as 5′-ATTAA, 5′-TTTT and 5′-AAATTAA for example. All footprints encompass at least four consecutive AT base pairs. In contrast, at 2 µM, compound 3 showed almost no protection of AT-rich sequences whereas weak but noticeable footprints were already visible at this concentration with the uncharged compound 2. A concentration ≥10 µM is required to detect preferential binding of compound 3 to AT sites. Clearly the cationic side chains of this compound are detrimental to sequence recognition. This is in excellent agreement with the SPR data (see below).
Figure 2.
Sequence selective binding. The gels show DNase I footprinting with (A) 117mer and (B) 178mer PvuII–EcoRI restriction fragments cut from the plasmids pBS and pKS, respectively. In both cases, the DNA was labeled at the EcoRI site with [α-32P]dATP in the presence of AMV reverse transcriptase. The products of nuclease digestion were resolved on an 8% polyacrylamide gel containing 7 M urea. Control tracks (Cont) contained no drug. The concentration (µM) of the drug is shown at the top of the appropriate gel lanes. Tracks labeled ‘G’ represent dimethylsulfate-piperidine markers specific for guanines. Numbers on the side of the gels refer to the standard numbering scheme for the nucleotide sequence of the DNA fragment.
Figure 3.
Differential cleavage plots comparing the susceptibility of (A) the 117mer and (B) the 265mer pBS restriction fragments to DNase I cutting in the presence of the bis-benzimidazole compounds (2 µM each). Negative values correspond to a ligand-protected site and positive values represent enhanced cleavage. Vertical scales are in units of ln(fa) – ln(fc), where fa is the fractional cleavage at any bond in the presence of the drug and fc is the fractional cleavage of the same bond in the control, given closely similar extents of overall digestion. Each line drawn represents a 3-bond running average of individual data points, calculated by averaging the value of ln(fa) – ln(fc) at any bond with those of its two nearest neighbors. Only the region of the restriction fragment analyzed by densitometry is shown. Black boxes indicate the positions of inhibition of DNase I cutting in the presence of the drugs.
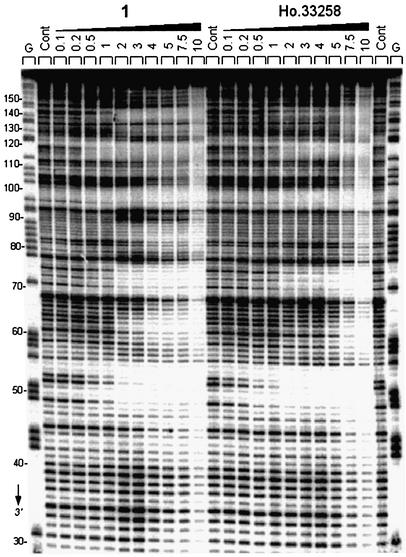
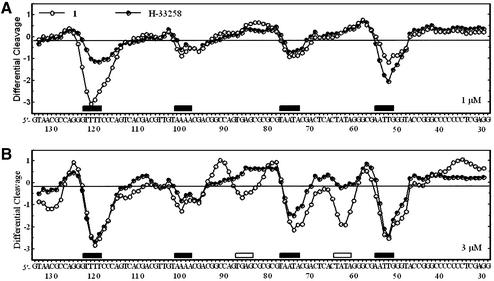
Similar conclusions can be made from the experiments performed with the 178 bp fragment. As shown in the gel in Figure 2B, compound 1 binds very strongly to the AATT site around position 53, whereas this site is filled much more weakly by compounds 2 and 3. A detailed comparison of the binding to DNA of compound 1 and Hoechst 33258 is presented in the gel shown in Figure 4, and the corresponding cleavage plots in Figure 5. Although from the gel the footprinting patterns appear visually very similar for the two drugs, the densitometric analysis reveals interesting local differences. At 1 µM, compound 1 and Hoechst 33258 bind equally well to the 5′-AATT, TAATA and TAAAA sites at positions 53, 75 and 100, respectively. The fourth binding site identified around position 120 corresponds to the sequence 5′-TTTT to which compound 1 appears to bind more strongly than the Hoechst dye (Fig. 5A). This is consistent with what was observed with the other DNA fragments. Indeed, the same sequence occurred in the 117 bp fragment around position 64 and at that site we also detected a higher site occupancy for compound 1 versus Hoechst 33258 (Fig. 3A). At a slightly higher concentration, 3 µM, the magnitude of the footprint at the 5′-TTTT site is identical for the two drugs, as is the case for the 5′-AATT and 5′-TAAAA sites (Fig. 5B). But at this concentration a new footprint was detected at the sequence TATA around position 63 (open rectangle in Fig. 5B) for compound 2 but not for Hoechst 33258. Similarly, a weak footprint appeared specifically with the symmetric head-to-head bis-benzimidazole derivatives around position 86 at a mixed TGAG sequence flanked by GC tracts, whereas no effect was seen with the head-to-tail compound Hoechst 33258 (open rectangle in Fig. 5B). The two sequences (purely GC) flanking this new binding site become more susceptible to attack by DNase I than in the control in the presence of compound 1. The cleavage enhancement at these GC sites may be attributable to drug-induced perturbations of the double helical structure of DNA. Compound 1 strongly discriminates between runs of guanines and/or cytosines. From the footprinting experiments, we concluded unambiguously that the binding of the bis-benzimidazole derivative 1 to AT sequences was much favored over binding to GC or mixed sequences.
Figure 4.
DNase I footprinting of compound 1 and Hoechst 33258 on the 174 bp PvuII–EcoRI DNA fragment from plasmid pKS. Numbers on the side of the gel refer to the standard numbering scheme for the nucleotide sequence of the DNA fragment, as indicated in Figure 5. Other details as for Figure 2.
Figure 5.
Differential cleavage plots comparing the susceptibility of the 174mer pKS DNA fragment to DNase I cutting in the presence of compound 1 or Hoechst 33258 at (A) 1 or (B) 3 µM. Filled boxes indicate the positions of binding sites common to the two compounds. Open boxes refer to the position of binding sites specific to compound 1.
BIAcore surface plasmon resonance experiments
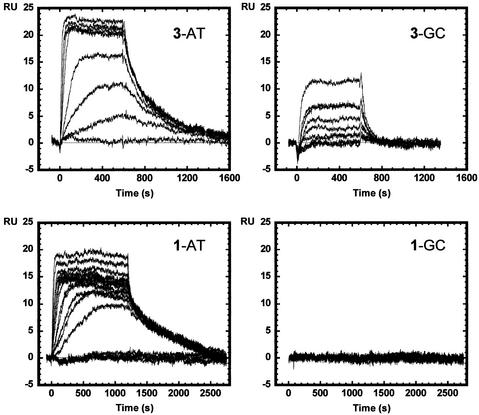
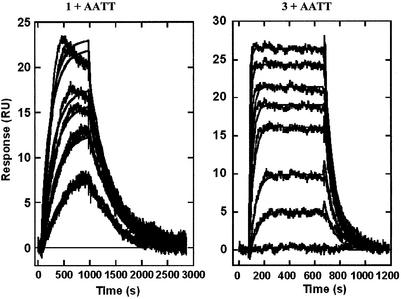
Binding studies with DNA hairpin–duplex oligomers were conducted with a BIAcore 3000 SPR instrument. The neutral compound 2 did not have sufficient solubility in buffer for BIAcore experiments. To compare the complexes of the compounds with A·T and G·C base pair sequences, the association of the compounds with two DNA oligomer hairpin–duplexes with alternating A·T or G·C base pairs was determined as described in the Materials and Methods. Sensorgrams at increasing compound concentrations for interaction with the two DNAs reveal significant differences between the DNA complexes (Fig. 6). Both compounds bind strongly to the AT DNA duplex and reach saturation in the concentration range used in these experiments (0–500 nM) as can be seen from the sensorgrams. With the GC sequence, however, no binding of compound 1 can be detected over the same concentration range, while quite significant binding of compound 3 is observed. The binding of compound 3 to the GC sequence is, however, weaker than its interaction with the AT DNA. The sensorgram results were fit in the steady-state region as described in the Materials and Methods, and binding constants are collected in Table 1. As expected from observation of the sensorgrams, the binding constants for binding to the AT DNA are large (4–7 × 10⁷) and similar for the two compounds. The binding constant for compound 1 with the GC DNA must be <106 since no binding is detected, while the binding of compound 3 to the GC DNA has a binding constant of 1.9 × 10⁶. The GC binding constant for compound 3 is ∼10 times lower than the AT binding constant for the same compound (Table 1). The AATT sequence also has a strong footprint with compound 1. BIAcore results for compounds 1 and 3 binding to an AATT DNA sequence are shown in Figure 7. Again, the binding is strong and the magnitude of the binding constants is similar for the two compounds. As with the alternating sequence AT DNA, compound 1 binds reproducibly more strongly to the AATT DNA than compound 3 (9.4 versus 2.1 × 10⁷ by steady-state analysis; Table 1).
Figure 6.
BIAcore SPR sensorgrams for the interaction of compounds 1 and 3 with the alternating AT and GC sequence DNA hairpins in HBS buffer at 25°C. Both compounds bind strongly to the AT sequence and reach saturation of the DNA in the concentration range of this experiment, 1–500 nM compound. In the same concentration range, no binding of compound 1 to the GC sequence is observed while significant binding of compound 3 can be detected. Fitting of results from these and additional experiments in the steady-state region provided data for determination of compound binding constants, as described in the Materials and Methods, and these are collected in Table 1.
Table 1. Equilibrium and kinetic constants for the interaction of compounds 1 and 3 with different sequence DNAs by SPR analysisa.
| Keqb (×10–7) | kac (×10–5) | kdc (×103) | ka / kd (×10–7) | |
|---|---|---|---|---|
| 1-AATT | 9.4 | 0.61 | 1.7 | 3.6 |
| 1-AT | 6.3 | 1.1 | 1.3 | 8.1 |
| 1-GC | <1 | |||
| 3-AATT | 2.1 | 3.0 | 12 | 2.6 |
| 3-AT | 2.0 | 3.4 | 5.1 | 6.6 |
| 3-GC | 0.18 | 0.47 | 25 | 0.20 |
We estimate the errors in BIA equilibrium constants for the single binding sites in this study to be: (i) for K values between ∼1 × 10⁵ and ∼2–3 × 10⁷, which is the most accurate range, errors are <10%; (ii) for K values between ∼5 × 10³ and ∼5 × 10⁴ errors increase to ∼15–20% due to the difficulty of reaching RU values close to the site saturation point; (iii) for K values >2–3 × 10⁷ errors again increase, due to the difficulty of collecting data at low amounts of site saturation. We estimate the error in the AT binding constants for compound 1 to be ∼10–15% and for compound 3 to be ∼10%. The error in the K for GC binding of compound 3 is ∼10–15%. These error estimates are in agreement with K values from repeat BIAcore experiments.
aExperiments were conducted in HBS buffer at 25°C.
bEquilibrium constants were determined from the RU values in the steady-state region of the sensorgrams at each concentration as described in the Materials and Methods.
cKinetic constants were determined by global fitting of sensorgrams at all concentrations in each experiment.
Figure 7.
BIAcore SPR sensorgrams for the complexes of compounds 1 and 3 with the AATT DNA minor groove in HBS buffer at 25°C. Both compounds bind strongly to the AATT sequence and reach saturation at concentrations below 500 nM. Global fitting of the curves to obtain association and dissociation kinetics constants was done with BIA Evaluation software and a single site interaction model (Materials and Methods). The best-fit lines through each experimental plot are also shown in the Figure and as can be seen, the global, single-site model provides excellent fits to all of the experimental curves. Similar fits with the other DNA samples provided the kinetics constants in Table 1.
Visual observation of the binding sensorgrams for the two compounds interacting with the AT DNA sequence indicated that even though the binding affinities were similar for the compounds at the AT sites, the rates of binding were different. Compound 1 has both slower association and slower dissociation kinetics than compound 3. Global kinetics fits to the sensorgrams for compounds 1 and 3 with the AATT sequence, where there is one specific binding site, are shown in Figure 7 and the kinetics results are also collected in Table 1. The sensorgrams for compound 1 decrease slightly with time at the highest concentrations used in the experiments, but deletion of these curves with subsequent fitting suggests that the decrease does not cause a large error in fitting in this case. With the AATT sequence the curves are fit quite well with a model having one binding site per DNA hairpin and the residuals are generally small. With the alternating AT and GC DNA samples, the kinetics results suggest some weaker secondary sites of compound binding are present. The results in Table 1 are for binding to the strong primary binding site. With the AATT DNA sequence where the most accurate fitting could be done, both the on and off rates for compound 1 are five to seven times lower than for compound 3. Binding constants determined by the ratio of ka/kd are not as accurate as with the steady-state fitting method but are in the same range as obtained with the steady-state fits (Table 1). With the GC sequence, kinetics constants could only be determined with compound 3 due to the very weak binding of compound 1 to the GC DNA. As can be seen from the results in Table 1, the lower binding affinity of compound 3 for the GC relative to the AT sequence DNA is due to a combination of lower association and larger dissociation rate constants. The equilibrium constants calculated by steady-state and kinetics methods are quite close for the GC DNA sequence.
Molecular modeling
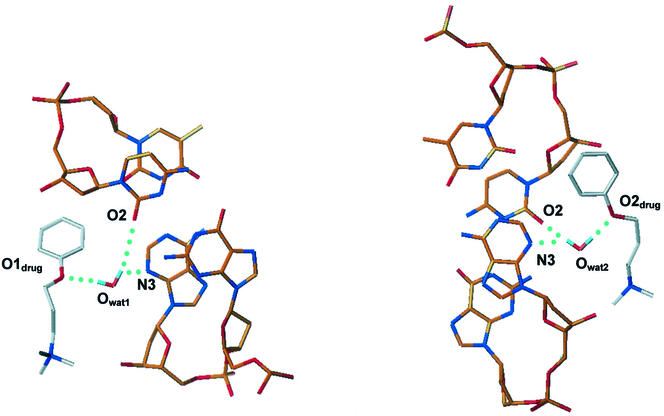
The weak footprints obtained with the neutral compound 2 could be predicted, but similar results were expected both in terms of footprints and binding affinity for AATT sequences for the two doubly charged ligands 1 and 3. Compound 3 had originally been designed to increase the binding affinity of compound 1 since it has the two terminal methyl groups replaced with a cyclic group having a larger van der Waals surface. In order to rationalize the experimental data obtained from DNase I footprinting and BIAcore SPR experiments, molecular mechanics and dynamics simulations have been performed for complexes 1 and 3. Both complexes have been studied in an explicit water solvated environment using standard AMBER protocols for dynamic simulations. The structures of both compound 1 and 3 stayed stable throughout all the 1000 ps of dynamic simulation and their shapes adapted very well to the minor groove curvature. The hydrogen bond donors and the aromatic systems of the two benzimidazole subunits formed stable non-covalent hydrogen bond interactions with the four AT base pairs in the center of the sequence, whereas differences were observed in the way that the side chains of the two drugs interacted with the GC base pairs adjacent to the AATT central core. A well localized and relatively immobile water molecule mediated the non-covalent interaction between each side chain of compound 1 and the DNA, through the formation of a triad of hydrogen bonds involving the phenoxy oxygen atom in the ligand molecule and the O2 and N3 hydrogen bond acceptor atoms in the cytosine and adenine bases (Table 2 and Fig. 8). There are no contacts <3.6 Å between the water molecules and ligand side chain carbon atoms. The hydrogen bond interactions would be expected to significantly enhance the binding affinity between compound 1 and the DNA. In compound 3, on the other hand, the replacement of the phenoxy oxygen in each side chain by a carbon atom confers greater hydrophobic character to the side chains and removes the possibility of water-mediated hydrogen bonding to bases. During the dynamics simulation only one water molecule was observed in the region between the drug and the DNA (Fig. 9). This single water molecule created stable hydrogen bonds with O2 of a cytosine and N3 of a guanine, but no specific interactions with the ligand were observed.
Table 2. Geometric features of the hydrogen bonding arrangement around the water molecule in the complex with ligand 1, taken from the averaged structure, as shown in Figure 8.
| Distances (Å) | Angles (°) | |||||
|---|---|---|---|---|---|---|
| O1drug | O2drug | O2 | N3 | Od–Ow–O2 | Od–Ow–N3 | |
| O1w | 3.19 | – | 3.36 | 2.93 | 84 | 132 |
| O2w | – | 3.16 | 3.31 | 2.95 | 84 | 138 |
Atoms O1drug, O2drug are the phenoxy oxygen atoms in each ligand side chain, and atoms O1w, O2w are the corresponding water molecules located in the minor groove.
Figure 8.
Plots of the averaged MD structure of the complex of compound 1 with d(CGCGAATTCGCG)2, showing the water molecule bridging between the ligand and base edges. Hydrogen bonds are shown as dashed lines.
Figure 9.
Plots of the averaged MD structure of the complex of compound 3 with d(CGCGAATTCGCG)2, showing the sole water molecule in the vicinity of the ligand–DNA interface.
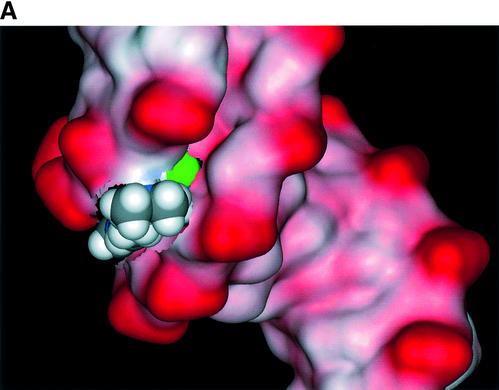
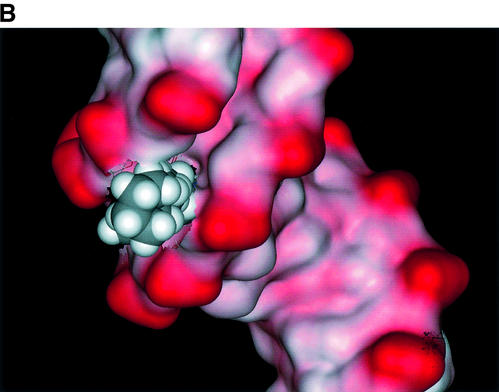
The relative binding energy of compound 1 to the d(CGCGAATTCGCG)2 structure was calculated to be –112 kcal/mol, and that of compound 3 to be –92 kcal/mol. We suggest that the tight hydrogen bond network observed in the complex with compound 1, compared with its absence in the complex with compound 3, is a major factor in the lower binding affinity of compound 3 and its weak DNA footprint. Although such calculations are necessarily approximate, it is reassuring that the difference in relative binding energies, of 20 kcal/mol, is what would be expected for the difference of six hydrogen bonds between the complexes. The terminal piperidine groups in compound 3, even though they have a larger van der Waals interaction surface than the methyl groups in compound 1, are not fully embedded in the groove, and thus do not offset the hydrogen bonding contributions made by the latter. Figure 10 shows that the absence of the bridging water molecule in the complex with compound 3 results in the appearance of a small void between the ligand and minor-groove surface.
Figure 10.
Plots of the solvent-accessible surface of the d(CGCGAATTCGCG)2 duplex together with the van der Waals surface of each ligand, viewed down one end of the minor groove for each averaged structure, (A) showing the complex with ligand 1, with the bound water molecule shown in green, and (B) showing the complex with ligand 3. A small void in the groove is apparent between this ligand and the DNA.
DISCUSSION
The three symmetric minor-groove binding compounds studied here have the same central head-to-head bis-benzimidazole structural motif substituted with polar side chains, neutral, in the case of compound 2, or cationic (compounds 1 and 3). These compounds, which easily penetrate into cells to accumulate in the nucleus (A. Lansiaux and C. Bailly, unpublished data), represent a novel family of DNA-targeted potential anticancer agents. Compound 1 has shown potent cytotoxic activity against a panel of human tumor cell lines. It is, for example, highly toxic to cisplatin-resistant ovarian carcinoma A2780cisR cells (IC50 = 115 nM), whereas Hoechst 33258 showed practically no cell growth inhibitory effect (38). It is notable that the DNA affinities of the three molecules studied here parallel their cytotoxicities in a panel of human tumor cell lines (C. Bailly and C. Tardy, unpublished observations). It is therefore important to clarify the mode of action of these symmetric compounds. A detailed understanding of the affinity, sequence specificity and mode of binding to DNA of the lead compound 1 is an essential step in the rational design of further analogs.
The footprinting methodology is most appropriate to delineate the sequence selectivity of these compounds. DNase I is a simple enzymatic tool for identifying and differentiating the sites of reversible (equilibrium) binding of drugs to DNA molecules (43). Here we have used this method to characterize a number of AT-rich binding sites for compound 1. On the other hand, the SPR technique is a powerful method for estimating the magnitude of ligand–DNA binding as well as for measuring the kinetic parameters of these interactions (at least for water-soluble compounds) (44). This is one of the rare studies where SPR has been used to quantify both the DNA affinity and kinetics of binding of small molecules to different DNA sequences. The work presented here, together with our recent studies on the DNA intercalator antibiotic AT2433-B1 (45) and the berenil-type minor-groove binder CGP40215A (46), illustrates how the use of these two complementary approaches can serve to characterize new DNA targeting and interaction modes with increased specificity and affinity (47).
The molecular basis for the finding of superior affinity and AT selectivity for compound 1 was initially puzzling, but has now been clarified by molecular dynamics simulations and calculations of relative binding energies using explicit solvent contributions. The role of water in stabilizing minor-groove structure is now well established, with the authentication of the structured spine of hydration in B-form DNA by X-ray crystallography, NMR and simulation methods. An active role for water molecules has been visualized in some crystallographic studies of minor-groove ligand complexes, such as that with berenil (48), where a water molecule mediates between a terminal amidinium group of berenil and base-pair edges. Water molecules acting as a molecular bridges between ligands and DNA have been found in several other instances, with DNA intercalators (49), DNA minor-groove binders (46,48) as well as with protein–DNA complexes such as that with Hin recombinase (50). The design of ligands with enhanced DNA affinity rarely takes the role of water molecules into account, but this study suggests that it is appropriate to do so. The hydrogen bond acceptor heteroatoms in the para position of the terminal phenyl rings of compound 1 are key elements in stabilizing and exploiting DNA-bound water molecules. Despite the presence of external cationic side chains, compound 3 is not able to maintain close contacts within the DNA minor-groove crevice, clearly because it lacks the critical phenoxy groups, which are acting as molecular ‘suckers’, trapping water molecules on the DNA surface. In future drug design in this series, it may be useful to consider substituting the oxypropyl side chain or the phenyl rings of compound 1 with hydroxyl groups directly, so as to mimic a hydration layer between the drug and the DNA surface. Alternatively, the location of a water molecule bridging the phenoxy group of compound 1 and the O2 position of guanine suggests that this type of compound may be useful in the recognition of 2-hydroxy-2′-deoxyadenosine residues, arising from the radical oxidation of DNA and as a biological marker of the Fenton reaction (51).
Acknowledgments
ACKNOWLEDGEMENTS
We thank the IMPRT (IFR114) for access to the BIAcore 3000 instrumentation, and Farial Tanious for assistance in the preparation of the sensor chips used in these studies. This work was supported by grants (to W.D.W.) from the National Institutes of Health, (to C.B.) from the Ligue Nationale Contre le Cancer (Equipe labellisée) and (to S.N.) from Cancer Research UK and the European Union. W.D.W. was the recipient of an INSERM ‘Poste Orange’ fellowship. C.C. has been supported by a Marie Curie Fellowship of the European Community Programme ‘Improving Human Research Potential and the Socio-economic Knowledge Base’ under contract number HPMFCT-2000-00701.
REFERENCES
- 1.Bailly C. and Chaires,J.B. (1998) Design of sequence-specific DNA minor groove binders. Netropsin and distamycin analogues. Bioconjug. Chem., 9, 513–538. [DOI] [PubMed] [Google Scholar]
- 2.Neidle S. (2001) DNA minor-groove recognition by small molecules. Natural Products Rep., 18, 291–309. [DOI] [PubMed] [Google Scholar]
- 3.Dervan P.B. and Bürli, RW. (1999) Sequence-specific DNA recognition by polyamides. Curr. Opin. Chem. Biol., 3, 688–693 [DOI] [PubMed] [Google Scholar]
- 4.Dervan P.B. (2001) Molecular recognition of DNA by small molecules. Bioorg. Med. Chem., 9, 2215–2235. [DOI] [PubMed] [Google Scholar]
- 5.Gong B. and Yan,Y. (1997) New DNA minor-groove binding molecules with high sequence-selectivities and binding affinities. Biochem. Biophys. Res. Commun., 240, 557–560. [DOI] [PubMed] [Google Scholar]
- 6.Hawkins C.A., Watson,C., Yan,Y., Gong,B. and Wemmer,D.E. (2001) Structural analysis of the binding modes of minor groove ligands comprised of disubstituted benzenes. Nucleic Acids Res., 29, 936–942. [DOI] [PMC free article] [PubMed] [Google Scholar]
- 7.Stephens C.E., Tanious,F.A., Kim,S., Wilson,W.D., Schell,W., Perfect,J., Franzblau,S. and Boykin,D.W. (2001) Diguanidino and ‘reversed’ diamidino 2,5-diarylfurans as antimicrobial agents. J. Med. Chem., 44, 1741–1748. [DOI] [PubMed] [Google Scholar]
- 8.Wilson W.D., Tanious,F.A., Ding,D., Kumar,A., Boykin,D.W., Colson,P., Houssier,C. and Bailly,C. (1998) Nucleic acid interactions of unfused aromatic cations: evaluation of proposed minor-groove, major-groove and intercalation binding modes. J. Am. Chem. Soc., 120, 10310–10321. [Google Scholar]
- 9.Mazur S., Tanious,F.A., Ding,D., Kumar,A., Boykin,D.W., Simpson,I.J., Neidle,S. and Wilson,W.D. (2000) A thermodynamic and structural analysis of DNA minor groove complex formation. J. Mol. Biol., 300, 321–337. [DOI] [PubMed] [Google Scholar]
- 10.Tanious F.A., Ding,D., Patrick,D.A., Tidwell,R.R. and Wilson,W.D. (1997) A new type of DNA minor groove complex: carbazole dication–DNA interactions. Biochemistry, 36, 15315–15325. [DOI] [PubMed] [Google Scholar]
- 11.Reddy B.S.P., Sondhi,S.M. and Lown,J.W. (1999) Synthetic DNA minor groove-binding drugs. Pharmacol. Ther., 84, 1–111. [DOI] [PubMed] [Google Scholar]
- 12.Pjura P.E., Grzeskoniak,K. and Dickerson,R.E. (1987) Binding of Hoechst 33258 to the minor groove of B-DNA. J. Mol. Biol., 197, 257–271. [DOI] [PubMed] [Google Scholar]
- 13.Teng M.-K., Usman,N., Frederick,C.A. and Wang,A.H.-J. (1988) The molecular structure of the complex of Hoechst 33258 and the DNA dodecamer d(CGCGAATTCGCG). Nucleic Acids Res., 16, 2671–2690. [DOI] [PMC free article] [PubMed] [Google Scholar]
- 14.Carrondo M.A.A. de C.T., Coll,M., Aymami,J., Wang,A.H.-J., Van der Marel,G.A., Van Boom,J.H. and Rich,A. (1989) Binding of a Hoechst dye to d(CGCGATATCGCG) and its influence on the conformation of the DNA fragment. Biochemistry, 28, 7849–7859. [DOI] [PubMed] [Google Scholar]
- 15.Parkinson J.A., Barber,J., Douglas,K.T., Rosamond,J. and Sharples,D. (1990) Minor-groove recognition of the self complementary duplex d(CGCGAATTCGCG)2 by Hoechst 33258: a high-field NMR study. Biochemistry, 29, 10181–10190. [DOI] [PubMed] [Google Scholar]
- 16.Searle M.S. and Embrey,K.J. (1990) Sequence-specific interaction of Hoechst 33258 with the minor groove of an adenine-tract DNA duplex studied in solution by 1H NMR spectroscopy. Nucleic Acids Res., 18, 3753–3762. [DOI] [PMC free article] [PubMed] [Google Scholar]
- 17.Quintana J.R., Lipanov,A.A. and Dickerson,R.E. (1991) Low-temperature crystallographic analyses of the binding of Hoechst 33258 to the double-helical DNA dodecamer CGCGAATTCGCG. Biochemistry, 30, 10294–10306. [DOI] [PubMed] [Google Scholar]
- 18.Sriram M., van der Marel,G.A., Roelen,H.L.P.F., van Boom,J.H. and Wang,A.H.-J. (1992) Conformation of B-DNA containing O6-ethyl-G-C base pairs stabilized by minor groove binding drugs: molecular structure of d(CGC[e6G]AATTCGCG) complexed with Hoechst 33258 or Hoechst 33342. EMBO J., 11, 225–232 [DOI] [PMC free article] [PubMed] [Google Scholar]
- 19.Fede A., Billeter,M., Leupin,W. and Wüthrich,K. (1993) Determination of the NMR solution structure of the Hoechst 33258-d(GTGGAATTCCAC)2 complex and comparison with the X-ray crystal structure. Structure, 1, 177–186. [DOI] [PubMed] [Google Scholar]
- 20.Fede A., Labhardt,A., Bannwarth,W. and Leupin,W. (1991) Dynamics and binding mode of Hoechst 33258 to d(GTGGAATTCCAC)2 in the 1:1 solution complex as determined by two-dimensional 1H NMR. Biochemistry, 30, 11377–11388. [DOI] [PubMed] [Google Scholar]
- 21.Embrey K.J., Searle,M.S. and Craik,D.J. (1993) Interaction of Hoechst 33258 with the minor groove of the A+T-rich DNA duplex d(GGTAATTACC)2 studied in solution by NMR spectroscopy. Eur. J. Biochem., 211, 437–447 [DOI] [PubMed] [Google Scholar]
- 22.Spink N., Brown,D.G., Skelly,J.V. and Neidle,S. (1994) Sequence-dependent effects in drug–DNA interaction: the crystal structure of Hoechst 33258 bound to the d(CGCAAATTTGCG)2 duplex. Nucleic Acids Res., 22, 1607–1612. [DOI] [PMC free article] [PubMed] [Google Scholar]
- 23.Vega M.C., Garcia Saez,I., Aymami,J., Eritja,R., Van der Marel,G.A., van Boom,J.H., Rich,A. and Coll,M. (1994) The three-dimensional crystal structure of the A-tract DNA dodecamer d(CGCAAATTTGCG) complexed with the minor-groove-binding drug Hoechst 33258. Eur. J. Biochem., 222, 721–726. [DOI] [PubMed] [Google Scholar]
- 24.Czarny A., Boykin,D.W., Wood,A.A., Nunn,C.M., Neidle,S., Zhao,M. and Wilson,W.D. (1995) Analysis of van der Waals and electrostatic contributions in the interactions of minor groove binding benzimidazoles with DNA. J. Am. Chem. Soc., 117, 4716–4717. [Google Scholar]
- 25.Haq I., Ladbury,J.E., Chowdhry,B.Z., Jenkins,T.C. and Chaires,J.B. (1997) Specific binding of Hoechst 33258 to the d(CGCAAATTTGCG)2 duplex: calorimetric and spectroscopic studies. J. Mol. Biol., 271, 244–257. [DOI] [PubMed] [Google Scholar]
- 26.Drobyshev A.L., Zasedatelev,A.S., Yershov,G.M. and Mirzabekov,A.D. (1999) Massive parallel analysis of DNA-Hoechst 33258 binding specificity with a generic oligodeoxyribonucleotide microchip. Nucleic Acids Res., 27, 4100–4105. [DOI] [PMC free article] [PubMed] [Google Scholar]
- 27.Rao K.E. and Lown,J.W. (1991) Molecular recognition between ligands and nucleic acids: DNA binding characteristics of analogues of Hoechst 33258 designed to exhibit altered base and sequence recognition. Chem. Res. Toxicol., 4, 661–669. [DOI] [PubMed] [Google Scholar]
- 28.Kumar S., Joseph,T., Singh,M.P., Bathini,Y. and Lown,J.W. (1992) Sequence specific molecular recognition and binding by a GC recognizing Hoechst 33258 analogue to the decadeoxyribonucleotide d-[CATGGCCATG]2: structural and dynamic aspects deduced from high field 1H-NMR studies. J. Biomol. Struct. Dyn., 8, 331–357. [DOI] [PubMed] [Google Scholar]
- 29.Parkinson J.A., Barber,J., Douglas,K.T., Rosamond,J. and Sharples,D. (1994) Molecular design of DNA-directed ligands with specific interactions: solution NMR studies of the interaction of a m-hydroxy analogue of Hoechst 33258 with d(CGCGAATTCGCG)2. Biochemistry, 33, 8442–8452. [DOI] [PubMed] [Google Scholar]
- 30.Clark G.R., Gray,E.J., Neidle,S., Li,Y.-H. and Leupin,W. (1996) Isohelicity and phasing in drug-DNA sequence-recognition: crystal structure of a tris(benzimidazole)-oligonucleotide complex. Biochemistry, 35, 13745–13752. [DOI] [PubMed] [Google Scholar]
- 31.Clark G.R., Squire,C.J., Gray,E.J., Leupin,W. and Neidle,S. (1996) Designer DNA-binding drugs: the crystal structure of a meta-hydroxy analogue of Hoechst 33258 bound to d(CGCGAATTCGCG)2. Nucleic Acids Res., 24, 4882–4889. [DOI] [PMC free article] [PubMed] [Google Scholar]
- 32.Pilch D.S., Xu,Z., Sun,Q., LaVoie,E., Liu,L.F. and Breslauer,K.J. (1997) A terbenzimidazole that preferentially binds and conformationally alters structurally distinct DNA duplex domains: a potential mechanism for topoisomerase I poisoning. Proc. Natl Acad. Sci. USA, 94, 13565–13570 [DOI] [PMC free article] [PubMed] [Google Scholar]
- 33.Wood A.A., Nunn,C.M., Czarny,A., Boykin,D.W. and Neidle,S. (1995) Variability in DNA minor groove width recognised by ligand binding: the crystal structure of a bis-benzimidazole compound bound to the DNA duplex d(CGCGAATTCGCG)2. Nucleic Acids Res., 23, 3678–3684. [DOI] [PMC free article] [PubMed] [Google Scholar]
- 34.Aymami J., Nunn,C.M. and Neidle,S. (1999) DNA minor-groove recognition of a tris-benzimidazole drug by a non-self-complementary AT-rich sequence. Nucleic Acids Res., 27, 2691–2698. [DOI] [PMC free article] [PubMed] [Google Scholar]
- 35.Bathini Y., Rao,K.E., Shea,R.G. and Lown,J.W. (1990) Molecular recognition between ligands and nucleic acids: novel pyridine- and benzoxazole-containing agents related to Hoechst 33258 that exhibit altered DNA sequence specificity deduced from footprinting and spectroscopic studies. Chem. Res. Toxicol., 3, 268–280. [DOI] [PubMed] [Google Scholar]
- 36.Clark G.R., Boykin,D.W., Czarny,A. and Neidle,S. (1997) Structure of a bis-amidinium derivative of Hoechst 33258 complexed to dodecanucleotide d(CGCGAATTCGCG)2: the role of hydrogen bonding in minor groove drug–DNA recognition. Nucleic Acids Res., 25, 1510–1515. [DOI] [PMC free article] [PubMed] [Google Scholar]
- 37.Bostock-Smith C.E., Embrey,K.J. and Searle,M.S. (1998) DNA minor groove recognition by a tetrahydropyrimidinium analogue of Hoechst 33258: NMR and molecular dynamics studies of the complex with d(GGTAATTACC)2. Nucleic Acids Res., 26, 1660–1667. [DOI] [PMC free article] [PubMed] [Google Scholar]
- 38.Mann J., Baron,A., Opoku-Boahen,Y., Johansson,E., Parkinson,G., Kelland,L.R. and Neidle,S. (2001) A new class of symmetric bisbenzimidazole-based DNA minor groove-binding agents showing antitumor activity. J. Med. Chem., 44, 138–144. [DOI] [PubMed] [Google Scholar]
- 39.Bailly C. Tardy,C., Wang L., Armitage B., Hopkins K., Kumar A., Schuster G.B., Boykin D.W. and Wilson W.D. (2001) Recognition of ATGA sequences by the unfused aromatic dication DB293 forming stacked dimers in the DNA minor groove. Biochemistry, 40, 9770–9779. [DOI] [PubMed] [Google Scholar]
- 40.Davis T.M. and Wilson,W.D. (2000) Determination of the refractive index increments of small molecules for correction of surface plasmon resonance data. Anal. Biochem., 284, 348–353. [DOI] [PubMed] [Google Scholar]
- 41.Ryckaert J.P., Ciccotti,G. and Berendsen,H.J.C. (1977) Numerical integration of the cartesian equations of motion of a system with constraints: Molecular dynamics of n-alkanes. J. Comput. Phys., 23, 327–341. [Google Scholar]
- 42.Read M.A., Wood,A.A., Harrison,J.R., Gowan,S.M., Kelland,L.R., Dosanjh,H.S. and Neidle,S. (1999) Molecular modeling studies on G-quadruplex complexes of telomerase inhibitors: structure–activity relationships. J. Med. Chem., 42, 4538–4546. [DOI] [PubMed] [Google Scholar]
- 43.Fox K.R. and Waring,M.J. (2001) High-resolution footprinting studies of drug-DNA complexes using chemical and enzymatic probes. Methods Enzymol., 340, 412–430. [DOI] [PubMed] [Google Scholar]
- 44.Wilson W.D. (2002) Analyzing biomolecular interactions. Science, 295, 2103–2105. [DOI] [PubMed] [Google Scholar]
- 45.Carrasco C., Facompré,M., Chisholm,J.D., Van Vranken,D.L., Wilson,W.D. and Bailly,C. (2002) DNA sequence recognition by the indolocarbazole antitumor antibiotic AT2433-B1 and its diastereoisomer. Nucleic Acids Res., 30, 1774–1781. [DOI] [PMC free article] [PubMed] [Google Scholar]
- 46.Ngyen B., Lee,M.P.H., Hamelberg,D., Joubert,A., Bailly,C., Brun,R., Neidle,S. and Wilson,W.D. (2002) Strong binding in the DNA minor groove by an aromatic diamidine with a shape that does not match the curvature of the groove. J. Am. Chem. Soc., 124, 13680–13681. [DOI] [PubMed] [Google Scholar]
- 47.Wilson W.D., Wang,L., Tanious,F., Kumar,A., Boykin,D.W., Carrasco,C. and Bailly,C. (2001) BIAcore and DNA footprinting for discovery and development of new DNA targeted therapeutics and reagents. BIAcore J., 1, 15–19. [Google Scholar]
- 48.Brown D.G., Sanderson,M.R., Skelly,J.V., Jenkins,T.C., Brown,T., Garman,E., Stuart,D.I. and Neidle,S. (1990) Crystal structure of a berenil-dodecanucleotide complex: the role of water in sequence-specific ligand binding. EMBO J., 9, 1329–1334. [DOI] [PMC free article] [PubMed] [Google Scholar]
- 49.Williams H.E. and Searle,M.S. (1999) Structure, dynamics and hydration of the nogalamycin-d(ATGCAT)2 complex determined by NMR and molecular dynamics simulations in solution. J. Mol. Biol., 290, 699–716. [DOI] [PubMed] [Google Scholar]
- 50.Chiu T.K., Sohn,C., Dickerson,R.E. and Johnson,R.C. (2002) Testing water-mediated DNA recognition by the Hin recombinase. EMBO J., 21, 801–814. [DOI] [PMC free article] [PubMed] [Google Scholar]
- 51.Frelon S., Douki,T. and Cadet,J. (2002) Radical oxidation of the adenine moiety of nucleoside and DNA: 2-hydroxy-2′-deoxyadenosine is a minor decomposition product. Free Radic. Res., 36, 499–508. [DOI] [PubMed] [Google Scholar]


