

Abstract
By using single-molecule multiparameter fluorescence detection, fluorescence resonance energy transfer experiments, and newly developed data analysis methods, this study demonstrates directly the existence of three structurally distinct forms of reverse transcriptase (RT):nucleic acid complexes in solution. Single-molecule multiparameter fluorescence detection also provides first information on the structure of a complex not observed by x-ray crystallography. This species did not incorporate nucleotides and is structurally distinct from the other two observed species. We determined that the nucleic acid substrate is bound at a site far removed from the nucleic acid-binding tract observed by crystallography. In contrast, the other two states are identified as being similar to the x-ray crystal structure and represent distinct enzymatically productive stages in DNA polymerization. These species differ by only a 5-Å shift in the position of the nucleic acid. Addition of nucleoside triphosphate or of inorganic pyrophosphate allowed us to assign them as the educt and product state in the polymerization reaction cycle; i.e., the educt state is a complex in which the nucleic acid is positioned to allow nucleotide incorporation. The second RT:nucleic acid complex is the product state, which is formed immediately after nucleotide incorporation, but before RT translates to the next nucleotide.
HIV-1 reverse transcriptase (RT) is a key enzyme in the life cycle of HIV. This multifunctional enzyme is responsible for the complex process of transcribing viral RNA into double-stranded DNA for integration into the host cell genome. The enzyme is a heterodimer composed of subunits which share a common N terminus and have subdomains referred to as fingers, palm, thumb, and connection (Fig. 1). Although the subdomains of each subunit are structurally similar, the overall folding within the two subunits is quite different (1). The large subunit, p66, contains RNA- and DNA-dependent DNA polymerase as well as RNase H activities. The p51 subunit, which is inactive in the heterodimer but active in homodimers (2, 3), is thought to play a role in stabilizing the conformation of p66.
Figure 1.
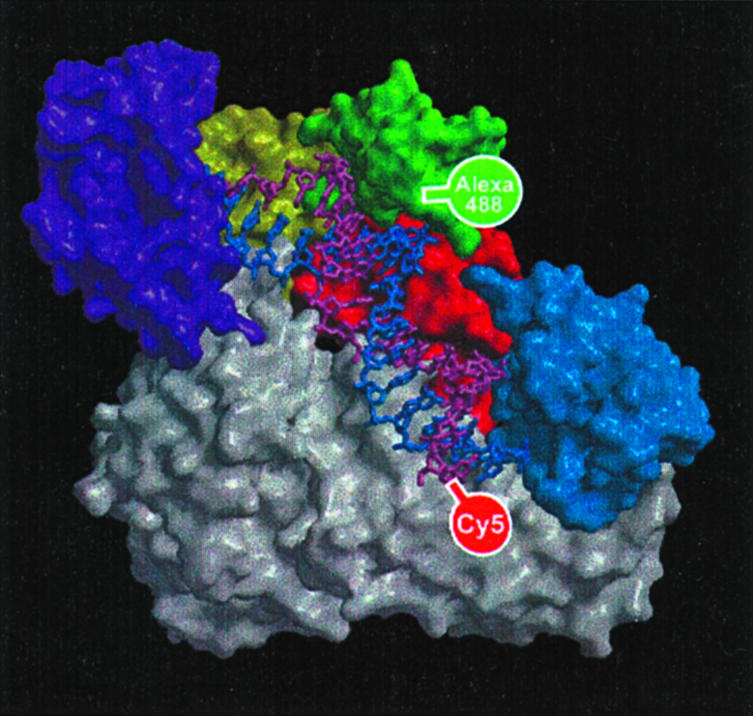
Crystal structure of the RT:dp/dt complex. The protein is displayed as a molecular surface. The different regions of p66 are colored as follows: fingers, purple; palm, yellow; thumb, green; connection, red; and RNase H domain, blue; whereas p51 is colored gray. The nucleic acid substrate is shown as a stick representation with the primer colored purple and the template colored blue. The positions of the labels are shown: the donor dye (Alexa488) is attached at the protein and the acceptor dye (Cy5) is attached at the 5′ end of the primer.
Crystallographic studies of RT:nucleic acid primer/template (p/t) complexes have provided valuable insights into the structural features and conformational changes induced by p/t binding (1, 4–7). To date, these crystallographic models have indicated a single p/t-binding mode. In contrast, recent solution-based kinetic studies on p/t binding and nucleotide incorporation by RT suggest a heterogeneous mixture of several different binding modes (8). To confirm directly the existence of several species, and to obtain structural and functional information about each, we have used single-molecule spectroscopy to investigate RT:p/t complexes in solution.
Single-molecule techniques have proven to be valuable tools for resolving static and dynamic heterogeneity of an ensemble (9–13). For this investigation, we use a newly developed multiparameter fluorescence detection (MFD) technique. MFD is characterized by the simultaneous and independent acquisition of fluorescence intensity (F), lifetime (τ) and anisotropy (r) as a function of time (t) in two spectral windows (λ) on a molecule-by-molecule basis (9). The spectroscopic information can be used to classify molecules into the different subpopulations that compose an ensemble and to characterize their size, identity, diffusion times, or local environment. The use of multiple, simultaneously acquired parameters improves the resolution of distinct species significantly (14, 15).
To obtain structural information at the single-molecule level, spectroscopic techniques can be combined with fluorescence resonance energy transfer (FRET). In FRET, the energy from an excited donor dye, D, is nonradiatively transferred to an acceptor dye, A. The transfer depends strongly on the separation distance and provides a tool for measuring distances in the range of 20–100 Å (16). Single molecule FRET has been successfully applied to monitor conformational changes of immobilized ribozymes and proteins (13, 17–22). However, quantitative analyses are difficult to perform because FRET depends not only on distance, but on several time-varying parameters such as molecular orientations, dye quenching, or dye bleaching.
To provide the high resolution necessary to distinguish between structurally similar species, FRET experiments were performed by using the MFD technique, which accounts for inhomogeneous broadening due to local effects such as quenching, orientation, and bleaching.
It is important to note that the two reporter dyes represent, in effect, two degrees of freedom. Thus, only two-dimensional analysis with independent parameters can separate globally correlated FRET effects from individual dye effects. One possibility provided by MFD is to use the donor fluorescence lifetime and the measured intensity ratio of donor and acceptor signal, FD/FA. In the study presented here, these techniques are used to determine the number of RT:p/t complexes which occur and to characterize their structural properties.
Materials and Methods
We used an RT mutant containing a single accessible cysteine at position 287 (see Fig. 1) of the p66 subunit (23). This cysteine, situated within the thumb subdomain of p66, was labeled with the green donor fluorophore Alexa488-C5 maleimide (24). The red acceptor dye Cy5-N-hydroxysuccinimide ester was attached via a C6-aminolink to the 5′ end of the primer strand of a 19/35 DNA/DNA primer/template, a construct referred to as Cy5-[5′-DNA primer/DNA template (dp/dt)]. The sequence of the primer/template is based on the HIV-1 viral primer binding site. The primer sequence is 5′-d(TTG TCC CTG TTC GGG CGC C)-3′ and the template sequence is 5′-d(GGG TTT GCT AAC CAT AGG CGC CCG AAC AGG GAC AA)-3′. In the case of the terminated primer, the 3′ cytosine was replaced by a dideoxy-cytosine, and the corresponding p/t is referred to as d_dp/dt.
The Cy5-(5′-dp/dt) construct was designed such that the distance between the residue at position 287 and the 5′ end of the primer was expected to be ≈40 Å, based on previously published crystallographic structures (6). This distance is close to the Förster radius, R0, of 49 Å for Alexa488-Cy5, which is a prerequisite for accurate distance calculations.
The aqueous measurement buffer contained 10 mM KCl, 50 mM Tris⋅HCl, pH 7.8, 6 mM MgCl2, and 400 μM ascorbic acid. Because of the extremely low concentrations used in single-molecule studies (50 pM RT and 200 pM dp/dt), high binding affinities are required to ensure stable complex formation. By reducing the KCl concentration from the 50 mM used in previous studies on this system (8) to 10 mM, we were able to reduce the dissociation constant, Kd, dramatically. Data from classical ensemble titrations indicated an upper limit for the Kd value at this salt concentration of <100 pM. The actual single molecule measurements confirmed that the affinity was high enough to ensure complex formation, because most RT molecules sampled contained bound (labeled) substrate. Ensemble measurements on single nucleotide incorporation under these salt conditions showed similar kinetic behavior to that seen at higher salt, with three kinetic phases being observed (8).
Before measurements, a “stock” complex solution was made at a concentration of 250 nM protein and 1 μM dp/dt. This solution was equilibrated on ice for at least 30 min. Immediately before a measurement, the stock solution was diluted rapidly into the measurement buffer 1:10, followed by a further 1:10 dilution before a final 1:50 dilution to a final concentration of 50 pM protein and 200 pM dp/dt. A droplet of the sample solution (50 μl) was applied to a coverslip which formed the bottom of a closed chamber with a water-saturated atmosphere. Coating the coverslip with κ-casein led to complete suppression of adsorption of the sample molecules during the measurement time of up to an hour.
Multiparameter Fluorescence Detection.
sMFD is performed by using a confocal (pinhole diameter = 100 μm) epi-illuminated microscope with excitation by a pulsed linearly polarized argon-ion laser at 496 nm. The laser is focused into the solution with a 60 × 1.2 water immersion objective. Fluorescence detection is performed with the same objective, but with an additional pinhole, resulting in a detection volume of 2 fl, as estimated from fluorescence correlation spectroscopy (FCS) measurements. Further set-up parameters obtained via FCS are the ratio ω0/z0 of 4, and the characteristic diffusion times tD for Rhodamine 110 and Alexa488-K287C of 0.3 and 1.3 ms, respectively. Here, ω0 and z0 are the distances from the center of the laser beam focus in the radial and axial directions, respectively, at which the collected fluorescence intensity has dropped by a factor of e2, compared with its peak value. Sample molecules diffusing freely through the solution occasionally pass through the detection volume, resulting in a brief (≈1 ms) burst of fluorescence. Dilute solutions of molecules (≈50 pM) ensure that only single molecules are detected, each molecule producing a single burst. The fluorescence signal is divided into parallel and perpendicular components in wavelength ranges below and above 620 nm (green and red, respectively; filters: HQ535/50, HQ730/140). The photons are detected by four avalanche photodiodes coupled to a counting board (SPC 431, Becker & Hickel, Berlin) and a personal computer. For each photon, the arrival time after the laser pulse, the time since the last photon, the polarization, and the wavelength are recorded. Fluorescence bursts are distinguished from the background signal of 1–2 kHz by applying certain threshold intensity criteria (9).
FRET-Analysis Techniques.
FRET occurs between two dyes when the emission spectrum of an excited donor fluorophore overlaps the absorption spectrum of a nearby acceptor fluorophore. The efficiency, E, of FRET depends strongly on the dye separation [donor-acceptor distance (RDA)]:
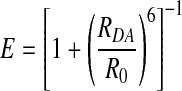 |
1 |
R0 is a DA-pair-specific constant known as the Förster radius and depends on the spectral overlap integral between D and A, J(λ), the donor fluorescence quantum yield, ΦFD, the refractive index, n, and the geometric factor, κ2, which accounts for the steady state relative dipole orientation between D and A: R0 = 9780(λ)⋅h2⋅n−4·ΦFD.
E can be calculated by two methods: (i) either by measuring the corrected donor and acceptor fluorescence intensities, FD and FA, or (ii) by the donor lifetimes in the presence and absence of an acceptor, τD(A) and τD(0).
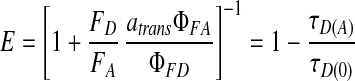 |
2 |
For intensity measurements, the fluorescence quantum yields of the acceptor, ΦFA, and donor, ΦFD, must be known (0.40 and 0.63 respectively for these experiments), and the factor atrans (=0.80 for Cy5) has been introduced to account for the fraction of the acceptor dye in a fluorescent trans conformation (25).
Detailed analysis of the fluorescence decay of the subensemble of FRET-active molecules indicated fluorescence quenching of the donor dye resulting in a double exponential fluorescence decay with the fluorescence lifetimes, τDN, and species amplitudes, xDN (τD1 = 4.27 ns, xD1 = 0.56, and τD2 = 1.11 ns, xD2 = 0.44). Quenching does not perturb the FRET process as expressed by the “reduced Förster radius,” R0r defined below in 4; however, this competing process must be taken into account for the calculation of the appropriate FRET-parameters (26). Knowing that the maximum-likelihood estimator used for the calculation of single-molecule fluorescence decay data gives results that are close to a fluorescence-weighted average fluorescence lifetime, we developed a correction procedure to compute the fluorescence lifetime of the donor not perturbed by reversible quenching. Because correlation analysis and sMFD indicate that the fluctuations occur in the submillisecond time range, it is justified to use the species-weighted average fluorescence lifetimes, τ̄D(0) and τ̄D(A), as the appropriate variables in the calculations of the FRET-efficiency. Therefore, a polynomial correction function was generated by simulating FRET to obtain the quadratic correction factors of a = −0.5330, b = 0.9583, and c = 0.0139 (see Supporting Text, which is published as supporting information on the PNAS web site, www.pnas.org). These values were used to rescale all experimentally determined lifetimes values to their photophysically meaningful ones.
The signal intensities, SG and SR, are calculated by dividing the number of photons by the burst duration. FD and FA are determined from SG and SR by correcting for the background counts, BG and BR, detection efficiencies, gG and gR, and spectral crosstalk, α.
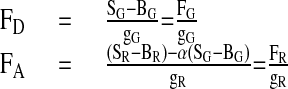 |
3 |
Combining 1 and 2, we obtain the separation of two dyes as a function of their intensities:
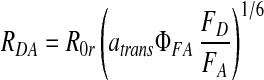 |
4 |
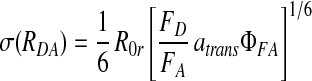
We define R0r (= 53 Å) as the “reduced Förster radius,” which differs from R0 by being independent of ΦFD: R0r = 9780⋅[J(λ)⋅κ2⋅n−4](1/6). The detection efficiencies always appear together as the ratio gG/gR, which is measured for each experiment and typically has a value of 0.52. The distribution in calculated ranges is dominated by the shot noise in the photon counting, and therefore follows Poisson statistics. By following error propagation rules, RDA will have a Gaussian distribution, with an SD, σ, explicitly given by:
 |
5 |
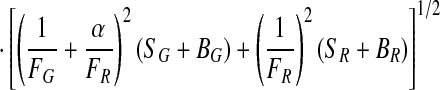 |
Quantitative formulae are provided by 4 and 5 for determining the separation between two dyes based on intensity measurements. For 4 and 5, we assumed κ2 to be 2/3. The validity of this assumption is explicitly checked by measuring the species-selective anisotropies. The value for σ must be calculated from photon counts, not count rates, as suggested in 5. In our case, the photon flux varies in the bursts, being averaged on the millisecond time scale seen by FCS. Therefore, we use the values measured for the count rates, in kHz, as average photon counts in 5. Empirical evidence available from a variety of experiments suggests that this use of the measured count rates to calculate σ is accurate.
The fluorescence lifetime is determined for each burst in two steps: (i) by generating a histogram of the photon arrival times, and (ii) by fitting the histograms to a single exponential by using a maximum-likelihood estimator and iterative convolutions to account for the scatter contribution (9, 27). From 1 and 2, the relationship between the fitted τ̄D(A) values and RDA can be determined.
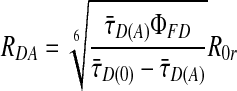 |
6 |
We use the average lifetime value τ̄D(0) = 3.1 ns. The stepwise correction of the data for background and lifetime is shown in Fig. 5, which is published as supporting information on the PNAS web site.
Assuming mobile donor and acceptor dyes, the combination of the accuracy of lifetime measurements and the precision of intensity measurements via sMFD advances FRET as a tool to measure not only relative but also absolute distances. In addition, plotting RDA vs. τ̄D(A) reveals complementary information about the existence of multiple dye states.
For R0, a value for the orientation factor κ2 is required. If the dyes are known to be rotationally mobile over the lifetime of the excited state, it is possible to use the value 2/3 obtained by integrating over all of the possible orientations. The mobility of the donor dye is described by the rotational correlation time, ρD, which can be determined indirectly from the donor dye's anisotropy, rD. Anisotropy is the degree of polarization in the fluorescent signal and depends upon ρD, τ̄D(A), and the initial anisotropy, r0 = 0.375, as shown in the Perrin equation:
 |
7 |
MFD records the polarization of each photon, enabling us to determine r for each molecule. This method has been described in detail (27). Briefly, the steady-state anisotropy is calculated for each burst, correcting for scattered light, changes in polarization due to the optical components, and the different detection efficiencies of parallel and perpendicular photons (G factor).
Results and Discussion
Investigating the complexes formed between donor-labeled RT and acceptor-labeled Cy5-(5′-dp/dt) by sMFD, Fig. 2 shows the use of multidimensional information in diagrams of the donor lifetime in the presence of acceptor, τ̄D(A), vs. donor-acceptor distance, RDA, (Fig. 2 Upper) and donor anisotropy, rD, (Fig. 2 Lower). The number of molecules (fluorescence bursts) in each bin are gray-scale coded from white (lowest) to black (highest). The corresponding 1D-histograms are given as projections. The data for RT:Cy5-(5′-dp/dt) complexes (Fig. 2A) from several measurements readily show that we are able to resolve three distinct RT:dp/dt complexes, designated as Ia, Ib, and II.
Figure 2.

Quantitative single-molecule multiparameter FRET analysis. (Upper) The “species weighted” average lifetimes τ̄D(A) are plotted vs. RDA together with an overlayed curve computed by 6 (τ̄D(0) = 3.1 ns, ΦFD = 0.63, R0r = 53 Å). The gray scale indicates an increasing number of bursts. The one-dimensional RDA histograms (magenta color) also display theoretical predictions of single distance distribution profiles (solid lines) and the maximum reasonable RDA value of ≈101 Å for the DA-pair used (dotted lines for donor only species). (Lower) τ̄D(A) is plotted vs. rD together with the overlayed Perrin equation (7) computed for two rotational correlation times ρD (2 and 7 ns). The value 0.375 is used for r0. (A) Donor-labeled RT and Cy5-(5′-dp/dt). Species I is broadly distributed along the line of 6, indicating that it consists of two closely related species (Ia and Ib), which are both mobile and differ slightly in distance, but not in local environment. (B) Donor-labeled RT and unlabeled dp/dt. Only one species is observed, limiting the maximum reasonable value of RDA to 101 Å. (C) Donor-labeled RT and Cy5-(5′-dp/dt) after limited incorporation of four nucleotides. The shifted-species I peak is distributed around a mean distance of 61 Å.
For further analysis, it is very useful to plot the function RDA(τ̄D(A)) (6) on the same graph (magenta sigmoidal line) to distinguish local quenching from FRET-effects. If additional local donor quenching/dequenching exists, then the fitted donor lifetimes will be shorter/longer than the expected τ̄D(A), horizontally shifting those bursts by Δτ̄D(A) (green arrow in Fig. 2B). For local acceptor quenching/dequenching, FA will be changed and, according to 4, the calculated distances will vertically shift up/down by ΔRDA (red arrow). Therefore, any peak that falls on the line given by 6 is not quenched by any other mechanism besides FRET. Correspondingly, we can conclude that movement of peaks along this line is caused by changes in RDA and not by changes in ΦFD or ΦFA that are due to differences in the local environment. It should be noted here that traditional experiments measuring only intensity cannot detect local donor quenching and cannot distinguish between acceptor quenching and distance changes.
The assignment of species Ia and Ib is based on the close proximity of these two species in transfer efficiency. The distribution has a maximum DA distance of 48 Å (Ia) and a pronounced shoulder at smaller distances (Ib). This distance is in close agreement with the expected distances between the labeled bases calculated from the crystal structure (≈40 Å) plus the length of the dye linkages (≈5 Å) (6). The deviation between the actual broad distribution of the RDA and the theoretical distribution predicted by 5 for Poisson (shot noise) distributed intensities (solid line in the 1D RDA histograms) supports the existence of at least two distinct subpopulations that differ only slightly in distance. Furthermore, we can rule out broadening caused by dye quenching, because the distribution of the overlapping peaks follows the theoretical RDA(τ̄D(A)) curve. Species II is characterized by an RDA of ∼87 Å. This distance indicates that the substrate is far from the nucleic acid binding cleft and does not correspond to any previously known structure. The observed distance is slightly smaller than the maximum reasonable value, RDA(Max) ∼ 101 Å (dotted line in the 1D RDA histograms). This value is determined by measuring a sample of donor-labeled RT in complex with unlabeled dp/dt (Fig. 2B). Because there is no acceptor in the donor-only labeled RT:dp/dt complexes, there is no FRET, and subsequently, there should be no red signal. However, background, dark counts, and crosstalk of donor signal still contribute to a mean red signal of 1.4 kHz of “apparent acceptor.” From this signal, we can calculate a noise-limited maximum discernible separation distance for the DA pair used here (therefore, larger distances are shaded in gray). In agreement with the theoretical prediction (dotted line in the 1D RDA histogram), the broadness of the peak is due to the small numbers of red photons in each burst, causing the intensity ratio FD/FA to vary greatly with a change of only a few red photons.
To check whether the differences in RDA observed for the three complexes might be caused by species-specific orientational effects of the dyes, the corresponding histograms of τ̄D(A) vs. rD were analyzed (Fig. 2 Lower). Overlaid are lines calculated from the Perrin equation (7) computed for two fixed rotational correlation times of 7 and 2 ns (blue lines). In Fig. 2A, species Ia and Ib have a broad ρD-distribution of rotational correlation times ranging from 1 to 7 ns and having a center at ≈2 ns, which indicates predominantly high mobility and validates the assumed value of 2/3 for κ2. We suggest that species I contains two or more subspecies with similar positions, representing different steps in the polymerization reaction. The different rotational correlation times indicate different donor dye mobilities, perhaps because of clamping of the finger and thumb domains during polymerase activity. In contrast, the dye mobility in species II is significantly reduced (ρD ∼ 7 ns). Selective time-resolved anisotropy analysis permits estimation of worst-case scenarios of possible DA-distance errors caused by orientational effects. The obtained maximum errors of ± 3 Å for species Ia and Ib and ± 16 Å for species II are too small to explain the observed distance difference of 39 Å (see Fig. 6, which is published as supporting information on the PNAS web site).
Further evidence for the existence of these two different principle classes of RT:dp/dt complexes was obtained by measuring the specific dissociation rates, kd, in a displacement experiment. A 1,000-fold excess of unlabeled dp/dt was added to the solution, and the amount of each species exhibiting specific FRET was followed over time. The fluorescence parameter used to distinguish the species is the ratio of donor to acceptor fluorescence intensity, FD/FA. A time-dependent decrease in both RT:Cy5-(5′-dp/dt) complexes is observed together with a concomitant increase in RT:dp/dt complex containing only donor (Fig. 3). Kinetic analysis provides dissociation rates for species I and II, which differ by a factor of 2: kd(I) = 6.2 ± 0.3 × 10⁻³s−1 and kd(II) = 2.6 ± 0.5 × 10⁻³s−1 (8).
Figure 3.

Dissociation of the acceptor-labeled DNA from the donor-labeled RT. Monitoring three characteristic FD/FA ranges for the species in Fig. 2 [species I: 0.7–3.8; species II: 5.7–14.1; species RT:dp/dt (unlabeled): 19.5–291.7], the number of molecules detected in 25-sec intervals is plotted vs. time after a 1,000-fold excess of unlabeled dp/dt was added to the solution. The number of bursts of species I and II decrease with two different characteristic dissociation rate constants kd (6.2 × 10⁻³ s−1 and 2.6 × 10⁻³ s−1) accompanied by a corresponding increase in the number of molecules of the trapped species (donor-labeled RT with unlabeled DNA).
The activity of RT under single-molecule conditions was examined by performing selective incorporation of four nucleotides, and terminating the chain with a dideoxynucleotide (Fig. 2C). The extension of the primer increases the DA distance and shifts species I to a larger RDA, indicating that this complex is the enzymatically productive one. The measured distance change of 13 Å corresponds with the expected extension of four base pairs of B-DNA. Additionally, ρD is low (2 ns), indicating a mobile dye. The distance for species II remains unchanged in the presence of nucleotides. An interesting feature of experiments in which the primer molecule was extended by four nucleotides (Fig. 2C) is that in contrast to the starting situation (Fig. 2A), the agreement for the end product between the theoretical RDA-Gaussian distribution and the experimental 1D-histogram of species I is excellent. We hypothesize that the broadly distributed species I consists of two different conformations. After termination of the chain with a dideoxy-nucleoside triphosphate, the presence of the next cognate nucleotide in solution stalls the RT:dp/dt complex in a single conformation.
To test the hypothesis that species I consists of two subpopulations, we observed the activity of RT when bound to a preterminated Cy5-(d_dp/dt). In the presence of a 200 μM mixture of all four nucleoside triphosphates [deoxy-nucleoside triphosphates (dNTPs); Fig. 4A], the entire population is shifted into a single, Gaussian-distributed RDA-peak at 51 Å with a high rotational mobility (solid horizontal line). This behavior is analogous to that seen in the extension experiment (Fig. 2C) and probably corresponds to a state in which RT is prepared to accept the dNTP for incorporation, but incorporation is prevented by the terminal dideoxynucleotide. In the presence of 200 μM sodium pyrophosphate, NaPPi, the population is again shifted, but this time toward shorter distances (Fig. 4B, dashed horizontal line). In addition, the RDA-peak is broader than a single Gaussian, and ρD remains high and broadly distributed. As sketched in Fig. 4, we suggest that the first and major complex with a shot-noise limited RDA-distribution, which we refer to as the productive complex in its educt state (Ia: P–E), is capable of facile incorporation of nucleotides at a rate constant of ≈50 s−1, as measured previously (8), and probably corresponds to the structure seen in the x-ray crystallographic analysis of Huang et al. (6). The second complex, species Ib, is characterized by a broad RDA distribution in which the mean distance between the dyes has shortened by ∼5 Å (Fig. 4, black arrows and the dashed and solid lines).
Figure 4.

(A) Addition of 200 μM dNTPs to a complex of RT:d_dp/dt. The τ̄D(A)-RDA histogram shows only species Ia and II. The productive complex (Ia) interacts with the dp/dt in a state closely resembling the known RT:dp/dt structures. Here, the dNTP is thought to occupy a binding site in the polymerization active site and is, therefore, prebound for incorporation into the primer strand (purple). This state is the productive complex in the educt state (P–E). The solid black lines in the histogram at RDA = 51 Å, and below in the cartoon, indicate the position of the dp/dt bound in the P–E state. The p66 subunit is colored light gray, and the p51 subunit is colored dark gray. The polymerase active site of p66 is colored black. The fluorescence dyes Alexa488 and Cy5 are indicated by balloons colored green and red, respectively. In the P–E state, a dNTP occupies the binding pocket. In the one-dimensional RDA histogram, the distribution of species Ia is observed to be shot-noise limited. (B) Addition of 200 μM sodium pyrophosphate (NaPPi) to a complex of RT:d_dp/dt. The presence of PPi moves the peak toward shorter distances by 5 Å, indicated by species Ib. The presence of PPi shifts the primer terminus into the binding pocket, forming the productive complex in the product state, P–P. The dashed black lines in the histogram at 46 Å, and below in the cartoon, indicate the position of the dp/dt bound in the product state, in the presence of the PPi shifting the dp/dt into the binding cleft. The peak is not Gaussian-distributed, and the rotational correlation time, ρD, remains high. The position of species II remains unchanged, indicating a dead end (DE) complex. Preliminary results indicate that the nucleic acid substrate in the DE complex is bound at a site on the p51 subunit, far removed from the nucleic acid-binding tract observed by crystallography. The cartoon indicates a suggested binding orientation for the DE complex.
The corresponding τ̄D(A)-rD diagrams indicate that the mean rotational correlation times of the donor dyes in the two species, ρD(Ia) = 2 ns and ρD(Ib) = 7 ns, differ significantly, which poses the question whether, assuming the same κ2, the calculation of RDA values is justified. Thus, donor and acceptor anisotropy decays were analyzed by selective subensemble spectroscopy of species Ia and Ib (Supporting Text, Section II). For both species, the low rotational correlation time of the acceptor allows us to exclude the possibility that the observed changes are due solely to different κ2 values; instead, they are caused primarily by a difference in distance between the dyes.
The results shown in Fig. 4 are consistent with a model in which the second complex, Ib, must first undergo an isomerization step before nucleotide incorporation can occur and would represent a “slipped” structure in which the dp/dt is bound in the correct orientation but is not correctly positioned in the binding cleft for nucleotide binding (8). An attractive possibility is that the 3′ end of the primer has moved further into the polymerase active site, so that the terminal nucleotide is now occupying the binding site for incoming nucleoside triphosphate. This state is actually the expected state occurring in the polymerization mechanism immediately after nucleotidyl transfer and release of PPi. Therefore, the complex Ib is referred to as a productive complex in its product state, P–P. Before the next nucleotide binding can occur, the primer-template P–P complex has to move to free the active site, i.e., by generating the productive complex in its educt state, Ia, with a larger RDA, as indicated in the sketch of Fig. 4. According to this interpretation, the slower of the two fast phases seen in the nucleotide incorporation kinetics (8) corresponds to this movement, which is an essential step that must occur after nucleotide incorporation and represents the fundamental translocation step in the polymerization reaction. This step seems to be correlated with the previously reported phase occurring at ≈2 s−1 (8), after which binding of the next nucleotide and incorporation occurs at ≈50 s−1, the rate constant of the fastest phase seen in the kinetic experiments (8).
The third complex, species II, seen in Figs. 2 and 4, appears to have a quite different structure, as indicated by a broad RDA distribution peaking at a long DA distance of ≈87 Å. We shall refer to species II as the dead-end complex, DE, because such a complex was originally postulated to explain the slowest kinetic phase observed for single nucleotide incorporation (8). In view of the very different RDA, the failure to incorporate nucleotides rapidly, and specific slower dissociation rates (Fig. 3), we suggest that the DE complex has a completely different configuration to the productive species and, as shown in the earlier kinetic work, that the dp/dt substrate must first dissociate from the enzyme and rebind before incorporation can occur, a process which seems to be very slow under the conditions used here. One suggestion pertaining to its structure which can be made at present is that the simplest conceivable possibility, i.e., that the dp/dt is bound with the wrong polarity, with the blunt end of the double-stranded region instead of the 3′ end of the primer at the polymerase active site, can be excluded, because such a complex would have a high rather than low FRET efficiency.
In future work, a large number of protein mutants with single reactive cysteine residues can be prepared together with dp/dt hybrids labeled in different positions to obtain a sufficiently large number of distance constraints from experiments on RT:dp/dt complexes to allow construction of a structural model. From this work, expect results supporting a binding mode of the primer/template not located in the DNA-binding cleft like the productive complex seen in the x-ray structure. The observed binding should indicate a conformation for the dead-end complex with the substrate bound to the p51 subunit. One possible orientation for DE is shown in Fig. 4. Furthermore, there is an indication for a conformational change of RT compared with the conformation adopted in the productive complex.
It is not yet clear that all three complexes identified are physiologically relevant. For the two productive complexes, probable structures have been assigned, and it is very likely that they represent two complexes occurring in the polymerase mechanism. It is possible that the DE complex identified here and in kinetic studies is not of biological significance, but it is equally possible that it reflects a mode of interaction of RT with its nucleic acid substrate which might be of importance in the complex process of reverse transcription, which involves interaction with a large number of different types of nucleic acid substrates and includes the process of strand transfer (28).
The results reported here demonstrate the power of measuring several fluorescence parameters simultaneously at the single-molecule level. The new two-dimensional FRET analysis removes the problem of broadening caused by local dye quenching and allows for direct DA distance determination with subnanometer spatial resolution. Although the existence of several RT:dp/dt complexes had been inferred indirectly from kinetic experiments, it would not have been possible to obtain direct physical evidence on the nature of the complexes by using ensemble measurements. Future studies of complex assemblies of biological macromolecules, which is one of the most important remaining challenges in biology, will be greatly facilitated by methods of the type described here.
Supplementary Material
Acknowledgments
We thank E. Schweinberger for assistance with the experiments, E. Haustein for analytical software, Michael Hess for help with Fig. 1, and Axel Scheidig for helpful discussions. R.S.G. and C.A.M.S. acknowledge the Volkswagenstiftung. R.S.G. acknowledges the Deutsche Forschungsgemeinschaft (SFB 1524) and the Max Planck Society for financial support. C.A.M.S. acknowledges the Bundesministerium für Bildung, Wissenschaft, Forschung und Technologie (BioFuture Grant 0311865).
Abbreviations
- RT
reverse transcriptase
- p/t
primer/template
- MFD
multiparameter fluorescence detection
- F
fluorescence intensity
- τ
lifetime
- r
anisotropy
- t
time
- λ
spectral windows
- FRET
fluorescence resonance energy transfer
- DE
dead-end complex
- A
acceptor fluorophore
- D
donor fluorophore
- dNTP
deoxy-nucleoside triphosphate
- dp/dt
DNA primer/DNA template
- RDA
donor-acceptor distance
- sMFD
single-molecule MFD
Footnotes
This paper was submitted directly (Track II) to the PNAS office.
References
- 1.Kohlstaedt L A, Wang J, Friedman J M, Rice P A, Steitz T A. Science. 1992;256:1783–1790. doi: 10.1126/science.1377403. [DOI] [PubMed] [Google Scholar]
- 2.Restle T, Müller B, Goody R S. J Biol Chem. 1990;265:8986–8988. [PubMed] [Google Scholar]
- 3.Restle T, Müller B, Goody R S. FEBS Lett. 1992;300:97–100. doi: 10.1016/0014-5793(92)80172-d. [DOI] [PubMed] [Google Scholar]
- 4.Sarafianos S G, Das K, Tantillo C, Clark A D, Ding J, Whithcomb J M, Boyer P L, Hughes S H, Arnold E. EMBO J. 2001;20:1449–1461. doi: 10.1093/emboj/20.6.1449. [DOI] [PMC free article] [PubMed] [Google Scholar]
- 5.Jacobo-Molina A, Ding J, Nanni R G, Clark A D, Lu X, Tantillo C, Williams R L, Kamer G, Ferris A L, Clark P, et al. Proc Natl Acad Sci USA. 1993;90:6320–6324. doi: 10.1073/pnas.90.13.6320. [DOI] [PMC free article] [PubMed] [Google Scholar]
- 6.Huang H, Chopra R, Verdine G L, Harrison S C. Science. 1998;282:1669–1675. doi: 10.1126/science.282.5394.1669. [DOI] [PubMed] [Google Scholar]
- 7.Boyer P L, Sarafianos S G, Arnold E, Hughes S H. Proc Natl Acad Sci USA. 2001;97:3056–3061. doi: 10.1073/pnas.97.7.3056. [DOI] [PMC free article] [PubMed] [Google Scholar]
- 8.Wöhrl B M, Krebs R, Goody R S, Restle T. J Mol Biol. 1999;292:333–344. doi: 10.1006/jmbi.1999.3057. [DOI] [PubMed] [Google Scholar]
- 9.Eggeling C, Berger S, Brand L, Fries J R, Schaffer J, Volkmer A, Seidel C A M. J Biotechnol. 2001;86:163–180. doi: 10.1016/s0168-1656(00)00412-0. [DOI] [PubMed] [Google Scholar]
- 10.Lu H P, Xun L, Xie X S. Science. 1998;282:1877–1882. doi: 10.1126/science.282.5395.1877. [DOI] [PubMed] [Google Scholar]
- 11.Moerner W E, Orrit M. Science. 1999;283:1670–1676. doi: 10.1126/science.283.5408.1670. [DOI] [PubMed] [Google Scholar]
- 12.Xie X S, Trautman J K. Annu Rev Phys Chem. 1998;49:441–480. doi: 10.1146/annurev.physchem.49.1.441. [DOI] [PubMed] [Google Scholar]
- 13.Weiss S. Nat Struct Biol. 2000;7:724–729. doi: 10.1038/78941. [DOI] [PubMed] [Google Scholar]
- 14.Herten D P, Tinnefeld P, Sauer M. Appl Phys B. 2000;71:765–771. [Google Scholar]
- 15.Kask P, Palo K, Fay N, Brand L, Mets Ü, Ullmann D, Jungmann J, Pschorr J, Gall K. Biophys J. 2000;78:1703–1713. doi: 10.1016/S0006-3495(00)76722-1. [DOI] [PMC free article] [PubMed] [Google Scholar]
- 16.van der Meer B W, Cooker G, Chen S Y. Resonance Energy Transfer: Theory and Data. New York: VCH; 1994. [Google Scholar]
- 17.Zhuang X, Kim H, Pereira M J B, Babcock H P, Walter N G, Chu S. Science. 2002;296:1473–1476. doi: 10.1126/science.1069013. [DOI] [PubMed] [Google Scholar]
- 18.Russell R, Zhuang X, Babcock H P, Millett I S, Doniach S, Chu S. Proc Natl Acad Sci USA. 2002;99:155–160. doi: 10.1073/pnas.221593598. [DOI] [PMC free article] [PubMed] [Google Scholar]
- 19.Zhuang X, Bartley L E, Babcock H P, Russell R, Ha T, Herschlag D, Chu S. Science. 2000;288:2048–2051. doi: 10.1126/science.288.5473.2048. [DOI] [PubMed] [Google Scholar]
- 20.Dahan M, Deniz A A, Ha T J, Chemla D S, Schultz P G, Weiss S. Chem Phys. 1999;247:85–106. [Google Scholar]
- 21.Deniz A A, Laurence T A, Beligere G S, Dahan M, Martin A B, Chemla D S, Dawson P E, Schultz P G, Weiss S. Proc Natl Acad Sci USA. 2000;97:5179–5184. doi: 10.1073/pnas.090104997. [DOI] [PMC free article] [PubMed] [Google Scholar]
- 22.Ha T, Zhuang X W, Kim H D, Orr J W, Williamson J R, Chu S. Proc Natl Acad Sci USA. 1999;96:9077–9082. doi: 10.1073/pnas.96.16.9077. [DOI] [PMC free article] [PubMed] [Google Scholar]
- 23.Kensch O, Restle T, Wöhrl B M, Goody R S, Steinhoff H J. J Mol Biol. 2000;301:1029–1039. doi: 10.1006/jmbi.2000.3998. [DOI] [PubMed] [Google Scholar]
- 24.Kensch O, Connolly B A, Steinhoff H J, McGregor A, Goody R S, Restle T. J Biol Chem. 2000;275:18271–18278. doi: 10.1074/jbc.M001309200. [DOI] [PubMed] [Google Scholar]
- 25.Widengren J, Schweinberger E, Berger S, Seidel C A M. J Phys Chem A. 2001;105:6851–6866. [Google Scholar]
- 26.Lakowicz J R. Principles of Fluorescence Spectroscopy. New York: Kluwer Academic/Plenum; 1999. [Google Scholar]
- 27.Schaffer J, Volkmer A, Eggeling C, Subramaniam V, Striker G, Seidel C A M. J Phys Chem A. 1999;103:331–336. [Google Scholar]
- 28.Negroni M, Buc H. Nat Cell Biol. 2001;2:151–155. doi: 10.1038/35052098. [DOI] [PubMed] [Google Scholar]
Associated Data
This section collects any data citations, data availability statements, or supplementary materials included in this article.