Abstract
Elevated epidermal growth factor receptor (EGFR) and mammalian target of rapamycin (mTOR) signaling are known to contribute to the malignant properties of glioblastoma multiforme (GBM), which include uncontrolled cell proliferation and evasion of apoptosis. Small molecule inhibitors that target these protein kinases have been evaluated in multiple clinical trials for cancer patients, including those with GBM. Here we have examined the cellular and molecular effects of a combined kinase inhibition of mTOR (rapamycin) and EGFR (EKI-785) in U87 and U251 GBM cells. Simultaneous treatment with rapamycin and EKI-785 results in synergistic antiproliferative as well as proapoptotic effects. At a molecular level, rapamycin alone significantly decreases S6 phosphorylation, whereas EKI-785 alone promotes substantially reduced signal transducer and activator of transcription (STAT3) phosphorylation. Treatment with rapamycin alone also increases Akt phosphorylation on Ser-473, but this effect is blocked by a simultaneous administration of EKI-785. Individually, EKI-785 diminishes while rapamycin promotes the binding of the translation inhibitor eukaryotic initiation factor 4E binding protein (4EBP1) to the eukaryotic translation initiation factor 4E (eIF4E). In spite of these opposing effects, the highest level of 4EBP1-eIF4E binding occurs with the combination of the two inhibitors. These results indicate that the inhibition of EGFR and mTOR has distinct as well as common signaling consequences and provides a molecular rationale for the synergistic antitumor effects of EKI-785 and rapamycin administration.
Keywords: epidermal growth factor receptor, signal transduction, rapamycin, glioblastoma, 4EBP1, Akt
Introduction
Constitutive activation of mitogenic signaling pathways is a hallmark of cancer, and a variety of small molecule inhibitors that block the activities of key signaling mediators in these pathways are being developed and used in cancer therapy. The results of clinical studies conducted to date suggest, however, that single-agent therapies have a limited efficacy against most solid tumors. These observations have prompted a growing appreciation for potential benefits in a subset of patients using combination therapies, in which multiple signaling mediators are simultaneously targeted. Given the large number of inhibitors currently in development, the preclinical testing and identification of agents showing additive or synergistic antitumor effects have become an area of intense research.
A pair of key signaling mediators, whose constitutive kinase activities have been associated with the malignant phenotype of many cancers, are epidermal growth factor receptor (EGFR) and mammalian target of rapamycin (mTOR) [1–4]. Early clinical trials have demonstrated the antitumor effects of EGFR or mTOR inhibitor-based therapies for subsets of cancer patients [5,6], and these results have prompted significant interest in testing inhibitors of these signaling mediators in combination.
The importance of EGFR constitutive activation has been well-established especially in glioblastoma multiforme (GBM), an aggressive primary brain tumor in which the gene for EGFR is frequently amplified and/or mutated [7,8]. EGFR signals through multiple downstream effectors, including signal transducer and activator of transcription 3 (STAT3) and phosphatidylinositol-3 kinase (PI3K), and the increased activities of these signaling mediators have been linked with tumor cell proliferation, invasion, evasion of apoptosis, and tumor angiogenesis [9–11]. In many tumor types, including GBM, inactivating mutations of the PTEN tumor suppressor also contribute to an increased PI3K signaling activity and a consequent downstream activation of Akt and mTOR signaling. mTOR regulates the translation of a subset of mRNA, many of which encode for proteins involved in driving cell growth, proliferation, and angiogenesis [6]. mTOR inhibitors have shown promising results in several tumor types, including GBM. Moreover, the observation that loss of PTEN function confers an increased sensitivity to mTOR inhibitors has further stimulated interest in the clinical use of these agents [12–15].
Here we evaluate the cellular and molecular effects of singular and combined mTOR and/or EGFR inhibition in two commonly investigated GBM cell lines. The treatment of U87 and U251 cells with rapamycin (an mTOR inhibitor) and EKI-785 (an EGFR inhibitor) [16,17] results in synergistic antiproliferative and proapoptotic effects, and a molecular analysis of multiple downstream signaling mediators shows that these biologic effects are due to distinct as well as convergent agent activities.
Materials and Methods
Drugs and Cell Lines
Rapamycin was obtained from the Developmental Therapeutics Program at the National Cancer Institute (Frederick, MD) (http://dtp.nci.nih.gov/docs/misc/available_samples/dtp_indsamples.html). A stock solution of 100 µM was prepared in 95% ethanol and stored at -20°C. EKI-785 was kindly provided by Wyeth-Ayerst (Madison, NJ) (courtesy of Dr. Lee Greenberger). A stock solution of 10 mM was prepared in dimethyl sulfoxide and stored at -20°C. The U87 and U251 glioma cell lines (American Type Culture Collection, Manassas, VA) were cultured in Dulbecco's modified Eagle's medium (DMEM) with 10% fetal bovine serum. Cells were maintained under subconfluent conditions at 37°C in an atmosphere of humidified 5% (vol/vol) CO2. Where indicated, the serum-containing medium was replaced with a serum-free medium supplemented with 10 ng/ml epidermal growth factor (EGF) (Cell Signaling, Beverly, MA). Most antibodies used in this study were purchased from Cell Signaling: eukaryotic initiation factor 4E binding protein (4EBP1; cat. no. 9452), ribosomal S6 (cat. no. 2212), phospho-S235/236 S6 (cat. no. 2211), STAT3 (cat. no. 9132), phospho-Y705 STAT3 (cat. no. 9131), phospho-Y1068 EGFR (cat. no. 2236), Akt (cat. no. 9272), phospho-S473 Akt (cat. no. 9271), and eukaryotic translation initiation factor 4E (eIF4E; cat. no. 9742). The EGFR antibody used for immunoprecipitation was purchased from Upstate Biotechnology (Lake Placid, NY; cat. no. 05-483), and the EGFR antibody used for immunoblotting was from Cell Signaling (cat. no. 2232). An antibody that specifically recognized cleaved p85 PARP was from Promega (Madison, WI; cat. no. G7341). 7-Methyl-GTP Sepharose beads were from Amersham Biosciences (Piscataway, NJ; cat. no. 27-5025-01).
MTS Assay
Cell growth was measured using the nonradioactive MTS assay according to the manufacturer's instructions (Promega). Briefly, cells were plated in 96-well plates at a density of 1000 cells/well. Four wells were plated for each drug treatment condition. After overnight incubation, the medium was replaced with a drug-containing medium, and cells were incubated for an additional 72 hours. Cells were treated with serial dilutions of each drug individually and with both drugs simultaneously at a fixed ratio. The MTS reagent [3-(4,5-dimethylthiazol-2-yl)-5-(3-carboxymethoxyphenyl)-2-(4-sulfophenyl)-2H-tetrazolium] and an electron transfer-coupling reagent (phenazine methosulfate) were added to the culture medium and incubated for 2 hours. The conversion of the MTS salt to a soluble formazan product was measured by spectrophotometry. The effects of various concentrations of the drugs were compared to untreated samples.
14C-3H Thymidine Incorporation Assay
Cells were plated in 96-well plates (1000 cells/well) and incubated for 48 hours with 14C thymidine (1 nCi/well, 59 mCi/mmol). Six wells were plated for each drug treatment condition. Rapamycin and/or EKI-785 then was added at the indicated concentrations and incubated for an additional 24 hours. Cells were pulsed with 3H thymidine (1.25 µCi/well, 20 Ci/mmol; Perkin-Elmer, Foster City, CA) for 2 hours. Cells were harvested by trypsinization, transferred onto glass filters, and lysed in distilled water. Dual-parameter scintillation counting was used to detect radioactive decay from filter-bound 3H and 14C.
Apoptosis
The DNA-specific fluorochrome Hoechst 33342 was used to analyze the nuclear morphology of the cells following drug treatment. Exponentially growing cells were treated with the indicated drug concentrations and incubated for 24 hours, and then floating and adherent cells were harvested and fixed in methanol/glacial acetic acid (3:1 vol/vol) overnight. Fixed cells were cytospun onto slides and stained with 1 µg/ml Hoechst dissolved in a glycerol/0.1 M Tris (pH 7.0) solution (1:1 vol/vol), and then apoptotic nuclei were counted under a fluorescent microscope [18].
Immunoblotting
Cells were plated overnight and then incubated with the indicated drugs for 24 hours in DMEM supplemented with either 10 ng/ml EGF or 10% fetal calf serum (FCS). Cells were washed in PBS and then lysed in buffer A (20 mM Tris-HCl, pH 7.4, 150 mM NaCl, 1 mM EGTA, 1 mM sodium fluoride, 1% NP-40, 0.5% sodium deoxycholate, 10 mM β-glycerol phosphate, 10 µg/ml aprotinin, 10 µg/ml pepstatin, 10 µg/ml leupeptin, 20 nM microcystin, 1 mM PMSF, 1 mM sodium orthovanadate, 20 nM microcystin, and 10 nM okadaic acid). Lysates were cleared of insoluble materials by centrifugation. Samples were boiled in sodium dodecyl sulfate (SDS) sample buffer, equal amounts of protein were loaded and run on SDS polyacrylamide gel electrophoresis (PAGE) gels, and resolved proteins were transferred to Immobilon-P membranes (Millipore, Billerico, MA). Membranes were blocked with 5% milk dissolved in Tris-buffered saline containing 0.02% Tween 20 and then incubated with a primary antibody diluted in the same buffer. After washing, membranes were incubated with either goat antirabbit (Cell Signaling) or goat antimouse (Pierce, Rockford, IL) antibodies conjugated to horseradish peroxidase. Blots were developed with the Super Signal Chemiluminescence reagent (Pierce). Typically, immunoblotting was first performed with phosphospecific antibodies and then membranes were stripped and reprobed with relevant nonphosphospecific antibodies.
Immunoprecipitation
Cells were handled as described for immunoblotting and then lysed in buffer B (20 mM HEPES, pH 7.5, 150 mM NaCl, 1.5 mM MgCl2, 1 mM EGTA, 10% glycerol, 1% Triton X-100, 10 µg/ml aprotinin, 10 µg/ml pepstatin, 10 µg/ml leupeptin, 20 nM microcystin, 100 µM PMSF, and 1 mM sodium orthovanadate). Lysates were cleared of insoluble materials by centrifugation, and equal amounts of detergent-soluble proteins were incubated on ice for 30 minutes with appropriate primary antibodies. The immune complexes then were precipitated with protein A Sepharose beads, and the resulting immunoprecipitates were washed twice in lysis buffer. Samples were boiled in an SDS sample buffer, eluted off the beads, and then processed as above for immunoblotting.
eIF4E/4EBP1 Pull-Down Assay
The 4EBP1 pull-down assay was performed essentially as described by Dilling et al. [19]. Cells were handled and lysed in buffer A as described above for immunoblotting. After clearing by centrifugation, lysates were rotated with 7-methyl-GTP Sepharose beads overnight at 4°C. Beads were washed thrice in lysis buffer and boiled in SDS sample buffer prior to the elution of proteins off the beads. The samples were separated by SDS-PAGE and processed for immunoblotting as described above.
Statistical Testing
Analysis of synergy was performed with the median effect method, as described by Chou and Talalay [20], using the CalcuSyn software program (Version 1.1; BioSoft, Inc., Ferguson, MO; http://www.biosoft.com). This method allows for the calculation of a combination index (CI), where a CI value < 1 indicates a synergistic interaction between two drugs. The effects of drug treatment on apoptosis and proliferation were analyzed using a two-tailed Student's t test. MTS data for EKI-785 treatment were fitted with a three-parameter Hill equation to determine the IC50 using the SigmaPlot analysis package.
Results
Glioma Cell Growth Inhibition
The effects of rapamycin and/or EKI-785 on cell proliferation were initially assessed using the MTS assay (Figure 1A). The results of this analysis indicated U87 cells as being similarly sensitive to all concentrations of rapamycin that were tested, whereas the growth of U251 cells was little affected by rapamycin concentrations as high as 100 nM. Serum concentrations of 10 nM rapamycin or greater are readily achieved in patients. Treatments with EKI-785 revealed a distinct ordering of cell line sensitivities, with the IC50 of U87 being almost two-fold higher than that of U251 (4.8 vs 2.8 µM, respectively). Cells were also exposed to multiple drug concentration combinations, with the rapamycin/EKI-785 concentrations ratio being fixed at 1:100. For each cell line, the effect of the combination exceeded that of either agent used singularly (Figure 1A). To assess potential synergistic interactions between these drugs, MTS data were analyzed using the median effect method of Chou and Talalay [20]. Data analysis through this method generates a CI for each drug concentration combination, with a CI value less than 1 indicating a synergistic interaction between two drugs. As shown in Figure 1B, synergy was evident at nearly all drug concentration combinations tested for each cell line.
Figure 1.
Growth inhibition of glioma cells by rapamycin and EKI-785. U87 and U251 cells were incubated for 72 hours with the indicated concentrations of rapamycin and EKI-785, both individually and in 1:100 molar ratio combinations. The effects on cell number were assessed using an MTS colorimetric cell growth assay. (A) Changes in absorbance, relative to a value of 1 for untreated controls, are shown for the indicated drug concentrations and combinations. Results have been plotted as mean ± SEM for three independent experiments. *P < .05 and #P = .06, as indicated by Student's t test results, for rapamycin versus EKI-785 + rapamycin. †P < .05, for EKI-785 vs EKI-785 + rapamycin. (B) The MTS data from (A) were analyzed for synergy using the median effect method, and the CI values were plotted relative to corresponding fractional affects. Each point on the graph is labeled with a letter that corresponds to a rapamycin/EKI-785 combination noted with the same letter in panel A. CI values less than 1 reflect a synergistic interaction between the drugs.
Assessment of Cell Proliferation and Apoptotic Effects
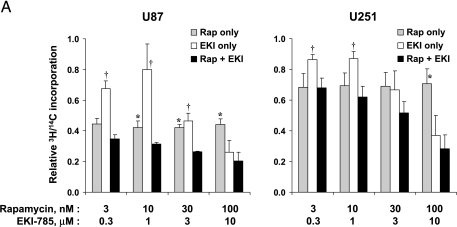
Because the antigrowth effects of combined-agent treatments could result from decreased cell proliferation and/or increased cell death, we examined the effects of drug treatment on DNA synthesis and apoptosis induction separately. To quantitate antiproliferative effects, cells were pre-labeled with 14C thymidine (48 hours); incubated with varying concentrations of rapamycin, EKI-785, or both drugs for 24 hours; and then pulsed with 3H thymidine (2 hours). 3H/14C ratios were calculated as a measure of the proportion of cells traversing S-phase. As seen in Figure 2A, the combination of rapamycin and EKI-785 suppressed proliferation significantly more than rapamycin alone at multiple drug concentration combinations in U87 cells but only at high concentrations in U251 cells (P < .05).
Figure 2.
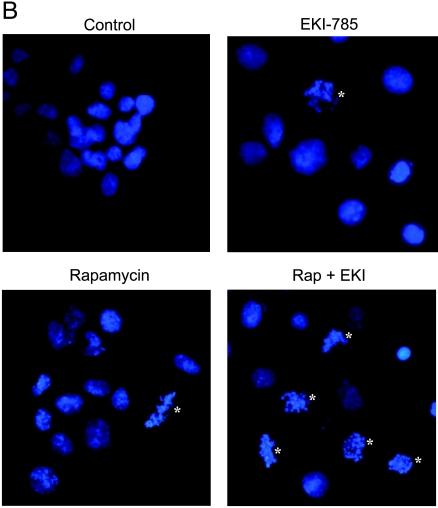
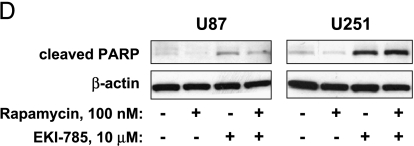
Effects on proliferation and apoptosis with drug treatment. (A) U87 and U251 cells were preincubated with 14C thymidine for 48 hours and then incubated with the indicated drug concentrations, singularly or in combination, for an additional 24 hours. Cells were then pulsed with 3H thymidine for 2 hours. For each sample, the DNA was precipitated on glass filters, and filter-bound 3H and 14C radioactivities were measured by scintillation counting. Results shown are normalized relative to 1 for untreated controls and represent the mean ± SEM of three independent experiments. *P < .05, as indicated by Student's t test results for rapamycin versus EKI-785 + rapamycin. †P < .05, for EKI-785 vs EKI-785 + rapamycin. (B) U87 and U251 glioma cells were incubated with rapamycin and/or EKI-785 for 72 hours. Cells then were fixed and their nuclei were stained with Hoechst 33342. Representative photomicrographs of U87 cells treated with 100 nM rapamycin and/or 10 µM EKI-785 are shown. Nuclei with apoptotic morphology are indicated with an asterisk (*). (C) The fraction of cells with apoptotic morphology was quantitated. The values graphed represent the mean ± SEM of three independent experiments, with 500 cells examined per cell line per experiment. *P < .05, as indicated by Student's t test for rapamycin versus EKI-785 + rapamycin. †P < .05, for EKI-785 vs EKI-785 + rapamycin. (D) Western blot analysis for the extent of PARP cleavage in association with single- and combined-agent treatments of U87 and U251 cells for 48 hours. Results show that both EKI alone (10 µM) and EKI in combination with rapamycin (100 nM) induce a substantial PARP cleavage.
Apoptosis induction was evaluated by staining nuclear DNA with Hoechst 33342 and counting the fraction of cells with condensed chromatin [18]. Incubation with 100 nM rapamycin for 72 hours had relatively little effect on apoptosis induction in U87 cells (Figure 2, B and C), whereas the difference between treated and untreated U251 cells (1% and 5%, respectively) was statistically significant. Higher and statistically significant levels of apoptosis were induced in U87 and U251 cells by incubation with either 10 µM EKI-785 alone [9% for U87 (P = .03); 23% for U251 (P = .05)] or with 10 µM EKI-785 combined with 100 nM rapamycin [18% for U87 (P = .02) and 30% for U251 (P = .02)]. Western blot analysis demonstrating increased levels of cleaved PARP following treatment with EKI-785, alone or in combination with rapamycin (Figure 2D), provided biochemical confirmation for the induction of apoptosis in both cell lines.
Inhibition of mTOR Signaling
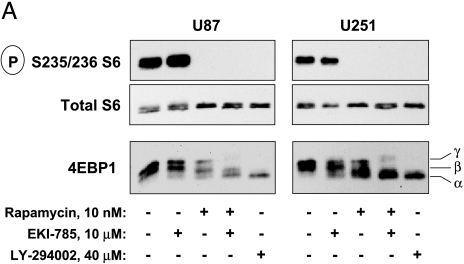
To elucidate the molecular basis of single and combined inhibitor treatments on cell proliferation and apoptotic response, we examined the effects of EKI-785 and/or rapamycin treatment on the phosphorylation state of signaling mediators downstream of EGFR and/or mTOR. Two key targets of mTOR are p70S6 kinase (p70S6K) and 4EBP1, each of which has activities that promote the translation of mRNA, whose corresponding proteins drive cell proliferation [21]. As expected, incubation of cells with rapamycin completely blocked the mTOR/p70S6K-dependent phosphorylation of ribosomal S6 without altering the cellular levels of total S6, whereas EKI-785 had no effect on S6 phosphorylation (Figure 3A). Similarly, EKI-785 had no observable influence on 4EBP1 phosphorylation, as indicated by the lack of effect on the electrophoretic mobility of 4EBP1. Rapamycin reduced 4EBP1 phosphorylation, and the extent of this effect was consistent with the observation that mTOR phosphorylates only a subset of 4EBP1 phosphorylation sites [22]. Importantly, the combined treatment with rapamycin and EKI-785 was markedly more effective in suppressing 4EBP1 phosphorylation compared to either drug alone (Figure 3A), and this effect was similar to that resulting from the treatment of cells with the PI3K inhibitor LY294002.
Figure 3.
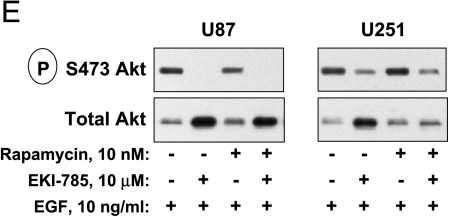
Immunoblot analysis of mTOR and EGFR signaling mediators. U87 and U251 cells cultured in medium with 10% FCS were incubated for 24 hours with 10 nM rapamycin and/or 10 µM EKI-785, or with 40 µM LY294002. Cells were lysed, and whole cell lysates were processed for immunoprecipitation and/or immunoblotting, as indicated. (A) The phosphorylation of mTOR signaling mediators ribosomal S6 protein and 4EBP1 was assessed in whole cell lysates. For 4EBP1, three distinct bands (α, β, and γ) are readily detectable by SDS-PAGE, and shifts from the highest (α) to the lowest mobility (γ) reflect an increasing 4EBP1 phosphorylation on multiple serine/threonine residues. Results shown are representative of four independent experiments. (B) Cells were treated as described above, and whole cell lysates were incubated with 7-methyl-GTP Sepharose beads. Proteins were eluted off the beads and processed for immunoblotting with antibodies directed against 4EBP1 and eIF4E. Results shown are representative of three independent experiments for U87 cells and two independent experiments with U251 cells. (C) EGFR and STAT3 were immunoprecipitated from whole cell lysates, and phosphorylation status was assessed by immunoblotting. Low (bracket) and high (arrow) electrophoretic mobility forms of EGFR are seen, with increased low-mobility EGFR being readily evident in cells treated with EKI-785, alone or in combination with rapamycin. (D) Akt phosphorylation was assessed by an immunoblotting of total proteins from whole cell lysates. (E) Cells were cultured in a serum-free medium supplemented with EGF and indicated drugs for 24 hours and then processed for phospho-Akt immunoblotting. Each of the results shown in (C), (D), or (E) is representative of two or more independent experiments.
4EBP1 binds to and inhibits the activity of eIF4E, which is constitutively bound to the 7-methyl-GTP cap structure of cytoplasmic mRNA [23]. Because phosphorylation of 4EBP1 disrupts its inhibitory binding of eIF4E, we investigated the effects of small molecule inhibitors on this interaction. Following the treatment of cells with EKI-785 and/or rapamycin, cellular eIF4E was pulled down by incubating cell lysates with 7-methyl-GTP Sepharose beads. In exponentially growing, control-treated cells, only a small amount of 4EBP1 coprecipitated with eIF4E (Figure 3B), whereas rapamycin treatment resulted in an increased 4EBP1-eIF4E association, as was to be expected based on the 4EBP1 phosphorylation analysis. Surprisingly, the treatment of cells with EKI-785 alone reduced the association of 4EBP1 with eIF4E relative to control; in combination with rapamycin, however, this EKI-785-associated effect was not evident. Moreover, in U87 cells, which were the most sensitive to combination therapy (see Figure 1A), treatment with both rapamycin and EKI-785 resulted in an enhanced association of 4EBP1 with eIF4E compared to rapamycin alone.
Inhibition of EGFR Signaling
Incubation of either glioma cell line with EKI-785, alone or in combination with rapamycin, led to a significant attenuation of EGFR Tyr-1068 autophosphorylation in conjunction with a significant accumulation of EGFR with a reduced electrophoretic mobility (Figure 3C). Rapamycin treatment alone had no significant effect on EGFR phosphorylation status or expression. EGFR Tyr-1068 autophosphorylation is required for the receptor-mediated activation and phosphorylation of the STAT3 transcription factor [9,24], and, not surprisingly, EKI-785 effectively blocked STAT3 phosphorylation. As with EGFR autophosphorylation, rapamycin treatment had no effect on cellular levels of phospho-STAT3.
Akt is an important signaling mediator that is influenced by multiple factors, and we hypothesize that Akt inhibition, in association with EKI-785 and rapamycin treatments, might contribute to the antiproliferative and proapoptotic effects of combined-agent administrations. As reported previously, rapamycin treatment alone resulted in a modest increase in Akt phosphorylation. Interestingly, although EKI-785 alone did not alter Akt phosphorylation, it effectively blocked the rapamycin-associated increase in phospho-Akt (Figure 3D). Both U87 and U251 cells lack wild-type PTEN function, which normally dampens the PI3K-dependent activation of Akt. ecause multiple receptor tyrosine kinases, in addition to EGFR, modulate the PI3K/Akt signaling pathway, we reasoned that compensatory RTK activities that are stimulated by growth factors present in FCS might contribute to the failure of EKI-785 to block Akt phosphorylation. To test this possibility, we repeated our experiments in cells cultured in serum-free medium supplemented with EGF only. Under these conditions, EKI-785 effectively reduced Akt phosphorylation (Figure 3E). Similar compensatory signaling pathways likely contribute to the resistance of S6 and 4EBP1 phosphorylations to EKI-785 treatment in serum-containing medium (Figure 3A).
Discussion
Novel treatment regimens using combinations of molecularly targeted therapeutics are being developed and tested in cancer therapy. Our data suggest that combining an EGFR inhibitor with an mTOR inhibitor results in a synergistic growth inhibition of glioma cells in vitro compared to treatments with either inhibitor alone, and that both antiproliferative and proapoptotic effects contribute to this synergistic activity. Furthermore, this effect is associated with the inhibition of multiple downstream signaling mediators, as revealed by phosphoprotein immunoblot analysis (Figure 3). Of the signaling mediators we have examined, STAT3 and EGFR were substantially inhibited by EKI-785, whereas rapamycin significantly blocked p70S6 kinase activity. These observations correspond well with results recently reported in a similar study where the GBM cell line D54MG was tested for responses to a different mTOR inhibitor (RAD001), and a multi-targeted kinase inhibitor (AEE788 inhibits EGFR, HER2 and VEGFR) with each agent tested singularly as well as in combination [25].
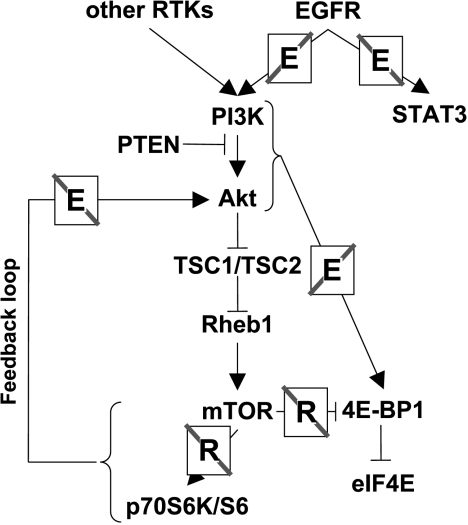
The current study extends previous observations to identify potential points of convergence between the EGFR and mTOR signaling pathways that may contribute to the antitumor effects of combined small molecule inhibitor administrations (Figure 4). Although the suppression of Akt phosphorylation with rapamycin treatment in HEK293 cells has been reported [26], our results (Figure 3D) are consistent with other reports demonstrating an upregulation of Akt activity in 3T3-L1 adipocytes or Kc167 Drosophila cells treated with rapamycin, in Drosophila larvae expressing mutant dTOR, and in HEK293 cells overexpressing kinase-dead mTOR or dominant-negative p70S6K constructs [27–29]. mTOR forms distinct complexes with the associated raptor or rictor proteins, and a recent study demonstrated that the mTOR/rictor complex directly phosphorylates Akt on Ser-473 and that this activity is insensitive to rapamycin [30]. Collectively, these studies suggest that the inhibition of the raptor/mTOR complex by rapamycin, in some model systems, results in an upregulation of mTOR/rictor activity and a resulting increased phosphorylation of Akt. Our observation, that EKI-785-mediated inhibition of EGFR activity blocks this rapamycin-induced upregulation of Akt phosphorylation, suggests that EGFR signaling in some way modulates this feedback loop. Because Akt signaling promotes cell proliferation and evasion of apoptosis, the inhibition of rapamycin-induced Akt phosphorylation by EKI-785 could well contribute to the antiproliferative and proapoptotic effects of these two drugs when used in combination.
Figure 4.
Schematic of EGFR and mTOR signaling network, and signaling mediator effects associated with rapamycin and/or EKI-785 treatments. A notation of an “E” or “R,” in association with a signaling pathway, indicates where the pathway is blocked by EKI-785 or rapamycin, respectively.
An additional single-agent effect of significance is the increase in EGFR that results from the treatment of cells with EKI-785 (Figure 3C). Our EGFR Western blot analyses show both low- and high-mobility forms of the receptor, as reported by others who have established that the low-mobility form is preferentially localized to the cell membrane [31]. Although not specifically examined here for cellular localization, an increase in low-mobility EGFR isoform following EKI-785 treatment suggests that this inhibitor causes an accumulation of fully processed EGFR at the plasma membrane, consistent with a cellular homeostatic response to loss of EGFR signaling. This membrane accumulation may sensitize tumor cells to treatment with EGFR-targeted antibodies, as has recently been demonstrated using the combination of small molecule kinase inhibitors and EGFR-targeted antibodies in various tumor models [32,33].
For the combination therapy investigated in the present study, our results suggest that EGFR- and mTOR-dependent signaling converge on the translational repressor 4EBP1. The mTOR-dependent phosphorylation of 4EBP1 on Thr-37 and Thr-46 serves as a priming event that allows a further phosphorylation of Thr-70, Ser-65, and possibly other sites by additional signaling mediators [22,34,35]. The phosphorylation of 4EBP1 on these residues disrupts the inhibitory binding of 4EBP1 to eIF4E and thereby promotes an increased protein translation efficiency for mRNA transcripts with complex 5′ untranslated regions (UTRs) [23]. EKI-785 treatment alone actually decreases the inhibitory interaction of 4EBP1 with eIF4E (Figure 3B), which suggests that single-agent EGFR inhibitor therapy may actually promote the translation of complex 5′ UTR-containing transcripts, some of which encode for proteins involved in driving cell proliferation and angiogenesis. In contrast, the combination of EKI-785 with rapamycin treatment promoted the maximal binding of 4EBP1 to eIF4E. The suppression of eIF4E activity by 4EBP1 binding is critically important for the antitumor effects of rapamycin [19]. Thus, the converging effects of mTOR and EGFR inhibition on increasing 4EBP1/eIF4E binding are likely to be important contributors to the synergistic growth-suppressive effects of combined EGFR-mTOR inhibitor therapy.
In total, our results suggest that compensatory signaling mechanisms may limit the efficacy of single-agent therapies, and that the simultaneous inhibition of multiple enzyme activities reduces the effects of such feedback compensations. Moreover, the suppression of multiple kinase activities provides additive inhibitory effects by acting on parallel and convergent signaling pathways. These molecular observations, combined with associated biologic responses, provide a basis for some optimism on improved outcomes for GBM patients treated with novel combination therapy regimens.
Footnotes
This work was supported by the Mayo Foundation, American Brain Tumor Association (R.D.R.), Joel A. Gingras, Jr., Fellowship (R.D.R.), American Cancer Society Research Scholar Grant (J.N.S.), Accelerate Brain Cancer Cure (J.N.S.), and National Institutes of Health grants CA80829 (J.N.S), CA0108961 (J.N.S.), CA85779 (C.D.J.), and NS49720 (C.D.J.).
Ravi D. Rao and Ann C. Mladek contributed equally to this work.
References
- 1.Fingar DC, Blenis J. Target of rapamycin (TOR): an integrator of nutrient and growth factor signals and coordinator of cell growth and cell cycle progression. Oncogene. 2004;23:3151–3171. doi: 10.1038/sj.onc.1207542. [DOI] [PubMed] [Google Scholar]
- 2.Holland EC, Sonenberg N, Pandolfi PP, Thomas G. Signaling control of mRNA translation in cancer pathogenesis. Oncogene. 2004;23:3138–3144. doi: 10.1038/sj.onc.1207590. [DOI] [PubMed] [Google Scholar]
- 3.Mosesson Y, Yarden Y. Oncogenic growth factor receptors: implications for signal transduction therapy. Semin Cancer Biol. 2004;14:262–270. doi: 10.1016/j.semcancer.2004.04.005. [DOI] [PubMed] [Google Scholar]
- 4.Yarden Y, Sliwkowski MX. Untangling the ErbB signalling network. Nat Rev Mol Cell Biol. 2001;2:127–137. doi: 10.1038/35052073. [DOI] [PubMed] [Google Scholar]
- 5.Dancey J. Epidermal growth factor receptor inhibitors in clinical development. Int J Radiat Oncol Biol Phys. 2004;58:1003–1007. doi: 10.1016/j.ijrobp.2003.07.011. [DOI] [PubMed] [Google Scholar]
- 6.Rao RD, Buckner JC, Sarkaria JN. Mammalian target of rapamycin (mTOR) inhibitors as anti-cancer agents. Curr Cancer Drug Targets. 2004;4:621–635. doi: 10.2174/1568009043332718. [DOI] [PubMed] [Google Scholar]
- 7.Frederick L, Wang XY, Eley G, James CD. Diversity and frequency of epidermal growth factor receptor mutations in human glioblastomas. Cancer Res. 2000;60:1383–1387. [PubMed] [Google Scholar]
- 8.Smith JS, Tachibana I, Passe SM, Huntley BK, Borell TJ, Iturria N, O'Fallon JR, Schaefer PL, Scheithauer BW, James CD, et al. PTEN mutation EGFR amplification, and outcome in patients with anaplastic anaplastic astrocytoma and glioblastoma multiforme. J Natl Cancer Inst. 2001;93:1246–1256. doi: 10.1093/jnci/93.16.1246. [DOI] [PubMed] [Google Scholar]
- 9.Buettner R, Mora LB, Jove R. Activated STAT signaling in human tumors provides novel molecular targets for therapeutic intervention. Clin Cancer Res. 2002;8:945–954. [PubMed] [Google Scholar]
- 10.Guha A. Ras activation in astrocytomas and neurofibromas. Can J Neurol Sci. 1998;25:267–281. doi: 10.1017/s0317167100034272. [DOI] [PubMed] [Google Scholar]
- 11.Vivanco I, Sawyers CL. The phosphatidylinositol 3-kinase AKT pathway in human cancer. Nat Rev Cancer. 2002;2:489–501. doi: 10.1038/nrc839. [DOI] [PubMed] [Google Scholar]
- 12.Choe G, Horvath S, Cloughesy TF, Crosby K, Seligson D, Palotie A, Inge L, Smith BL, Sawyers CL, Mischel PS. Analysis of the phosphatidylinositol 3′-kinase signaling pathway in glioblastoma patients in vivo. Cancer Res. 2003;63:2742–2746. [PubMed] [Google Scholar]
- 13.Mills GB, Lu Y, Kohn EC. Linking molecular therapeutics to molecular diagnostics: inhibition of the FRAP/RAFT/TOR component of the PI3K pathway preferentially blocks PTEN mutant cells in vitro and in vivo. PNAS. 2001;98:10031–10033. doi: 10.1073/pnas.191379498. [DOI] [PMC free article] [PubMed] [Google Scholar]
- 14.Neshat MS, Mellinghoff IK, Tran C, Stiles B, Thomas G, Petersen R, Frost P, Gibbons JJ, Wu H, Sawyers CL. Enhanced sensitivity of PTEN-deficient tumors to inhibition of FRAP/mTOR. PNAS. 2001;98:10314–10319. doi: 10.1073/pnas.171076798. [DOI] [PMC free article] [PubMed] [Google Scholar]
- 15.Podsypanina K, Lee RT, Politis C, Hennessy I, Crane A, Puc J, Neshat M, Wang H, Yang L, Gibbons J, et al. An inhibitor of mTOR reduces neoplasia and normalizes p70/S6 kinase activity in Pten+/- mice. PNAS. 2001;98:10320–10325. doi: 10.1073/pnas.171060098. [DOI] [PMC free article] [PubMed] [Google Scholar]
- 16.Roberts RB, Min L, Washington MK, Olsen SJ, Settle SH, Coffey RJ, Threadgill DW. Importance of epidermal growth factor receptor signaling in establishment of adenomas and maintenance of carcinomas during intestinal tumorigenesis. Proc Natl Acad Sci USA. 2002;99:1521–1526. doi: 10.1073/pnas.032678499. [DOI] [PMC free article] [PubMed] [Google Scholar]
- 17.Sweeney WE, Chen Y, Nakanishi K, Frost P, Avner ED. Treatment of polycystic kidney disease with a novel tyrosine kinase inhibitor. Kidney Int. 2000;57:33–40. doi: 10.1046/j.1523-1755.2000.00829.x. [DOI] [PubMed] [Google Scholar]
- 18.Kottke TJ, Blajeski AL, Martins LM, Mesner PW, Jr, Davidson NE, Earnshaw WC, Armstrong DK, Kaufmann SH. Comparison of paclitaxel-, 5-fluoro-2′-deoxyuridine-, and epidermal growth factor (EGF)-induced apoptosis. Evidence for EGF-induced anoikis. J Biol Chem. 1999;274:15927–15936. doi: 10.1074/jbc.274.22.15927. [DOI] [PubMed] [Google Scholar]
- 19.Dilling MB, Germain GS, Dudkin L, Jayaraman AL, Zhang X, Harwood FC, Houghton PJ. 4E-binding proteins, the suppressors of eukaryotic initiation factor 4E, are down-regulated in cells with acquired or intrinsic resistance to rapamycin. J Biol Chem. 2002;277:13907–13917. doi: 10.1074/jbc.M110782200. [DOI] [PubMed] [Google Scholar]
- 20.Chou TC, Talalay P. Quantitative analysis of dose-effect relationships: the combined effects of multiple drugs or enzyme inhibitors. Adv Enzyme Regul. 1984;22:27–55. doi: 10.1016/0065-2571(84)90007-4. [DOI] [PubMed] [Google Scholar]
- 21.Shamji AF, Nghiem P, Schreiber SL. Integration of growth factor and nutrient signaling: implications for cancer biology. Mol Cell. 2003;12:271–280. doi: 10.1016/j.molcel.2003.08.016. [DOI] [PubMed] [Google Scholar]
- 22.Gingras AC, Gygi SP, Raught B, Polakiewicz RD, Abraham RT, Hoekstra MF, Aebersold R, Sonenberg N. Regulation of 4E-BP1 phosphorylation: a novel two-step mechanism. Genes Dev. 1999;13:1422–1437. doi: 10.1101/gad.13.11.1422. [DOI] [PMC free article] [PubMed] [Google Scholar]
- 23.Raught B, Gingras AC. eIF4E activity is regulated at multiple levels. Int J Biochem Cell Biol. 1999;31:43–57. doi: 10.1016/s1357-2725(98)00131-9. [DOI] [PubMed] [Google Scholar]
- 24.Shao H, Cheng HY, Cook RG, Tweardy DJ. Identification and characterization of signal transducer and activator of transcription 3 recruitment sites within the epidermal growth factor receptor. Cancer Res. 2003;63:3923–3930. [PubMed] [Google Scholar]
- 25.Goudar RK, Shi Q, Hjelmeland MD, Keir ST, McLendon RE, Wikstrand CJ, Reese ED, Conrad CA, Traxler P, Lane HA, et al. Combination therapy of inhibitors of epidermal growth factor receptor/vascular endothelial growth factor receptor 2 (AEE788) and the mammalian target of rapamycin (RAD001) offers improved glioblastoma tumor growth inhibition. Mol Cancer Ther. 2005;4:101–112. [PubMed] [Google Scholar]
- 26.Edinger AL, Linardic CM, Chiang GG, Thompson CB, Abraham RT. Differential effects of rapamycin on mammalian target of rapamycin signaling functions in mammalian cells. Cancer Res. 2003;63:8451–8460. [PubMed] [Google Scholar]
- 27.Haruta T, Uno T, Kawahara J, Takano A, Egawa K, Sharma PM, Olefsky JM, Kobayashi M. A rapamycin-sensitive pathway down-regulates insulin signaling via phosphorylation and proteasomal degradation of insulin receptor substrate-1. Mol Endocrinol. 2000;14:783–794. doi: 10.1210/mend.14.6.0446. [DOI] [PubMed] [Google Scholar]
- 28.Radimerski T, Montagne J, Rintelen F, Stocker H, van der Kaay J, Downes CP, Hafen E, Thomas G. dS6K-regulated cell growth is dPKB/dPI(3)K-independent, but requires dPDK1. Nat Cell Biol. 2002;4:251–255. doi: 10.1038/ncb763. [DOI] [PubMed] [Google Scholar]
- 29.Shah OJ, Wang Z, Hunter T. Inappropriate activation of the TSC/Rheb/mTOR/S6K cassette induces IRS1/2 depletion, insulin resistance, and cell survival deficiencies. Curr Biol. 2004;14:1650–1656. doi: 10.1016/j.cub.2004.08.026. [DOI] [PubMed] [Google Scholar]
- 30.Sarbassov DD, Guertin DA, Ali SM, Sabatini DM. Phosphorylation and regulation of Akt/PKB by the rictor-mTOR complex. Science. 2005;307:1098–1101. doi: 10.1126/science.1106148. [DOI] [PubMed] [Google Scholar]
- 31.Waterfield MD, Mayes EL, Stroobant P, Bennet PL, Young S, Goodfellow PN, Banting GS, Ozanne B. A monoclonal antibody to the human epidermal growth factor receptor. J Cell Biochem. 1982;20:149–161. doi: 10.1002/jcb.240200207. [DOI] [PubMed] [Google Scholar]
- 32.Huang S, Armstrong EA, Benavente S, Chinnaiyan P, Harari PM. Dual-agent molecular targeting of the epidermal growth factor receptor (EGFR): combining anti-EGFR antibody with tyrosine kinase inhibitor. Cancer Res. 2004;64:5355–5362. doi: 10.1158/0008-5472.CAN-04-0562. [DOI] [PubMed] [Google Scholar]
- 33.Matar P, Rojo F, Cassia R, Moreno-Bueno G, Di Cosimo S, Tabernero J, Guzman M, Rodriguez S, Arribas J, Palacios J, et al. Combined epidermal growth factor receptor targeting with the tyrosine kinase inhibitor gefitinib (ZD1839) and the monoclonal antibody cetuximab (IMC-C225): superiority over single-agent receptor targeting. Clin Cancer Res. 2004;10:6487–6501. doi: 10.1158/1078-0432.CCR-04-0870. [DOI] [PubMed] [Google Scholar]
- 34.Gingras AC, Raught B, Gygi SP, Niedzwiecka A, Miron M, Burley SK, Polakiewicz RD, Wyslouch-Cieszynska A, Aebersold R, Sonenberg N. Hierarchical phosphorylation of the translation inhibitor 4E-BP1. Genes Dev. 2001;15:2852–2864. doi: 10.1101/gad.912401. [DOI] [PMC free article] [PubMed] [Google Scholar]
- 35.Herbert TP, Tee AR, Proud CG. The extracellular signal-regulated kinase pathway regulates the phosphorylation of 4E-BP1 at multiple sites. J Biol Chem. 2002;277:11591–11596. doi: 10.1074/jbc.M110367200. [DOI] [PubMed] [Google Scholar]


