

Abstract
Acute renal failure (ARF) has a high morbidity and mortality. In animal ARF models, effective treatments must be administered before or shortly after the insult, limiting their clinical potential. We used microarrays to identify early biomarkers that distinguish ischemic from nephrotoxic ARF, or biomarkers that detect both injury types. We compared rat kidney transcriptomes 2 and 8 hours after ischemia/reperfusion and after mercuric chloride. Quality control and statistical analyses were necessary to normalize microarrays from different lots, eliminate outliers, and exclude unaltered genes. Principal component analysis revealed distinct ischemic and nephrotoxic trajectories, and clear array groupings. Therefore, we used supervised analysis, t-tests and fold changes, to compile gene lists for each group, exclusive or non-exclusive, alone or in combination. There was little network connectivity, even in the largest group. Some microarray-identified genes were validated by TaqMan assay, ruling out artifacts. Western blotting confirmed that HO-1 and ATF3 proteins were upregulated; however, unexpectedly, their localization changed within the kidney. HO-1 staining shifted from cortical (early) to outer stripe of the outer medulla (late), primarily in detaching cells, after mercuric chloride, but not ischemia/reperfusion. ATF3 staining was similar, but with additional early transient expression in the outer stripe after ischemia/reperfusion. We conclude that microarray-identified genes must be evaluated not only for protein levels, but also for anatomical distribution among different zones, nephron segments, or cell types. Although protein detection reagents are limited, microarray data lay a rich foundation to explore biomarkers, therapeutics, and pathophysiology of ARF.
Keywords: Microarray, Principal Component Analysis, TaqMan, Western Blots, Immunohistochemistry
INTRODUCTION
Ischemic and nephrotoxic injury, alone or in combination, are major contributing factors to the development of acute renal failure (35). Animal models have been very useful to characterize the development of ARF, identify potential mediators, and test therapies. Because the timing and severity of the insult are controlled, these two types of ARF can be clearly identified by histology, and several treatments can decrease the severity of the disease if given before or shortly after the insult (13). In humans, the distinction between these types of renal injury are usually inferred retrospectively through patient histories and indirect diagnoses, but rarely corroborated with biopsies. Because the timing of the insult(s) is usually unknown and biomarkers have not been sufficiently developed for early diagnosis, the potential for early treatment has been untapped. Further, the heterogeneity of the ARF patient population and an inability to classify patients has hampered clinical trials.
A number of approaches have been used to identify components of the complex responses to ischemia/reperfusion and nephrotoxins, which are not only potential biomarkers, but also therapeutic targets. Some of these approaches have employed subtractive molecular biology techniques, including differential display and representational difference analysis, where the selected genes tend to be abundant and highly up- or down-regulated (15, 22, 28, 29). While subtractive methods are limited to paired, non-quantitative comparisons, DNA microarrays allow more detailed, quantitative, and multivariate comparisons, with a theoretically greater dynamic range to simultaneously analyze abundant and rare gene expression.
Gene expression in ARF has been examined with microarrays in several studies (2, 14, 18, 30, 36, 43, 44), however, the results vary, due to a number of potential confounding factors, including differences between species: mouse (18, 30, 36, 44) vs. rat (2, 14, 43); differences between insults: cisplatin (2, 14, 30) vs. ischemia/reperfusion (18, 36, 43, 44); differences between microarray formats: oligonucleotide (18, 30, 44) vs. cDNA (2, 14, 36, 43); and differences in time of injury. Validation of microarray results by RT/PCR or protein analysis is often limited. All but one of these studies (36) examined gene expression 24 hours or more after the insult, and none of these studies examined the gene expression in response to the nephrotoxin mercuric chloride. We compared ischemia/reperfusion and mercuric chloride at 2 and 8 hours post-insult, as well as normal vs. sham vs. volume depletion. Further, we used the CodeLink™ oligonucleotide microarray format to examine gene expression changes in the rat, validated the level of gene expression with TaqMan quantitative polymerase chain reaction, and validated the level and localization of protein expression by western blot and immunohistochemistry.
MATERIALS AND METHODS
Injury models
6-8 week old male Sprague-Dawley rats (200-300 g, Charles River Laboratories, Willmington MA) were housed and allowed free access to water and food. Animal care followed the criteria of the NIH for the care and use of laboratory animal in research. A total of 31 animals were assigned to 9 different experimental groups; normal, volume depletion, sham, ischemia/reperfusion 2h, ischemia/reperfusion + alpha-MSH (50 μg/rat, i.v.) 2h, ischemia/reperfusion 8h, mercuric chloride (4 mg/kg, s.c.) 2h, mercuric chloride 8 h, and cisplatin (20 mg/kg, i.p.) 2h. To minimize the effect of circadian rhythms on gene expression (19), all treatments began at the same time of day. For the ischemia/reperfusion model, rats were anesthetized with 100 mg/kg ketamine, 10 mg/kg xylazine, and 1 mg/kg acepromazine, i.m., and placed on the heating table kept at 37°C. A midline incision was made, and both renal pedicles were clamped for 40 minutes. After removing the clamp, 5 ml of pre-warmed (37°C) normal saline was instilled into the peritoneal cavity, and the incisions were sutured. The rats were sacrificed at 2 or 8 h after reperfusion. Sham treated animals went through the same surgical procedure, including blunt dissection of the renal pedicle; however, renal clamps were not applied, saline was instilled, and the incision was sutured 40 min later. These animals were also harvested at 8 h. For the nephrotoxic injury model, 4 mg/kg of mercuric chloride (dissolved in normal saline) was injected subcutaneously and rats were sacrificed at 2 or 8 h. A rat model of volume depletion was induced by two 20 mg/kg intraperitoneal injections of furosemide (at 0 and 8 h), and maintained for 24 h by placing the animals on a sodium-deficient diet. Volume depletion was confirmed by a BUN:serum creatinine ratio ≥ 20.
RNA isolation
Kidneys were cut in half in the transverse plane; half of each kidney was minced and incubated in ≥ 20 volumes of RNAlater (Ambion, Austin TX) overnight; after removal of RNAlater, kidneys were stored at −80°C. After homogenization in TRIZOL reagent (Invitrogen, Carlsbad CA), total RNA was isolated according to the manufacturer's protocol, resuspended in DEPC-treated water, and further purified using a RNeasy Mini kit (Qiagen, Valencia CA). The RNA from each half-kidney was purified on 5 minicolumns, and serial elution was used to keep the RNA concentration high without precipitation or evaporation. The quality and quantity of extracted RNA samples were determined with an Agilent 2100 Bioanalyzer Automated Analysis System “Lab-on-a-Chip” (Agilent Technologies, Palo Alto CA).
Preparation of labeled cRNA and hybridization to microarrays
Processing of the total RNA and subsequent hybridization was performed in two lots, according to the CodeLink Gene Expression Bioarray user guide (CodeLink Motorola Life Science, Northbrook IL). Five of the total RNA samples were processed in duplicate. cRNA was prepared at an automated workstation with subsequent robotic hybridization. The first and second strands of cDNA were synthesized from 5 μg of total RNA (Motorola cDNA synthesis kit, Motorola Life Science, Northbrook IL). After purification (QIAquick, Qiagen, Valencia CA), the isolated cDNA was transcribed in vitro in the presence of 2.5 mM biotin-11-UTP (Motorola IVT kit, Motorola, Northbrook IL) to produce biotin-labeled cRNA, followed by purification (RNeasy kit, Qiagen, Valencia CA). The amount and quality of cRNA was assessed by spectrophotometry. A total of 10 μg of the cRNA product was fragmented at 94°C, 20 min, followed by hybridization to CodeLink Rat Unigene Set microarrays (Motorola Life Science, Northbrook IL), containing 30-mer oligonucleotides corresponding to 9911 genes. Hybridization was performed in an Innova 4080 shaker at 37°C, 300 rpm for 18 h. After washing, each microarray was incubated with Streptavidin-Alexa Fluor 647 (Molecular Probes, Eugene OR) for 30 min at room temperature. Each microarray was then washed in 0.1 M Tris-HCl, pH 7.6, 0.15 M NaCl and 0.05 % Tween-20, and then scanned (GenePix 4000B scanner, Axon Instruments, Union City CA).
Microarray data analysis
The scanned data was processed by CodeLink Expression Analysis Software (Motorola Life Science, Northbrook IL) and the signal intensity of all genes on a microarray was normalized by median centering within each microarray. Genes with missing values were removed (9251 remaining), and the signal intensities were log2 transformed. Quality control was initially assessed by a histogram analysis (S-PLUS software, Insightful, Seattle WA), correlation analysis of all possible pairs (S-PLUS), and confirmed by Bland-Altman analysis (3) (S-PLUS) and Principal Component Analysis (PCA, Partek Pro software, Partek, St. Charles MO). PCA is a method used to transform gene expression information into variance-based information. Even though 9251-dimensional gene space is converted into 9251 principal components, the first 3 principal components contain most of the variance-based information and can be visualized in 3 -dimensional space (17). Because the results from the first and second microarray lots were dramatically different (see Fig. 1) and the second lot had larger animal-to-animal variation, the second lot was lot normalized on a gene-by-gene basis to equalize the normal genes in both lots as following:
We discovered that a dissimilarity matrix (Euclidian distance heatmap, Partek Pro) allowed us to rapidly assess the overall quality of each microarray, and this analysis also provided an initial estimate of microarray clustering (Figure 2A). This resulted in removal of 3 microarrays (8% of 36 microarrays processed) from the analysis. Differences between treatment groups was assessed using 1- and 2-variable ANOVA (Partek), and BRB ArrayTools (http://linus.nci.nih.gov/BRB-ArrayTools.html), and confirmed visually by Cluster and TreeView (9), not shown. Successful lot normalization was confirmed by PCA (Figure 2B), and Cluster and TreeView (not shown), as all normal and disease groups clustered appropriately when all 9251 genes were used. Complete data are available in the Gene Expression Omnibus (GEO) database under the accession number GSE3219 (GPL368 microarray).
Figure 1.
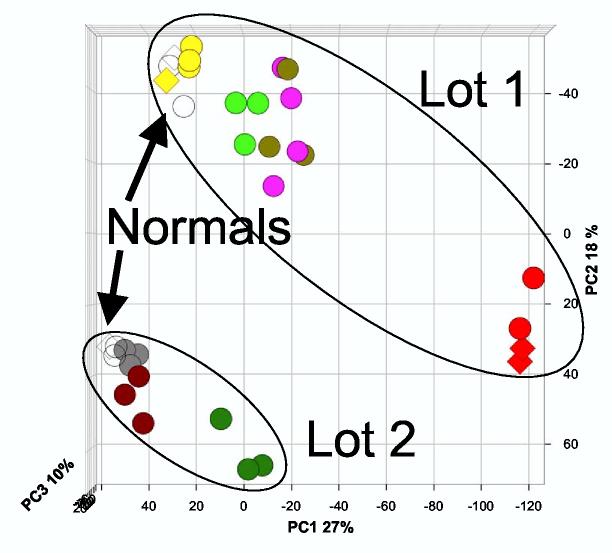
Principal Component Analysis of median centered microarrays from two microarray hybridizations/lots. Median-centered microarray intensity values for 9251 genes were log2 transformed and PCA was performed by Partek Pro. Biological groups are denoted by different colors, and normals are open circles. The first principal component (PC1) accounted for 27% of the variation, PC2 accounted for 18% of the variation, and PC3 accounted for 10% of the variation. Only normal rats were analyzed in both hybridizations/lots. Biological groups are denoted by the following colors: normal, white; volume depletion, yellow; sham, gray; ischemia/reperfusion 2h, purple; ischemia/reperfusion 8h, red; mercuric chloride 2h, light green; mercuric chloride 8h, dark green. Duplicates (RNA from one rat is hybridized to two microarrays) are denoted by diamonds.
Figure 2.
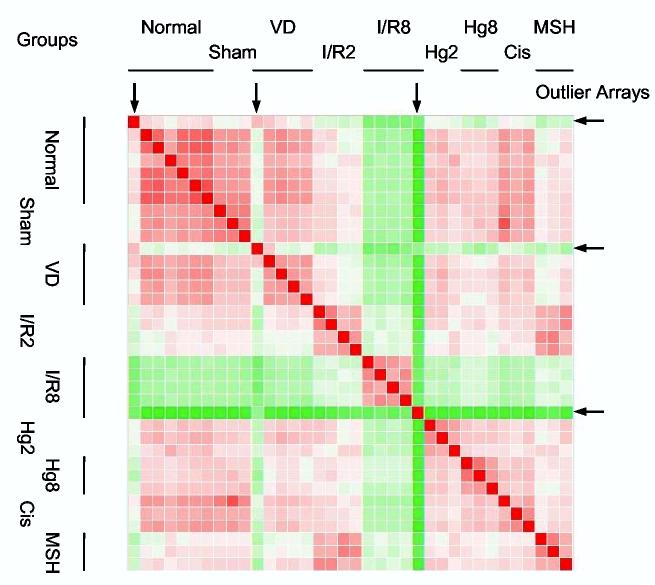
Dissimilarity matrix (Euclidian distance heatmap) after lot normalization of microarrays with the mean microarray intensity of the normal groups for each microarray experiment/lot. Red squares depict similarity, and green squares depict dissimilarity. Arrows indicate outlier microarrays that were subsequently removed from the dataset.
Power analysis
To verify the validity of the t-tests, we performed a post-hoc power analysis for the following comparisons: normal vs. ischemia/reperfusion 2h, normal vs. ischemia/reperfusion 8h, normal vs. mercuric chloride 2h, and normal vs. mercuric chloride 8h. Using SigmaStat software (Systat, Point Richmond CA), we set alpha at 0.05 and power (1- beta) at 0.8, and determined the range of standard deviations of the differences (between normal and each injury group) that would be adequately powered. We then calculated each gene-specific pooled standard deviation of the differences with the following equation:
, where nl denotes normal and i denotes injury.
Annotations
We used UniGene (NCBI Entrez) and the Genome Annotation Tool from the Rat Genome Database (http://rgd.mcw.edu/gatool/) to search for obvious functional groupings of genes in our gene lists, using GO annotations and RGD annotations. Pathway and interaction analysis was performed using Pathways Analysis (Ingenuity Systems, Mountain View, CA)
Real-time RT-PCR
To validate the microarray data, TaqMan quantitative real time reverse transcriptase polymerase chain reaction (RT-PCR) was performed for 10 selected rat genes with published intron-exon boundaries. TaqMan primer/probe sets were designed using Primer Express software version 2.0 (Applied Biosystems, Foster City, CA) based on the sequences from GenBank and listed in Supplemental Table S2. TaqMan probes were labeled with 6-carboxy-fluorescein (FAM) as a reporter dye and 6-carboxy-tetramethyl-rhodamine (TAMRA) as a quencher dye. Ribosomal RNA (18S subunit) was simultaneously detected (TaqMan ribosomal control reagent, Applied Biosystems, Foster City, CA) as an internal control to normalize all the data. Real time RT-PCR was performed in a two-step process. Total RNA (1.2 μg) was reverse transcribed in a 60 μl reaction volume containing RT buffer, 5.5 mM MgCl2, 500 μM of each dNTP, 2.5 μM random hexamer, 0.4 U/μL RNase inhibitor, and 3.125 U/μL MultiScribe Reverse Transciptase (TaqMan Reverse Transcription Reagents, Applied Biosystems, Foster City, CA) at 25°C for 10 min, 48°C for 30 min, and 95°C for 5 min. The real time PCR was run in triplicate on the ABI 7900 Sequence Detection System (Applied Biosystems, Foster City, CA) under default conditions (40 cycles of 95°C, 15 sec and 60°C, 1 min). Each well contained 2μl of cDNA; TaqMan® Universal PCR Master Mix; 50 nM, 300 nM, or 900 nM of primers (50 nM each for 18S); and 100 nM or 200 nM of probe. Abundance of each gene was determined relative to the abundance of 18S. The dynamic range of each primer/probe set was verified by serial 2-fold dilution of cDNA template. The slope of the plot (log2(dilution) vs. Ct) was used as the amplification factor for the following equation:
Western blotting
Rats were treated with sham surgery, ischemia/reperfusion surgery, or mercuric chloride injection (as above), and blood and kidneys were collected at 8 or 24 h. Serum creatinine was determined by picric acid assay. Rat kidneys were homogenized in T-PER (Pierce, Rockford IL) containing CompleteMini protease inhibitor cocktail (Roche, Indianapolis IN) at 4°C, centrifuged, and the protein concentration of the homogenate was determined by BCA assay (Pierce). Samples were diluted to 1.5 mg/ml, and 15 μg of protein were aliquoted to tubes containing an equal volume of 2X Laemmli buffer (Bio-Rad, Hercules CA) containing 200 mM dithiothreitol. Aliquots were stored at −80°C. After thawing, aliquots were heated to 95°C for 3 min, electrophoresed, transferred to PVDF membranes, and blocked with 5% nonfat dry milk in Tris-buffered saline with 0.1% Tween-20 (TBS-T) for 1 h at 4°C. Membranes were then probed with rabbit primary antibody (HO-1, Chemicon, Temecula CA; ATF-3, Santa Cruz Biotechnology, Santa Cruz CA) in blocking buffer overnight at 4°C, washed in TBS-T, and incubated with anti-rabbit secondary antibody conjugated to horseradish peroxidase (Jackson ImmunoResearch Laboratories, West Grove PA) for 2 h. After washing in TBS-T, membranes were incubated in ECL-Plus reagent (Amersham, Piscataway NJ) and chemiluminescence was detected on BioMax MR film (Kodak, Rochester NY). Membranes were stripped by incubation at 50°C for 30 min in 62.5 mM Tris pH 6.8, 2% SDS, and 100 mM beta-mercaptoethanol. A lack of signal after ECL incubation was verified, then membranes were reprobed with monoclonal anti-rat beta-tubulin (United States Biological, Swampscott MA) and anti-mouse secondary antibody conjugated to horseradish peroxidase (Jackson ImmunoResearch Laboratories). Bands were quantitated by ChemiImager 4400 with v.5.04 software (Alpha Innotec, San Leandro CA).
Immunohistochemistry
Kidneys were fixed in 10% neutral buffered formalin overnight, embedded, sectioned (4μm), deparaffinized and hydrated, treated with hydrogen peroxide (0.3%), blocked with 1% bovine serum albumin (Sigma, St. Louis MO), followed by incubation with the same rabbit primary antibody described above for 1h. After washing, slides were incubated with goat anti-rabbit secondary antibody conjugated with horseradish peroxidase (Vector Laboratories, Burlingame CA), followed by washing and development with diaminobenzidine (Sigma). Slides were then counterstained with hematoxylin, dehydrated, and mounted.
RESULTS
Quality control
In a pilot study we assessed the reproducibility of the CodeLink microarray platform at the labeling and hybridization steps by processing a single normal kidney RNA sample (Promega, Madison WI) with duplicate labeling reactions and triplicate hybridizations for a total of six microarrays. We found that the overall coefficient of variation was 12%, and 70% of that variation was attributable to the hybridization step (data not shown).
Our gene expression analysis of rat kidney RNA was performed in two sessions; labeling and hybridization were performed simultaneously on 24 microarrays from Lot 1 and later on 12 microarrays from Lot 2. These lots contained the same microarray elements, but were manufactured during different printing runs. After each microarray was median centered (where the hybridization intensity for each gene in a microarray was multiplied by a scaling factor for that array, so that the median intensity became 1), a Principal Component Analysis (Figure 1) and a hierarchical cluster analysis (data not shown) revealed a large discrepancy between the two lots of microarrays, even among normal animals. The variation between the two lots exceeded the variation between biological replicates. The microarrays were “lot normalized,” using the mean of the microarrays for normal rats in each lot (n = 4 for Lot 1, n = 3 for Lot 2, see Materials and Methods). We then searched for outliers. Dissimilarity matrix (Figure 2), histogram (Supplemental Figure 1), and Bland-Altman analyses (3) (Supplemental Figure 2) gave the same result, that there were three outlier microarrays (a normal, a volume depletion, and an ischemia/reperfusion 8h), which we removed from further analysis. The three analyses also revealed that two biological groups, cisplatin 2h and ischemia/reperfusion + α-MSH 2 h were not different than their corresponding control microarrays. We removed these groups from further microarray analysis. After lot normalization (see Materials and Methods ) and removal of outlier microarrays and groups, the PCA (Figure 3) and hierarchical clustering (Supplemental Figure 3) analyses were repeated, with improved outcomes (n = 4, normal; 3, sham; 4, volume depletion; 4, ischemia/reperfusion 2h; 2, ischemia/reperfusion 8h; 3, mercuric chloride 2h; 3 mercuric chloride 8h). The normal groups from Lot 1 and Lot 2 were indistinguishable by either method, and the volume depletion and sham control rats were segregated with normal rats. However, the PCA and hierarchical clustering analyses classified the injury groups differently. Hierarchical clustering showed more segregation by time (2h vs. 8h) than type of injury (ischemia/reperfusion vs. mercuric chloride (Supplemental Figure 3). In contrast, PCA indicated that the mercuric chloride groups were closer to each other and to the normal/sham/volume depletion groups, and the ischemia/reperfusion groups are farthest from each other and from the normal/sham/volume depletion groups (Figure 3). These results may be attributed to the different distance metrics used by the two methods.
Figure 3.
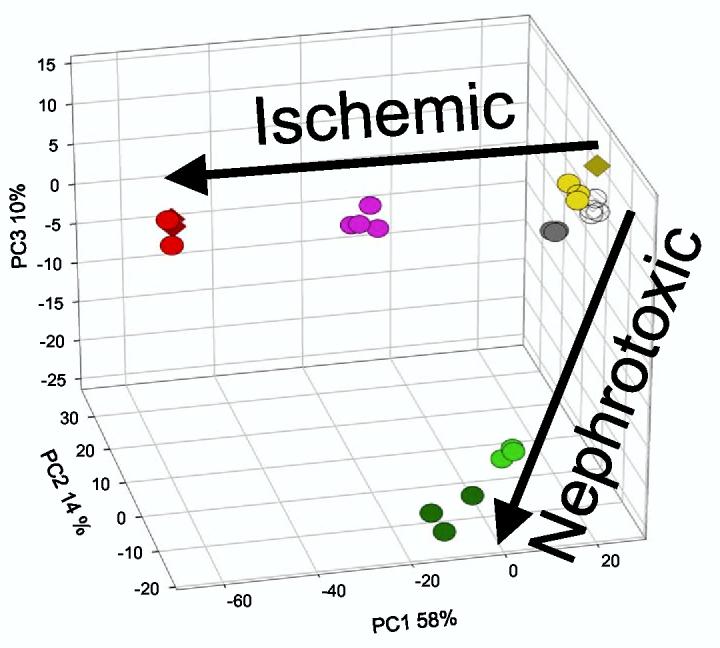
Principal Component Analysis of genes filtered by one-way ANOVA. The cutoff for gene selection was set at p < 0.001 using the Dunn-Sidak correction (uncorrected p-values were < 10−7). The three-dimensional plot was rotated to highlight the ischemic and nephrotoxic trajectories. The first principal component (PC1) accounted for 58% of the variation, PC2 accounted for 14% of the variation, and PC3 accounted for 10% of the variation. Symbols are the same as in Fig. 1.
Filtering
Two methods of filtering were applied to the lot normalized dataset (without outliers). After removing duplicate microarrays, an unsupervised one-way ANOVA was applied to the remaining 22 microarrays, using a Dunn-Sidak corrected p-value of < 0.001 as a cutoff. The resulting 615 genes were subjected to PCA, and the first three principal components accounted for 58% + 14% + 10% (82% total) of the variation (Figure 3). A clear distinction between ischemic and nephrotoxic trajectories was visible when the axes are rotated (Figure 3). Because each of the treatment groups were distinct by PCA, we performed a two-stage filtering protocol, where the first stage was an unsupervised ANOVA with a less stringent cutoff of p < 0.05 (Dunn-Sidak), resulting in 1596 genes, followed by a series of prespecified t-tests between the normal group and each injury group, with a cutoff of p < 0.01 combined with a 2-fold change in the mean level of gene expression. The two-stage filtering protocol culminated in a total of 728 genes, which were categorized by individual or combined conditions and summarized in Table 1. Each condition or combination was expressed as exclusive of other groups, or non-exclusive. Post-hoc power analysis confirmed that this was a valid approach, where 98.8% (ischemia/reperfusion 2h vs. normal), 96.6% (ischemia/reperfusion 8h vs. normal), 98.2% (mercuric chloride 2h vs. normal), and 98.7% (mercuric chloride 8h vs. normal) of the genes had a power of ≥ 80% to detect a 1 log (2-fold) difference. This high percentage of genes is consistent with the tight clustering of biological replicates in the PCA (Fig. 3).
Table 1.
Distribution of genes among treatment groups and combinations of groups
| Individual Groups | ||
| Group | Hits | Exclusive |
| Sham | 0 | 0 |
| Volume Depletion | 9 (2) | 0 |
| Ischemia/Reperfusion 2h | 250 (21) | 109 (16) |
| Ischemia/Reperfusion 8h | 473 (237) | 308 (191) |
| Mercuric Chloride 2h | 96 (29) | 20 (9) |
| Mercuric Chloride 8h | 216 (76) | 70 (30) |
| Combinations | ||
| Group | Hits | Exclusive |
| Ischemia/Reperfusion | 102 (3) | 61 (3) |
| Mercuric Chloride | 62 (15) | 17 (6) |
| Early Injury (2h) | 43 (1) | 8 (0) |
| Late Injury (8h) | 98 (40) | 47 (31) |
| All Injury Groups | 23 (0) | |
Legend: For each group or combination, the number of genes is expressed as either inclusive of other groups (Hits) or exclusive of other groups (Exclusive). Numbers of downregulated genes are in parentheses.
Gene lists and annotations
The full gene lists are shown in Supplemental Table S1, and displayed graphically as a Venn diagram in Fig. 4. Several features of these gene lists are immediately evident. The ischemia/reperfusion 8 h group was the largest, implicating an extensive, orchestrated program of gene expression in response to injury. Similarly, a larger number of genes were involved in the response to ischemia/reperfusion than mercuric chloride injury. The overlap between ischemia/reperfusion and mercuric chloride are responsible for a larger percentage of the mercuric chloride response than the ischemia/reperfusion response. Twenty-three genes were found in all four groups, reflecting a lack of a unifying theme to acute renal injury. Annotations were retrieved from two sources to reduce the complexity of individual gene analysis into functional groups. The Unigene annotations covered 448 (62%) of the genes and were useful in filtering out questionable annotations (such as similarity to a bacterial gene, with no eukaryotic orthologs), but had limited functional annotations. The Gene Annotation Tool (Rat Genome Database) covered 328 (45%) of the genes, but the annotations were more detailed, including Gene Ontology information. In general, there was a widespread representation of functions within the entire set of genes, but when gene lists for individual or combined conditions (Venn diagram) were examined, there was no further discrimination of gene functions; similarly, genes exclusive to one condition, when compared with the non-exclusive gene list, did not provide immediate insight as to what made it unique. Therefore, the transcriptomic responses to acute injury do not appear to coincide with any particular canonical pathway. There was a general increase in the percentage of down-regulated genes at 8 hours compared to 2 hours. However, there was still no discrimination of gene functions when up-regulated and down-regulated genes were examined.
Figure 4.
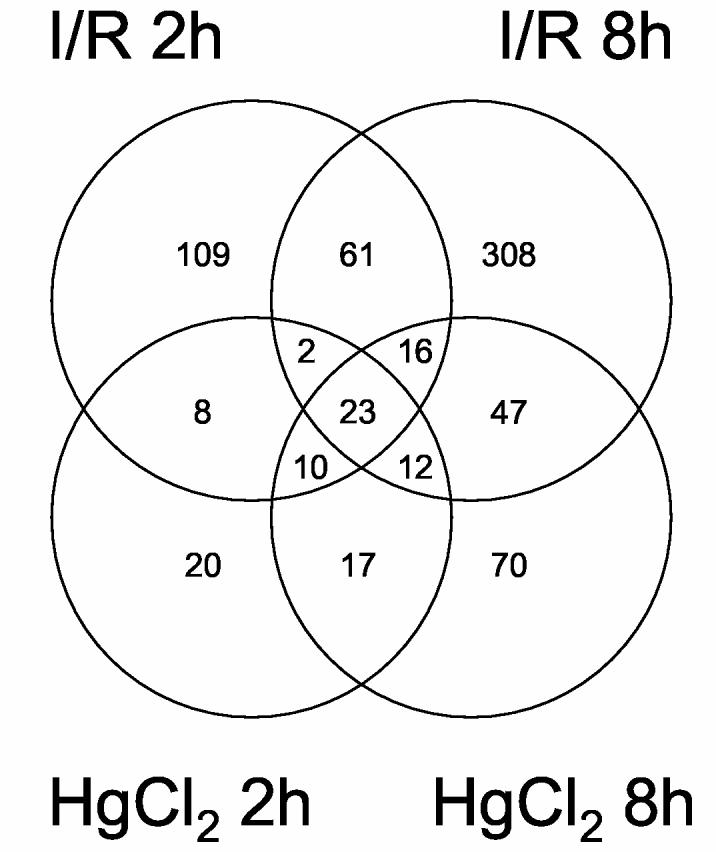
Venn Diagram of t-test results. Data was filtered by one-way ANOVA with a cutoff of p < 0.05 using the Dunn-Sidak correction (leaving 1,596 genes), followed by t-tests with cutoffs of mean 2-fold change and p < 0.01, using a multiple comparison correction. Two overlapping areas could not be shown graphically: 21 genes restricted to mercuric chloride 8 h and ischemia/reperfusion 2 h; and 4 genes restricted to mercuric chloride 2 h and ischemia/reperfusion 8 h.
Gene expression validation
We determined the validity of the microarray data because of a) the surprising lack of functional cohesion around defined pathways, b) the large number of genes on our lists, relative to other ARF microarray studies, c) the presence of genes typically restricted to other tissues (for example, cardiotrophin I, visinin, or neuropeptide Y receptor), and d) the regulation of only one gene within a multigene protein complex (for example, nicotinic cholinergic receptor β3 subunit). There are several plausible biological explanations for these observations, but a technical issue such as cross-hybridization would be more troubling. Therefore, we used a TaqMan assay on ten selected genes from our lists, with a broad range of basal and injury-induced expression levels. Each of these genes had well-defined intron-exon boundaries that served as a basis to design TaqMan primers and probes (Supplemental Table S2).
The overall correspondence between gene expression levels by microarray and by TaqMan was good, with an intercept close to zero and a correlation coefficient of 0.91. While the aggregate data validated the microarray, a few of the genes formed a distinct line with approximately the same slope, but with an intercept shifted rightward on the x-axis. Therefore, a subset of genes may have significantly increased expression by TaqMan, but have undetectable changes in expression by microarray. This gene-to-gene variation may be attributable to sequence-specific factors; for example, the labeled cRNA may hybridize to a microarray element for a given gene that is a few hundred base pairs from the corresponding TaqMan primers and probe. The efficiency of reverse transcriptase over this intervening sequence, and/or other factors, could contribute to the discrepancies. Nevertheless, our results support the accuracy by which the Codelink microarray represents gene expression.
Pathway Analysis
Because hybridization artifacts could not account for the lack of cohesive functions from our manual annotations, we sought a more robust analysis to uncover potential interactions between genes that may not fall neatly into functional categories. We used Pathways Analysis software (Ingenuity Systems), which is described in more detail in the supplementary material. In summary, we found no unifying ARF transcriptomic response beyond what is already known. We could not affix any network of genes that made any of the injury conditions unique. We also could not find distinct pathways for any combination of conditions, such as ischemia/reperfusion vs. mercuric chloride or early vs. late injury. There were clear differences in which pathways corresponded to each group or combination of groups, but there did not appear to be coordinated regulation within these pathways.
In several cases the microarray data was the opposite of what is predicted by the Ingenuity software. These discrepancies may be due to the limitations of the Ingenuity software, the Codelink microarray, and/or our current knowledge of networks.
Validation by Western Blotting and Immunohistochemistry
Because cross-hybridization was unlikely to explain the relative lack of functional organization in our gene lists, we extended our validation to western blotting to determine protein levels. A transcriptomic response to injury acts as a surrogate biomarker profile, as the changes in transcript levels typically do not directly lead to functional changes. It is generally presumed that changes in transcript levels can lead to corresponding changes in translation of a protein that contributes to the resulting response, however, there can be substantial differences between mRNA levels measured on microarrays and protein levels measured by western blot (5, 6) or proteomic methods (6, 23).
We initially examined several proteins by western blot that corresponded to up- or down-regulated genes, and found that several did not change in their abundance: Dual specificity phosphatase 5, Annexin A1, Solute carrier family 21, member 1 (Slc21a1)/OATP1, Insulin-like growth factor binding protein 5 (Igfbp5), Thioredoxin reductase 1 (Txnrd1), Dual specificity phosphatase 5, MyD116, and ADAMTS-1 (not shown).
We then focused on two proteins that were present in all four of the injury gene lists, heme oxygenase-1 (HO-1) and activating transcription factor 3 (ATF3). We chose 8 and 24 h time points for measurement, as the lag time between an increase in transcription and a consequent increase in translation are inevitably different from gene to gene. As these genes were up-regulated at both early and late time points, synchronization of the time courses is less critical. ATF3 is a transcription factor that can heterodimerize with several transcription factors, including c-Jun, as well as homodimerize. Several types of injury can upregulate the transcription of ATF3, including renal ischemia/reperfusion injury (42). In a heterodimeric form, ATF3 can be a transcriptional activator, but as a homodimer ATF3 can be a transcriptional repressor (12). Furthermore, ATF3 can bind to the promoter of HO-1 (1), but it is not clear what effect ATF3 has on HO-1 induction. If ATF3 were indeed upstream of HO-1, increases in ATF3 mRNA levels could be expected to precede or even coincide with increases in HO-1, but HO-1 should not precede ATF3.
The microarray results predict the highest increases in HO-1 induction with mercuric chloride (2h, 79-fold; 8h, 90-fold) and large increases after ischemia/reperfusion (2h, 10-fold; 8h, 22-fold). We detected clear increases in HO-1 protein levels by western blotting with mercuric chloride at both time points, however we could not detect HO-1 after sham treatment or ischemia/reperfusion at either time point (Figure 6A,B). These results suggest that relatively high levels of HO-1 induction are needed to affect HO-1 protein levels.
Figure 6.
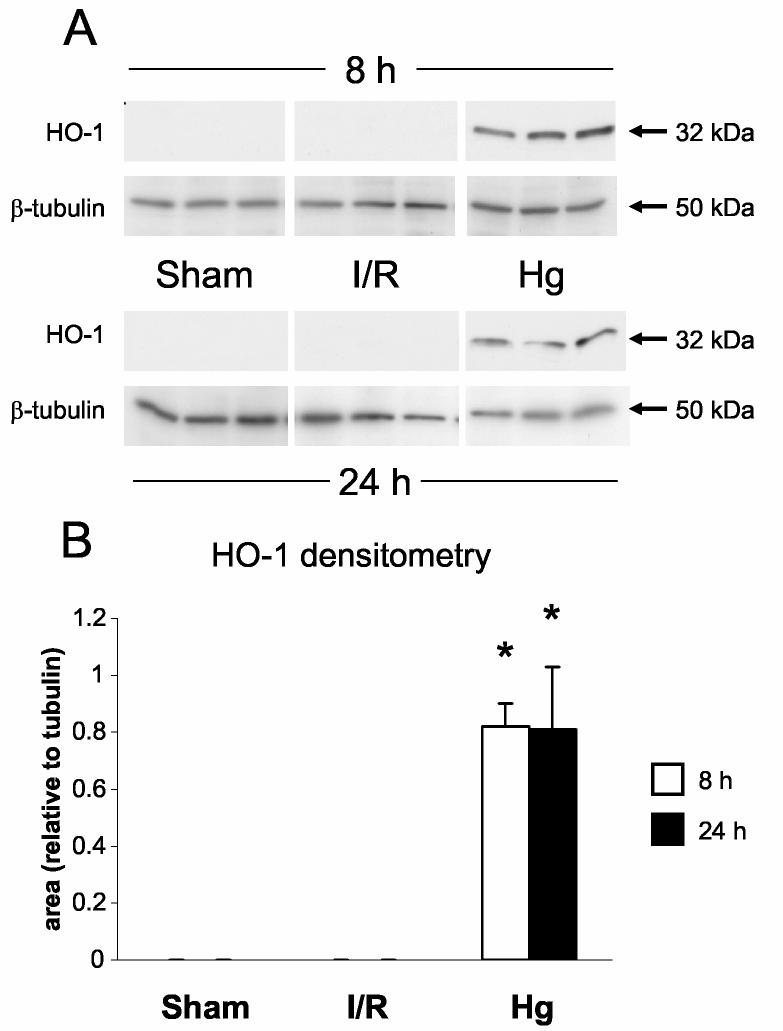
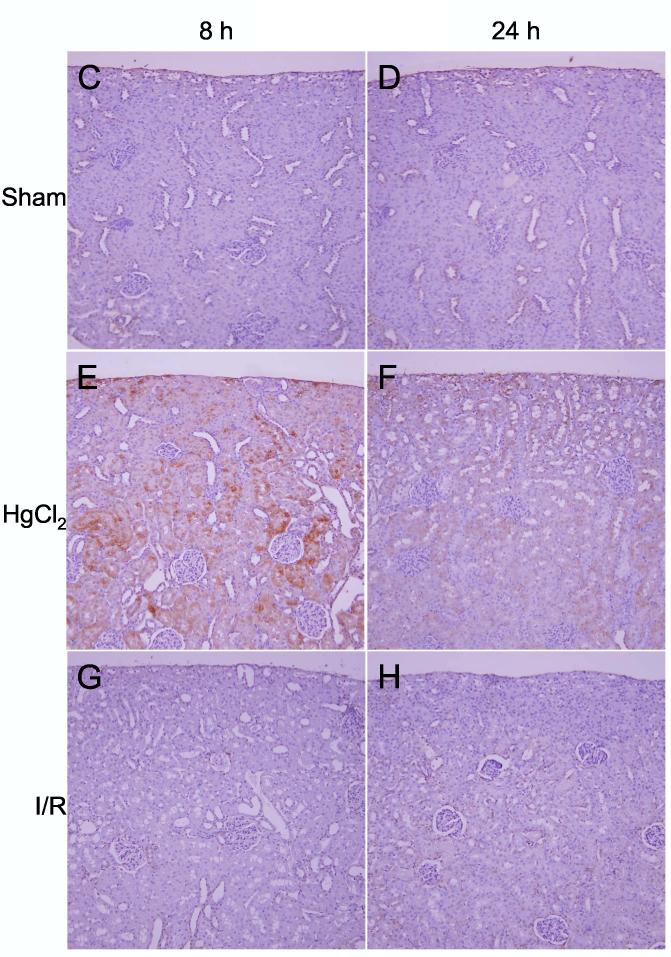
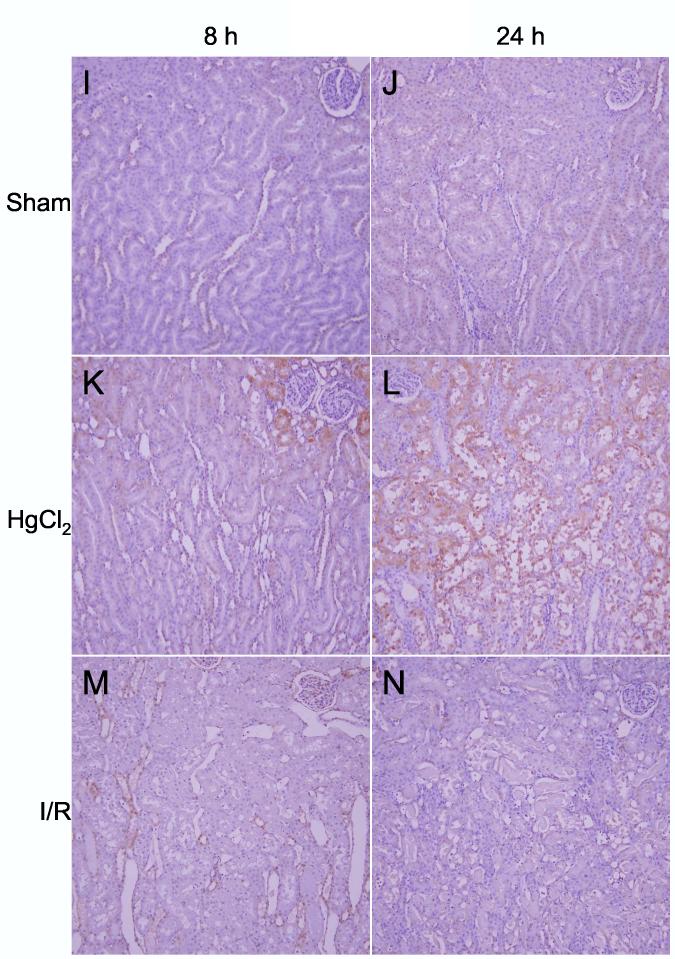
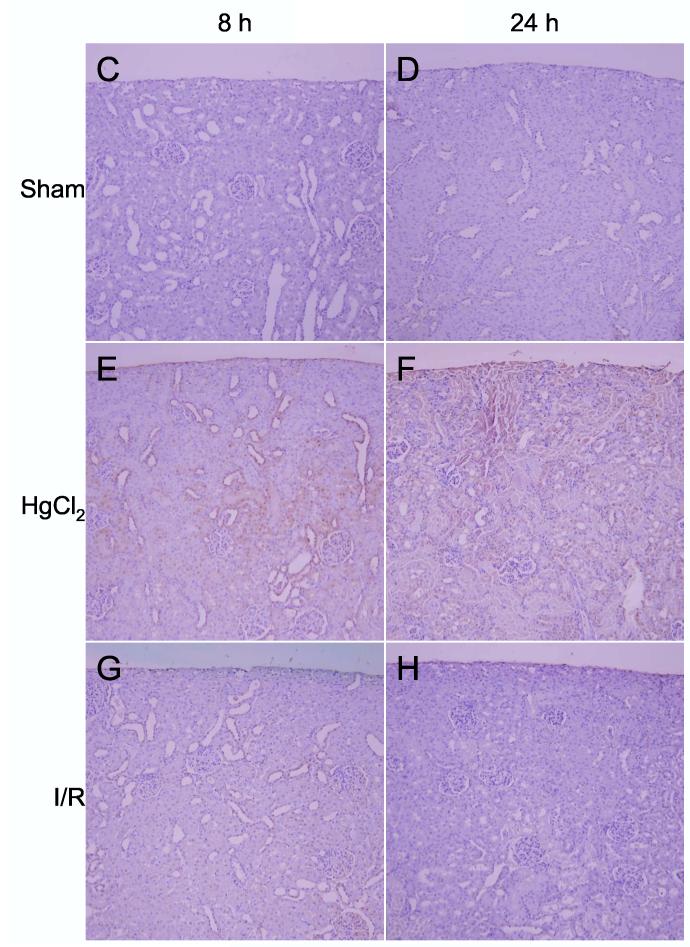
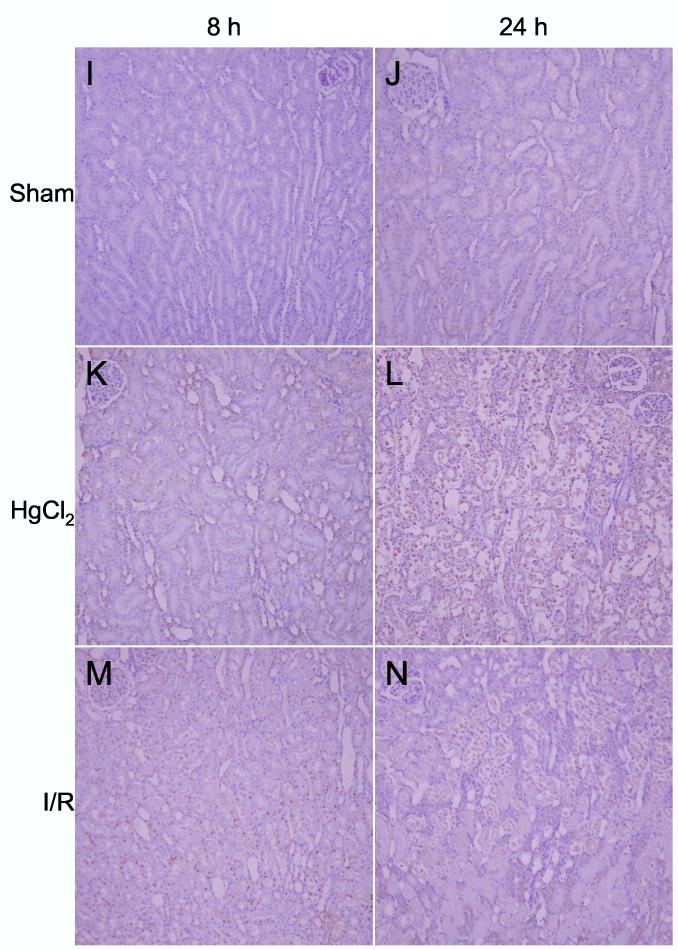
Detection of heme oxygenase-1 protein. A: Western blots of HO-1 and β-tubulin in kidneys from sham, ischemia/reperfusion injury, and mercuric chloride-treated rats sacrificed at 8 or 24 h post-insult. HO-1 is depicted in the upper panels, and β-tubulin (after stripping and reprobing of membranes) is depicted in lower panels (n = 3 rats). B: Densitometry of western blots in panel A, normalized for β-tubulin, open bars: 8 h, closed bars: 24 h. *p < 0.05, n = 3 rats. C-N: Immunohistochemistry of HO-1 (all images are oriented with the exterior of the kidney at the top) in cortex (C-H) outer stripe of the outer medulla (I-N). C,I: sham 8 h; D,J: sham 24 h; E,K: mercuric chloride 8 h; F,L: mercuric chloride 24 h; G,M: ischemia/reperfusion 8 h; H,N: ischemia/reperfusion 24 h.
By immunohistochemistry HO-1 was widely present in cortical tubules at 8 h (Figure 6E) after mercuric chloride, but surprisingly almost completely absent at 24 h (Figure 6F). In contrast, HO-1 staining in the outer stripe of the outer medulla was not detected at 8 h (Figure 6K), but was extensive at 24 h after mercuric chloride treatment, especially in the necrotic areas of the proximal tubules, primarily in detaching cells (Figure 6L). This staining was specific because a different primary antibody and the same secondary antibody did not stain these cells in sections from the same rats (data not shown). In contrast, no HO-1 was detected after ischemia/reperfusion by immunohistochemistry (Figure 6G,H,M,N), in agreement with western blotting results (Figure 6A), except light, sporadic staining in other tubules, perhaps thick ascending limb or dilated collecting ducts, at 8 h after ischemia/reperfusion (Figure 6M). Therefore, after mercuric chloride HO-1 induction changed almost completely from an early cortical distribution to a late distribution in the OSOM. This shift in staining has not been described previously, and provides an important insight that cannot be appreciated by microarray or western blot.
By western blot, ATF3 protein levels increased transiently 8 h after ischemia/reperfusion, but returned to levels that are not significantly different from sham at 24 h. At both 8 h and 24 h after mercuric chloride treatment, the amount of ATF3 protein was approximately the same as 8 h after ischemia/reperfusion (Figure 7A,B). By this data alone, ATF3 does not distinguish between mercuric chloride and ischemia reperfusion at 8 h, nor does it distinguish between early and late mercuric chloride injury. However, at 24 h ischemia/reperfusion vs. mercuric chloride have clearly divergent ATF3 protein levels.
Figure 7.
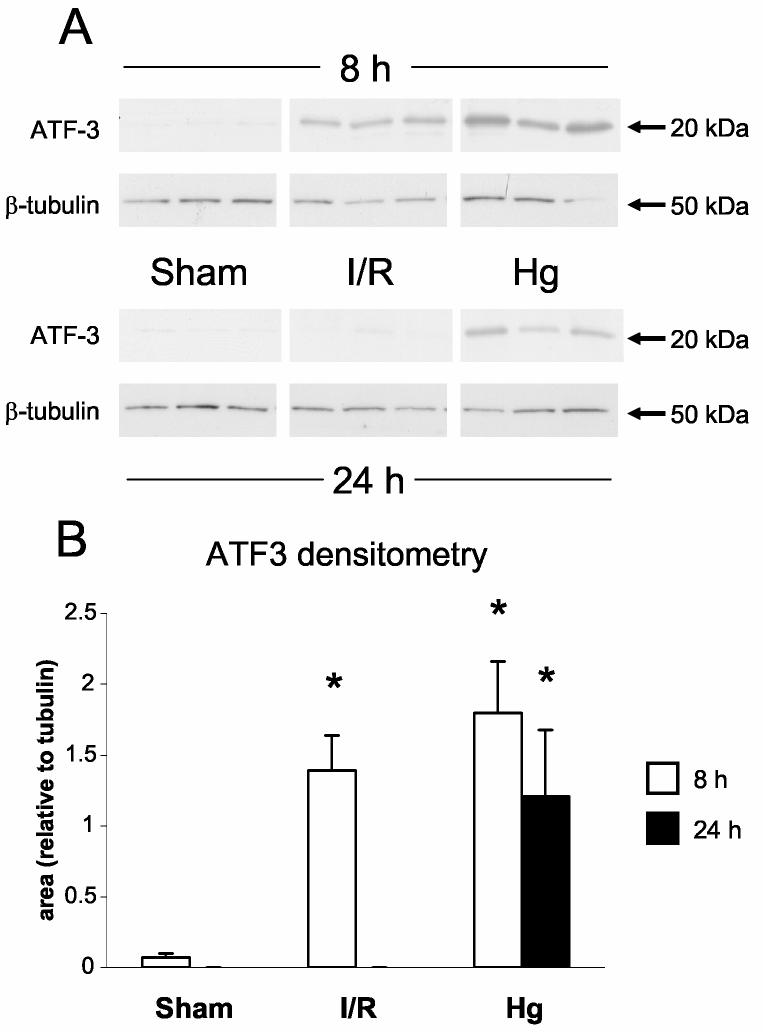
Detection of activating transcription factor-3 protein (ATF3). A: Western blots of ATF3 and β-tubulin in kidneys from sham, ischemia/reperfusion injury, and mercuric chloride-treated rats sacrificed at 8 or 24 h post-insult. ATF-3 is depicted in the upper panels, and β-tubulin (after stripping and reprobing of membranes) is depicted in lower panels (n = 3 rats). B: Densitometry of western blots in panel A, normalized for β-tubulin, open bars: 8 h, closed bars: 24 h. *p < 0.05, n = 3 rats. C-N: Immunohistochemistry of ATF-3, same as in Figure 6.
After mercuric chloride treatment ATF3 could be detected by immunohistochemistry in some of the nuclei of cortical tubules at 8 h (Figure 7E); the protein expression then shifted to the OSOM at 24 h, only in detaching cells (Figure 7L). Thus, immunohistochemistry agreed with western blotting after mercuric chloride treatment, but also revealed that equivalent amounts of protein corresponded to different localization (cortex at 8 h and OSOM at 24 h). After ischemia/reperfusion there was widespread staining of nuclei throughout the proximal tubules in the OSOM 8 h after ischemia/reperfusion (Figure 7M), but not at 24 h (Figure 7N). Therefore, ATF3 staining paralleled HO-1 staining in that mercuric chloride induced a similar amount of protein at early vs. later times that was distributed quite differently: cortical tubule cells with a normal histological appearance at the early time vs. detaching tubule cells in the OSOM at the later time. Unlike HO-1 staining, ATF3 staining gave an additional dimension of discrimination between early and late responses to ischemia/reperfusion. Our immunohistochemistry results are summarized in Table 3.
Table 3.
Summary of Immunohistochemistry results
| Early | Late | |
|---|---|---|
| Mercuric Chloride | ||
| HO-1 | Cortex proximal tubule healthy cells | OSOM proximal tubule detaching cells |
| ATF3 | Cortex proximal tubule nuclei of healthy cells | OSOM proximal tubule detaching cells |
| Ischemia/reperfusion | ||
| HO-1 | Cortex proximal tubule (sporadic, infrequent) | None |
| ATF3 | OSOM proximal tubule nuclei of healthy cells | None |
DISCUSSION
Microarrays clearly distinguish between nephrotoxic and ischemia/reperfusion injury
DNA microarrays have been used in several studies as a tool to discover biomarkers and potential therapeutic targets for acute renal failure. While others have studied either nephrotoxins or ischemia/reperfusion, we directly compared the two types of injury. Our time course, 2 and 8 h post-injury, is the earliest among the ARF microarray studies, although one study examined 3 and 12 h time points (36) after ischemia/reperfusion. Principal component analysis of our data clearly demonstrates that the microarray is excellent for identifying global expression trends that distinguish one type of injury from another (Fig. 3). After mercuric chloride, the rat kidney transcriptomes travel along a clear trajectory in a time-dependent manner, and after ischemia/reperfusion the transcriptomes travel on a different trajectory, also in a time-dependent manner. However, microarrays would be impractical for the clinic for at least three reasons: the difficulty of obtaining biopsy specimens, the expense of microarrays, and the length of time to perform the assay. Given these barriers, can the information in the trajectories be distilled into a more manageable assay, perhaps a small set of more accessible biomarkers that could be validated? Furthermore, can the genes in these trajectories shed light on the differences in pathophysiology of nephrotoxic vs. ischemic ARF to identify new therapeutic targets?
Analysis and validation of the transcriptome response fails to distill the genes into a coherent mechanism
We took two approaches to delve deeper into the information embedded in the microarray data: dissecting the global PCA results to find out which genes were essential, or analyzing genes individually and then assembling them into meaningful groups. These approaches were complementary: from our PCA results we found that we could easily distinguish which biological group a particular microarrray corresponded to, which gave us the confidence to use t-tests between treatment groups. Conversely, our t-tests were adequately powered and gave us candidate genes to test for their contribution to the PCA trajectories. When we removed the genes from the mercuric chloride 2h exclusive list, the mercuric chloride 8h exclusive list, and the mercuric chloride exclusive list, the PCA trajectories were surprisingly unaffected (Supplemental Figure 8). Therefore, the information contained in the PCA trajectories is not confined to a few dominant genes identified by ANOVA and t-test, but spread across a large number of genes that do not necessarily change in a statistically significant manner when examined individually. While the PCA describes the different injury trajectories clearly, it cannot be readily used to identify individual genes that are responsible for the differences between the two injury types.
Despite the large number of altered genes, we unexpectedly had limited success in building coherent regulatory networks from any of our gene lists, even if the lists were partitioned further, such as up-regulated vs. down-regulated genes . This cannot be accounted for by a single source, but there may be several contributing factors. First, many of the genes in our lists have no known function, and the discovery of these functions and their corresponding relationship to existing regulatory networks may connect some of the seemingly unrelated genes in the future. Second, a protein that connects two genes in a list may not have altered transcript levels, or even protein levels, but may be post-translationally modified and/or bound to another protein to regulate a portion of the transcriptome. Third, the 2 and 8 h time points that we used to examine the transcriptome may be inadequately sampling transiently regulated genes; for example, a gene that is upregulated at 2 h may increase the mRNA level of another gene that returns to a level below statistical significance at 8 h. Finally, microarray analysis of whole kidney mRNA averages the levels found in different cell types, nephron segments, and zones of the kidney, such that a mRNA that is highly upregulated in a specific cell type may not significantly change the expression level of the kidney because it is more abundant and/or more variable in other cell types. This could explain why the PCA trajectories are retained when significantly changed genes are removed. Even if regulatory networks become more prominent in the future, it is essential to determine whether two theoretically interacting genes actually colocalize to the same cells or don't interact because they are in different cells. Such an analysis could resolve the apparently contradictory interactions that we identified (Supplementary Figure 6).
Laboratory to laboratory variation in microarray results
Several groups have performed microarray studies on ARF in animal models (2, 14, 18, 30, 36, 43, 44). We have performed a meta analysis of acute renal failure microarray studies which is summarized in Table 2, where we listed genes that appeared in at least two microarray studies. There is modest concurrence across studies. Out of 62 genes, only 17 genes were not on our gene lists. To increase the possibility of detecting known pathways, we subjected these 62 genes to Ingenuity Pathways Analysis (Supplemental Figure 7), and only one gene, collagen type IIIα1, made additional connections to networks derived from our gene lists. Collagen type IIIα1 can bind to both collagen type XVIIIα1 and collagen type Iα1. A number of technical issues may contribute to the discordance of microarray data, including the species chosen, obvious and subtle differences between injury models, timing of harvest, the microarray platform, relative coverage of the genome, potential for cross-hybridization, discrimination of alternate splice variants, quality control, RNA preparation, labeling method, normalization method, detection method, spot analysis method, data analysis data methods, and a number of other technical issues. In short, there are many steps from conceptualization of a microarray and its corresponding experiment to data analysis, each of which can be done in different ways. It is easy to attribute the wide-ranging results (2, 14, 18, 30, 36, 43, 44) to a sum of these differences, but pinpointing which steps cause the largest differences is likely to be impossible.
Table 2.
Genes identified by at least two microarray studies of ARF
| Gene name | Studies that identify gene changes after ARF | |||||||
|---|---|---|---|---|---|---|---|---|
| Cyclin-dependent kinase inhibitor 1A (Cdkn1a)/p21/WAF | A | C | D | E | G | H | ||
| Epidermal growth factor (EGF) | A | C | E | F | G | H | ||
| Clusterin (Clu) | A | B | E | F | H | |||
| A kinase (PRKA) anchor protein (gravin) 12 (Akap12) | C | D | E | H | ||||
| Heme oxygenase (decycling) 1 (Hmox1) | B | D | F | H | ||||
| Kidney injury molecule 1 (Havcr1)/KIM-1 | C | E | F | H | ||||
| Lipocalin 2 (Lcn2)/NGAL | D | E | F | H | ||||
| Afamin (Afm)/alpha-albumin | B | D | H | |||||
| Annexin A2 (Anxa2)/Calpactin I | C | E | H | |||||
| c-Fos | D | G | H | |||||
| Claudin 7 (Cldn7) | D | E | H | |||||
| Early growth response 1 (Egr1) | D | E | H | |||||
| H1 histone family, member 0 (Icam1) | E | G | H | |||||
| Heat shock 70kD protein 1A (Hspa1a)/hsp70 | D | E | H | |||||
| Interleukin 6 (Il6) | D | E | H | |||||
| Lectin, galactose binding, soluble 3 (Lgals3)/Mac-2 antigen | C | E | H | |||||
| Leukemia inhibitory factor receptor (Lifr) | C | E | H | |||||
| Metallothionein (Mt1a) | D | E | H | |||||
| Solute carrier family 9, member 3 (Slc9a3)/NHE3 | D | G | H | |||||
| Solute carrier family 16 (monocarboxylic acid transporters), member 7 (Slc16a7) | C | E | H | |||||
| CD68 antigen (Cd68) | C | D | E | |||||
| Tubulin, beta 5 (Tubb5) | C | D | E | |||||
| Activating transcription factor 3 (Atf3) | E | H | ||||||
| Adrenomedullin (Adm) | E | H | ||||||
| Alpha-2-macroglobulin (A2m) | D | H | ||||||
| Annexin A1 (Anxa1)/Lipocortin 1 | E | H | ||||||
| Aspartoacylase (Aspa) | E | H | ||||||
| CD44 antigen (Cd44) | A | H | ||||||
| Chemokine (C-X-C motif) ligand 12 (Cxcl12)/SDF-1 | E | H | ||||||
| DnaJ (Hsp40) homolog, subfamily B, member 9 (Dnajb9) | D | H | ||||||
| Eukaryotic translation initiation factor 1A (Eif1a) | E | H | ||||||
| Fibrinogen, B beta polypeptide (Fgb) | C | H | ||||||
| FK506-binding protein 1a (Fkbp1a) | B | H | ||||||
| Fos-like antigen 1 (Fosl1) | E | H | ||||||
| Growth differentiation factor 15 (Gdf15) | C | H | ||||||
| Insulin-like growth factor binding protein 5 (Igfbp5) | D | H | ||||||
| Lactate dehydrogenase A (Ldha) | D | H | ||||||
| Myelocytomatosis viral oncogene homolog (avian) (Myc)/c-Myc | A | H | ||||||
| Procollagen, type I, alpha 1 (Col1a1) | C | H | ||||||
| Ras-related associated with diabetes (Rrad) | D | H | ||||||
| Solute carrier family 30 (zinc transporter), member 1 (Slc30a1)/ZnT1 | D | H | ||||||
| Solute carrier organic anion transporter family, member 1a1 (Slco1a1)/Organic anion transporting polypeptide 1 (OATP-1) | A | H | ||||||
| Sphingosine kinase 1 (Sphk1) | D | H | ||||||
| Transgelin (Tagln) | E | H | ||||||
| Tropomyosin 4 (Tpm4) | D | H | ||||||
| Tumor necrosis factor receptor superfamily, member 12a (Tnfrsf12a) | F | H | ||||||
| V-jun sarcoma virus 17 oncogene homolog (avian) (Jun) | G | H | ||||||
| Actin, alpha 2, smooth muscle, aorta (Acta2) | C | E | ||||||
| Annexin A3 (Anxa3) | C | E | ||||||
| Aquaporin 1 (Aqp1) | D | E | ||||||
| CD14 antigen (Cd14) | D | E | ||||||
| Chemokine (C-X-C motif) ligand 1 (Cxcl1)/GRO-1 | C | E | ||||||
| Cytochrome P450, family 4, subfamily a, polypeptide 14 (Cyp4a14) | B | D | ||||||
| Growth arrest specific 2 (Gas2) | C | E | ||||||
| Insulin-like growth factor binding protein 1 (Igfbp1) | A | C | ||||||
| myosin Va | C | D | ||||||
| procollagen III | C | D | ||||||
| Procollagen, type XVIII, alpha 1 | C | E | ||||||
| Proline dehydrogenase (oxidase) 2 (Prodh2)/kidney and liver proline oxidase 1 | D | E | ||||||
| Stratifin (Sfn)/14-3-3 protein sigma | D | E | ||||||
| Uromodulin (Umod)/(uromucoid, Tamm-Horsfall glycoprotein) | B | G | ||||||
| Vascular cell adhesion molecule 1 (Vcam1) | C | E | ||||||
Predictive power of individual genes
An important link between the transcriptomic response and functional significance is converting the information from individual mRNAs into the corresponding proteins. As shown by Brooks et al. (5), microarrays do not always predict changes in protein abundance, with both false positive and false negative predictions of protein levels. We have also failed to detect changes in protein levels, by western blot, for several genes whose transcripts are predicted to up- or down-regulate by microarray: Dual specificity phosphatase 5, Annexin A1, Solute carrier family 21, member 1 (Slc21a1)/OATP1, Insulin-like growth factor binding protein 5 (Igfbp5), Thioredoxin reductase 1 (Txnrd1), Dual specificity phosphatase 5, MyD116, and ADAMTS-1 (not shown).
A number of factors may contribute to this anomaly. The dynamic nature of the transcriptomic response, such as transient up- or down-regulation of mRNA or oscillations in mRNA levels, can cause disparities when proteins are measured at a static time point. The lag time between changes in mRNA levels and increases in protein synthesis can vary widely due to diversity of gene size, transcription rates, splicing reactions, and post-transcriptional processing, as well as a diversity of proteins in terms of size, composition, abundance, dependence on chaperones, post-translational processing, and degradation. Western blotting results also may disagree with microarray results for technical reasons, such as lack of sensitivity or alternate splicing of a transcript that produces a protein that is not recognized by the detecting antibody. There may be post-transcriptional regulation by factors such as microRNAs (21, 31) that can add a layer of complexity to untangling the transcriptomic response. Finally, the contribution of a protein to function is dependent on several additional contextual factors, including subcellular compartmentalization, post-translational modification, ability to associate with other proteins, availability of substrates and cofactors, etc.
Compartmentalization of HO-1 and ATF3 in different kidney zones, nephron segments, and cell types reveals an added layer of complexity to the microarray data
Whereas the microarray signals for HO-1 and ATF3 were strongly positive, HO-1 and ATF3 proteins were regulated in a very complex fashion. For example, after mercuric chloride administration, both HO-1 and ATF3 were expressed in cortical tubules at 8 h, then shifted to the OSOM at 24 h, and were localized in more healthy appearing proximal tubule cells at 8 h and in detaching cells at 24 h. Further complicating this picture, we found that ATF3 was expressed in OSOM at 8 h, but not 24 h after ischemia/reperfusion. ATF3 was found in a smaller proportion of cells, compared to HO-1, which is consistent with a transient increase in ATF3 that wanes before HO-1 protein reaches its highest levels. Even with a more extensive time course, a causal relationship between ATF3 and HO-1 expression cannot be verified without inhibiting ATF3 induction. Because ATF3 protein is widely expressed in nuclei of proximal tubule cells in the OSOM, ATF3 induction alone is not sufficient to activate HO-1 protein expression after ischemia/reperfusion injury. Therefore, determining that a gene or its corresponding protein is upregulated may not be sufficient to understand its functional relevance; localization methods such as immunohistochemistry can provide the proper contextual framework.
From our validation data we propose the following model of mercuric chloride-induced injury: an adaptive response to mercuric chloride is rapid enough in cortical proximal tubules to protect them from injury, whereas a delayed response in the OSOM is too late to prevent acute renal failure. Alternately, the initial injury occurs in the cortical proximal tubules, and this transient injury travels down the nephron to induce further injury in the S3 segment of the proximal tubule, leading to the manifestation of acute renal failure. The latter model is consistent with electron microscopy studies that show a progression of injury along the nephron with a similar time course (10, 11, 24, 34, 39).
Limitations
The gene changes seen at 2 and 8 hour time points may have been confounded by circadian rhythms. Of the two experimental designs to minimize these effects: starting at the same time of day or sacrificing at the same time of day, we chose the former. Each design has weaknesses, depending on what may happen during the intervening 6 hours. If the first 2 hours (same starting time) are measured, downstream genes could be affected during the final 6 hours. If the final 2 hours are measured (same harvesting time), upstream regulatory processes and/or genes could be affected during the initial 6 hours.
Comparisons between the ischemia/reperfusion model with the mercuric chloride model should be made with caution. The two models are different, particularly with their time courses. Serum creatinine values are reported in Supplemental Table 3, which confirm that ischemia/reperfusion has a rapid onset, whereas mercuric chloride has a slower onset. This difference complicates the comparison of the severity of injury by the two insults; the serum creatinine at 24 hours was not significantly different (3.1 ± 0.4 mg/dl for I/R vs. 2.6 ± 0.3 mg/dl for HgCl2, p = 0.37), although this comparison is only an approximation. Histologically the extent of damage in the OSOM at 24 h was slightly higher after mercuric chloride compared to ischemia/reperfusion (Figs 6 and 7, panels L vs. N). In an effort to adjust for the different time courses, we looked for overlap between 2h I/R and 8h HgCl2, but we found only 21 genes (see legend for Fig 4).
Conclusions and future directions
Our study highlights the opportunities and bottlenecks in the workflow of gene discovery in acute renal failure, from genome to function. First, the microarray is excellent for identifying global expression trends that distinguish one type of injury from another (Fig. 3). However, distilling those global patterns into individual genes, or even pathways, has only one notable success, neutrophil gelatinase-associated lipocalin (25, 26). A large part of the problem is knowing which genes have changes in mRNA that reflect changes in protein levels. The number of proteins with high quality antibodies is relatively small, and a major effort should be undertaken to provide detection reagents as a resource to address this shortcoming. Single chain antibodies (40) and photoaptamers (4) may be useful approaches to complement conventional antibodies. In addition to eliminating false positives, some false negatives may be eliminated with approaches such as proteomics and metabolomics, then integrated with microarray data.
Our immunohistochemistry data underscores that the location of a candidate gene within the diverse cells and cell types of the kidney is essential for understanding its function. Additional false negatives may be due to the discrete localization of a gene that may be changing substantially in a small fraction of the cells, but may not change significantly when averaged over the entire kidney. Therefore, a technique such as laser capture microdissection (27) can be used to isolate RNA from a subset of cells, such as those positive for HO-1, and improve the signal to noise ratio for a given set of genes that should have some functional relationship to HO-1. In this regard, our whole kidney screen has provided some genes which we can use as a bootstrap to examine the regulatory networks within the relevant cells.
Supplementary Material
Figure 5.
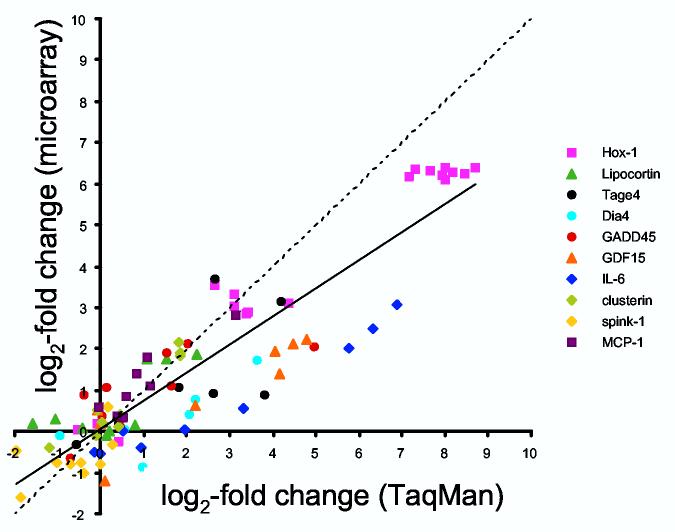
Validation of gene expression by real-time RT-PCR (TaqMan). Ten genes were chosen for relevance to ARF, known intron-exon boundaries, and range of gene expression levels. Median-centered, lot normalized microarray intensities and gene expression levels relative to 18S rRNA were both log2-transformed and expressed as log2 differences from normal. The line of equivalence is dashed, and the line of correlation is solid (slope = 0.681, intercept = 0.060, r = 0.91).
ACKNOWLEDGEMENTS
We thank Richard Proia and Yide Mi (NIDDK, NIH) for help with RNA quality analysis; Peter Munson (CIT, NIH) for advice with experimental design, statistical analyses, and reviewing the manuscript; Mary Shimoyama (Medical College of Wisconsin) for helpful annotation suggestions; and Stephen Hewitt (NCI,NIH) and Jeffrey Kopp (NIDDK,NIH) for reviewing the manuscript.
Footnotes
GRANTS
This research was supported by the Intramural Research Program of the NIH, NIDDK.
REFERENCES
- 1.Alam J, Killeen E, Gong P, Naquin R, Hu B, Stewart D, Ingelfinger JR, Nath KA. Heme activates the heme oxygenase-1 gene in renal epithelial cells by stabilizing Nrf2. Am J Physiol Renal Physiol. 2003;284:F743–752. doi: 10.1152/ajprenal.00376.2002. [DOI] [PubMed] [Google Scholar]
- 2.Amin RP, Vickers AE, Sistare F, Thompson KL, Roman RJ, Lawton M, Kramer J, Hamadeh HK, Collins J, Grissom S, Bennett L, Tucker CJ, Wild S, Kind C, Oreffo V, Davis JW, 2nd, Curtiss S, Naciff JM, Cunningham M, Tennant R, Stevens J, Car B, Bertram TA, Afshari CA. Identification of putative gene based markers of renal toxicity. Environ Health Perspect. 2004;112:465–479. doi: 10.1289/ehp.6683. [DOI] [PMC free article] [PubMed] [Google Scholar]
- 3.Bland JM, Altman DG. Statistical methods for assessing agreement between two methods of clinical measurement. Lancet. 1986;1:307–310. [PubMed] [Google Scholar]
- 4.Bock C, Coleman M, Collins B, Davis J, Foulds G, Gold L, Greef C, Heil J, Heilig JS, Hicke B, Hurst MN, Husar GM, Miller D, Ostroff R, Petach H, Schneider D, Vant-Hull B, Waugh S, Weiss A, Wilcox SK, Zichi D. Photoaptamer arrays applied to multiplexed proteomic analysis. Proteomics. 2004;4:609–618. doi: 10.1002/pmic.200300631. [DOI] [PubMed] [Google Scholar]
- 5.Brooks HL, Ageloff S, Kwon TH, Brandt W, Terris JM, Seth A, Michea L, Nielsen S, Fenton R, Knepper MA. cDNA array identification of genes regulated in rat renal medulla in response to vasopressin infusion. Am J Physiol Renal Physiol. 2003;284:F218–228. doi: 10.1152/ajprenal.00054.2002. [DOI] [PubMed] [Google Scholar]
- 6.Chen G, Gharib TG, Wang H, Huang CC, Kuick R, Thomas DG, Shedden KA, Misek DE, Taylor JM, Giordano TJ, Kardia SL, Iannettoni MD, Yee J, Hogg PJ, Orringer MB, Hanash SM, Beer DG. Protein profiles associated with survival in lung adenocarcinoma. Proc Natl Acad Sci U S A. 2003;100:13537–13542. doi: 10.1073/pnas.2233850100. [DOI] [PMC free article] [PubMed] [Google Scholar]
- 7.Claassen GF, Hann SR. A role for transcriptional repression of p21CIP1 by c-Myc in overcoming transforming growth factor beta -induced cell-cycle arrest. Proc Natl Acad Sci U S A. 97:9498–9503. doi: 10.1073/pnas.150006697. [DOI] [PMC free article] [PubMed] [Google Scholar]
- 8.de Belle I, Huang RP, Fan Y, Liu C, Mercola D, Adamson ED. p53 and Egr-1 additively suppress transformed growth in HT1080 cells but Egr-1 counteracts p53-dependent apoptosis. Oncogene. 1999;18:3633–3642. doi: 10.1038/sj.onc.1202696. [DOI] [PubMed] [Google Scholar]
- 9.Eisen MB, Spellman PT, Brown PO, Botstein D. Cluster analysis and display of genome-wide expression patterns. Proc Natl Acad Sci U S A. 1998;95:14863–14868. doi: 10.1073/pnas.95.25.14863. [DOI] [PMC free article] [PubMed] [Google Scholar]
- 10.Ganote CE, Reimer KA, Jennings RB. Acute mercuric chloride nephrotoxicity. An electron microscopic and metabolic study. Lab Invest. 1974;31:633–647. [PubMed] [Google Scholar]
- 11.Gritzka TL, Trump BF. Renal tubular lesions caused by mercuric chloride. Electron microscopic observations: degeneration of the pars recta. Am J Pathol. 1968;52:1225–1277. [PMC free article] [PubMed] [Google Scholar]
- 12.Hai T, Wolfgang CD, Marsee DK, Allen AE, Sivaprasad U. ATF3 and stress responses. Gene Expr. 1999;7:321–335. [PMC free article] [PubMed] [Google Scholar]
- 13.Heyman SN, Lieberthal W, Rogiers P, Bonventre JV. Animal models of acute tubular necrosis. Curr Opin Crit Care. 2002;8:526–534. doi: 10.1097/00075198-200212000-00008. [DOI] [PubMed] [Google Scholar]
- 14.Huang Q, Dunn RT, 2nd, Jayadev S, DiSorbo O, Pack FD, Farr SB, Stoll RE, Blanchard KT. Assessment of cisplatin-induced nephrotoxicity by microarray technology. Toxicol Sci. 2001;63 doi: 10.1093/toxsci/63.2.196. [DOI] [PubMed] [Google Scholar]
- 15.Ichimura T, Bonventre JV, Bailly V, Wei H, Hession CA, Cate RL, Sanicola M. Kidney injury molecule-1 (KIM-1), a putative epithelial cell adhesion molecule containing a novel immunoglobulin domain, is up-regulated in renal cells after injury. J Biol Chem. 1998;273:4135–4142. doi: 10.1074/jbc.273.7.4135. [DOI] [PubMed] [Google Scholar]
- 16.Johnston IM, Spence HJ, Winnie JN, McGarry L, Vass JK, Meagher L, Stapleton G, Ozanne BW. Regulation of a multigenic invasion programme by the transcription factor, AP-1: re-expression of a down-regulated gene, TSC-36, inhibits invasion. Oncogene. 2000;19:5348–5358. doi: 10.1038/sj.onc.1203927. [DOI] [PubMed] [Google Scholar]
- 17.Jolliffe IT. Principal Component Analysis. Springer; New York: 1986. [Google Scholar]
- 18.Kieran NE, Doran PP, Connolly SB, Greenan MC, Higgins DF, Leonard M, Godson C, Taylor CT, Henger A, Kretzler M, Burne MJ, Rabb H, Brady HR. Modification of the transcriptomic response to renal ischemia/reperfusion injury by lipoxin analog. Kidney Int. 2003;64:480–492. doi: 10.1046/j.1523-1755.2003.00106.x. [DOI] [PubMed] [Google Scholar]
- 19.Kita Y, Shiozawa M, Jin W, Majewski RR, Besharse JC, Greene AS, Jacob HJ. Implications of circadian gene expression in kidney, liver and the effects of fasting on pharmacogenomic studies. Pharmacogenetics. 2002;12:55–65. doi: 10.1097/00008571-200201000-00008. [DOI] [PubMed] [Google Scholar]
- 20.Krones-Herzig A, Adamson E, Mercola D. Early growth response 1 protein, an upstream gatekeeper of the p53 tumor suppressor, controls replicative senescence. Proc Natl Acad Sci U S A. 2003;100:3233–3238. doi: 10.1073/pnas.2628034100. [DOI] [PMC free article] [PubMed] [Google Scholar]
- 21.Lai EC. microRNAs: runts of the genome assert themselves. Curr Biol. 2003;13:R925–936. doi: 10.1016/j.cub.2003.11.017. [DOI] [PubMed] [Google Scholar]
- 22.Lewington AJ, Padanilam BJ, Hammerman MR. Induction of calcyclin after ischemic injury to rat kidney. Am J Physiol. 1997;273:F380–385. doi: 10.1152/ajprenal.1997.273.3.F380. [DOI] [PubMed] [Google Scholar]
- 23.MacKay VL, Li X, Flory MR, Turcott E, Law GL, Serikawa KA, Xu XL, Lee H, Goodlett DR, Aebersold R, Zhao LP, Morris DR. Gene expression analyzed by high-resolution state array analysis and quantitative proteomics: response of yeast to mating pheromone. Mol Cell Proteomics. 2004;3:478–489. doi: 10.1074/mcp.M300129-MCP200. [DOI] [PubMed] [Google Scholar]
- 24.McDowell EM, Nagle RB, Zalme RC, McNeil JS, Flamenbaum W, Trump BF. Studies on the pathophysiology of acute renal failure. I. Correlation of ultrastructure and function in the proximal tubule of the rat following administration of mercuric chloride. Virchows Arch B Cell Pathol. 1976;22:173–196. doi: 10.1007/BF02889215. [DOI] [PubMed] [Google Scholar]
- 25.Mishra J, Dent C, Tarabishi R, Mitsnefes MM, Ma Q, Kelly C, Ruff SM, Zahedi K, Shao M, Bean J, Mori K, Barasch J, Devarajan P. Neutrophil gelatinase-associated lipocalin (NGAL) as a biomarker for acute renal injury after cardiac surgery. Lancet. 2005;365:1231–1238. doi: 10.1016/S0140-6736(05)74811-X. [DOI] [PubMed] [Google Scholar]
- 26.Mishra J, Ma Q, Prada A, Mitsnefes M, Zahedi K, Yang J, Barasch J, Devarajan P. Identification of neutrophil gelatinase-associated lipocalin as a novel early urinary biomarker for ischemic renal injury. J Am Soc Nephrol. 2003;14:2534–2543. doi: 10.1097/01.asn.0000088027.54400.c6. [DOI] [PubMed] [Google Scholar]
- 27.Murakami H, Liotta L, Star RA. IF-LCM: laser capture microdissection of immunofluorescently defined cells for mRNA analysis rapid communication. Kidney Int. 2000;58:1346–1353. doi: 10.1046/j.1523-1755.2000.00295.x. [DOI] [PubMed] [Google Scholar]
- 28.Muramatsu Y, Tsujie M, Kohda Y, Pham B, Perantoni AO, Zhao H, Jo SK, Yuen PS, Craig L, Hu X, Star RA. Early detection of cysteine rich protein 61 (CYR61, CCN1) in urine following renal ischemic reperfusion injury. Kidney Int. 2002;62:1601–1610. doi: 10.1046/j.1523-1755.2002.00633.x. [DOI] [PubMed] [Google Scholar]
- 29.Padanilam BJ, Hammerman MR. Ischemia-induced receptor for activated C kinase (RACK1) expression in rat kidneys. Am J Physiol. 1997;272:F160–166. doi: 10.1152/ajprenal.1997.272.2.F160. [DOI] [PubMed] [Google Scholar]
- 30.Safirstein RL. Acute renal failure: from renal physiology to the renal transcriptome. Kidney Int Suppl. 2004:S62–66. doi: 10.1111/j.1523-1755.2004.09110.x. [DOI] [PubMed] [Google Scholar]
- 31.Saxena S, Jonsson ZO, Dutta A. Small RNAs with imperfect match to endogenous mRNA repress translation. Implications for off-target activity of small inhibitory RNA in mammalian cells. J Biol Chem. 2003;278:44312–44319. doi: 10.1074/jbc.M307089200. [DOI] [PubMed] [Google Scholar]
- 32.Shaulian E, Schreiber M, Piu F, Beeche M, Wagner EF, Karin M. The mammalian UV response: c-Jun induction is required for exit from p53-imposed growth arrest. Cell. 2000;103:897–907. doi: 10.1016/s0092-8674(00)00193-8. [DOI] [PubMed] [Google Scholar]
- 33.Shiio Y, Donohoe S, Yi EC, Goodlett DR, Aebersold R, Eisenman RN. Quantitative proteomic analysis of Myc oncoprotein function. Embo J. 2002;21:5088–5096. doi: 10.1093/emboj/cdf525. [DOI] [PMC free article] [PubMed] [Google Scholar]
- 34.Siegel FL, Bulger RE. Scanning and transmission electron microscopy of mercuric chloride-induced acute tubular necrosis in rat kidney. Virchows Arch B Cell Pathol. 1975;18:243–262. doi: 10.1007/BF02889251. [DOI] [PubMed] [Google Scholar]
- 35.Star RA. Treatment of acute renal failure. Kidney Int. 1998;54:1817–1831. doi: 10.1046/j.1523-1755.1998.00210.x. [DOI] [PubMed] [Google Scholar]
- 36.Supavekin S, Zhang W, Kucherlapati R, Kaskel FJ, Moore LC, Devarajan P. Differential gene expression following early renal ischemia/reperfusion. Kidney Int. 2003;63:1714–1724. doi: 10.1046/j.1523-1755.2003.00928.x. [DOI] [PubMed] [Google Scholar]
- 37.Thompson PW, Randi AM, Ridley AJ. Intercellular adhesion molecule (ICAM)-1, but not ICAM-2, activates RhoA and stimulates c-fos and rhoA transcription in endothelial cells. J Immunol. 2002;169:1007–1013. doi: 10.4049/jimmunol.169.2.1007. [DOI] [PubMed] [Google Scholar]
- 38.Wang N, Verna L, Hardy S, Forsayeth J, Zhu Y, Stemerman MB. Adenovirus-mediated overexpression of c-Jun and c-Fos induces intercellular adhesion molecule-1 and monocyte chemoattractant protein-1 in human endothelial cells. Arterioscler Thromb Vasc Biol. 1999;19:2078–2084. doi: 10.1161/01.atv.19.9.2078. [DOI] [PubMed] [Google Scholar]
- 39.Wilks MF, Gregg NJ, Bach PH. Metal accumulation and nephron heterogeneity in mercuric chloride-induced acute renal failure. Toxicol Pathol. 1994;22:282–290. doi: 10.1177/019262339402200306. [DOI] [PubMed] [Google Scholar]
- 40.Wingren C, Steinhauer C, Ingvarsson J, Persson E, Larsson K, Borrebaeck CA. Microarrays based on affinity-tagged single-chain Fv antibodies: sensitive detection of analyte in complex proteomes. Proteomics. 2005;5:1281–1291. doi: 10.1002/pmic.200401009. [DOI] [PubMed] [Google Scholar]
- 41.Witzgall R. The proximal tubule phenotype and its disruption in acute renal failure and polycystic kidney disease. Exp Nephrol. 1999;7:15–19. doi: 10.1159/000020579. [DOI] [PubMed] [Google Scholar]
- 42.Yin T, Sandhu G, Wolfgang CD, Burrier A, Webb RL, Rigel DF, Hai T, Whelan J. Tissue-specific pattern of stress kinase activation in ischemic/reperfused heart and kidney. J Biol Chem. 1997;272:19943–19950. doi: 10.1074/jbc.272.32.19943. [DOI] [PubMed] [Google Scholar]
- 43.Yoshida T, Kurella M, Beato F, Min H, Ingelfinger JR, Stears RL, Swinford RD, Gullans SR, Tang SS. Monitoring changes in gene expression in renal ischemia-reperfusion in the rat. Kidney Int. 2002;61:1646–1654. doi: 10.1046/j.1523-1755.2002.00341.x. [DOI] [PubMed] [Google Scholar]
- 44.Yoshida T, Tang SS, Hsiao LL, Jensen RV, Ingelfinger JR, Gullans SR. Global analysis of gene expression in renal ischemia-reperfusion in the mouse. Biochem Biophys ResCommun. 2002;291:787–794. doi: 10.1006/bbrc.2002.6535. [DOI] [PubMed] [Google Scholar]
Associated Data
This section collects any data citations, data availability statements, or supplementary materials included in this article.