

Abstract
Alcoholism is one of the major causes of non-ischemic heart damage. The myopathic state of the heart due to alcohol consumption, namely alcoholic cardiomyopathy, is manifested by cardiac hypertrophy, compromised ventricular contractility and cardiac output. Several mechanisms have been postulated for alcoholic cardiomyopathy including oxidative damage, accumulation of triglycerides, altered fatty acid extraction, decreased myofilament Ca2+ sensitivity, and impaired protein synthesis. Despite intensive efforts to unveil the mechanism and ultimate toxin responsible for alcohol-induced cardiac toxicity, neither has been clarified thus far. Primary candidates for the specific toxins are ethanol, its first and major metabolic product - acetaldehyde (ACA) and fatty acid ethyl esters. Evidence from our lab suggests that ACA directly impairs cardiac function and promotes lipid peroxidation resulting in oxidative damage. The ACA-induced cardiac contractile depression may be reconciled with inhibitors of Cytochrome P-450 oxidase, xanthine oxidase and lipid peroxidation Unfortunately, the common methods to investigate the toxicity of ACA have been hampered by the fact that direct intake of ACA is toxic and unsuitable for chronic study, which is unable to provide direct evidence of direct cardiac toxicity for ACA. In order to overcome this obstacle associated with the chemical properties of ACA, our laboratory has used the chronic ethanol feeding model in transgenic mice with cardiac over-expression of alcohol dehydrogenase (ADH) and an in vitro ventricular myocyte culture model. The combination of both in vivo and in vitro approaches allows us to evaluate the role of ACA in ethanol-induced cardiac toxicity and certain cellular signaling pathways leading to alcoholic cardiomyopathy.
Keywords: Cardiomyopathy, alcoholic; Acetaldehyde
Introduction
Chronic alcoholism has been demonstrated to cause detrimental damage to cardiac muscles leading to the development of alcoholic cardiomyopathy which accounts for ~33% of all dilated cardiomyopathies (1). In patients with chronic alcoholism, the occurrence of cardiomyopathy of any kind, is increased to 50%, with a majority of these patients dying from heart failure. Alcoholic cardiomyopathy is manifested as cardiomegaly, disrupted myofibrillary architecture, reduced myocardial contractility, decreased ejection volumes and enhanced risk of stroke and hypertension (2, 3). Clinical studies have demonstrated that abstinence from alcohol prior to a certain stage may reverse this specific type of cardiomyopathy (3). There have been several hypotheses formulated regarding the pathogenesis of alcoholic cardiomyopathy, including direct and indirect cardiotoxicity of alcohol (4), accumulation of fatty acid ethyl esters (5), and the cardiac toxicity from the first oxidized metabolic product of ethanol, namely acetaldehyde (ACA) (6, 7, 8, 9). Nevertheless, none of these hypotheses have received convincing experimental support necessary to be fully validated.
ACA, the first oxidized metabolic product of ethanol, has been considered a likelihood candidate toxin for the pathogenesis of alcoholic cardiomyopathy because its ability to concentrate in the heart and its high reactive property compared to ethanol (6). Our laboratory has shown that ACA may directly impair cardiac excitation-contraction (E-C) coupling and inhibit sarco(endo)plasmic reticulum (SR) Ca2+ release function (7, 8, 9, 10). However, the advancement of the ACA toxicity theory has been stalled due to the lack of suitable models to experimentally alter blood ACA and the technical constraints of ACA manipulation such as low boiling point and high chemical reactivity. These properties of ACA are likely to impose certain experimental and technical difficulties because of the ability of ACA to readily escape from solution or test chambers, and may cause an inaccuracy in the concentration of ACA, which would bias the experimental findings. Normally, ACA degrades very quickly (~ 5 times that of ethanol) via aldehyde dehydrogenase (ALDH) which maintains ACA at a low blood level (< 0.5 mM) following ingestion of 0.5 g/kg ethanol. Higher ACA levels (~ 2 mM) may be seen in alcoholics when given the same dose of ethanol, probably due to hepatic inhibition of ALDH activity (11). Furthermore, blood ACA levels may reach 30 - 500 mM following ethanol intoxication in certain populations such as Asians and African American who carry a mutated ALDH with low K m (12), making them theoretically ideal to examine the role of ACA. However, the intolerance of these individuals to ethanol ingestion makes it practically impossible to conduct this analysis. Earlier experiments that employed metabolic inhibitors to alter ACA levels (e.g., the ALDH inhibitor cyanamide) revealed the inhibitors to be nonspecific, ineffective, toxic and difficult to maintain in experimental animals (13). Due to the lack of a suitable model or method to assess the chronic effects of ACA, our group recently developed a novel transgenic mouse and a cardiac myocyte culture model to investigate the chronic effects of ACA on the heart, both in vivo and in vitro.
Study of ventricular function provides the most direct evidence of cardiac contractile function during drug intervention or certain pathological conditions. Over the past decades, a plethora of new techniques have been established to evaluate the ventricular function at different levels (from echocardiography to single myocyte contraction). The method discussed here is a video-based edge-detection technique with simultaneous measurement of intracellular Ca2+ homeostasis in isolated ventricular myocytes.
Materials and Methods
Experimental Animal Models
Experimental Animals and Chronic Ethanol Ingestion
Adult Sprague-Dawley or Wistar rats are obtained as pairs of littermates weighing approximately 50 g and are usually used as described (14). All animals are housed in a temperature-controlled room under a 12-h light/12-h dark illumination cycle and allowed tap water ad libitum. Animals are initially maintained on standard rat chow for a one-week quarantine period. Following the quarantine period, all animals are then introduced to a nutritionally complete liquid diet (Shake & Pour Bioserv Inc., Frenchtown, NJ, USA) for a one-week acclimation period (15). The use of a liquid diet is based on the observations made by Keane and Leonard (16) that ethanol self-administration resulted in less nutritional deficiencies and less stress to the animals in comparison to forced-feeding regimens, intravenous administration, or aerosolized inhalation. Upon completion of the acclimation period, one littermate is maintained on the liquid diet without ethanol, and the remaining littermates begin a 7-day period of ethanol introduction. Ethanol-consuming animals are given a diet containing 12%, 24%, and 36% of isocaloric ethanol on days 1-4, 5-7 and 8, respectively. An isocaloric (250 cal/liter) pair-feeding regimen is employed to eliminate the possibility of nutritional deficits. Control animals, which are randomly paired with the ethanol-consuming animals prior to the start of feeding, are provided with the equal volume of liquid diet the paired ethanol-consuming animals drank the day before. The chronic feeding usually lasts between 8 - 12 weeks. Blood pressure and body weight are monitored with a semi-automated, amplified tail-cuff device (IITC Inc., Woodland Hills, CA) and a standard laboratory scale. The serum ethanol concentration is determined using a biochemistry analyzer (YSI 2700 Biochemistry Analyzer, Yellow Springs, OH).
Transgenic Models
To determine if enhanced/reduced cardiac exposure to ACA exacerbates/alleviates cardiac damage following chronic ingestion of alcohol, alcohol metabolism may be artificially altered in two different lines of transgenic mice to either increase or decrease cardiac exposure to ACA. The first transgene is to increase the expression of alcohol dehydrogenase (ADH) specifically in the heart. Increased ADH activity has been shown to result in greater alcohol metabolism and cardiac production of ACA following alcohol ingestion (20, 21). Our preliminary evidence demonstrates that these mice are markedly more sensitive than control animals to chronic alcohol-induced cardiac function as well as morphological damage (20, 21). These results indicate that chronic exposure to ACA, even at low levels, may be cardiotoxic. The results are consistent with the hypothesis that ACA contributes to the pathogenesis of alcoholic cardiomyopathy. The second transgene is to increase aldehyde dehydrogenase (ALDH) in the liver or non-specifically in the body. The liver is the prime organ for alcohol metabolism and breakdown of ACA into acetate via ALDH enzyme. Overexpression of ALDH should greatly speed up the breakdown of ACA, and decrease the total body burden of ACA, resulting in markedly reduced cardiac exposure to ACA following alcohol ingestion. ADH transgene has been constructed to produce local over-expression of ADH in the heart (20). This gene includes the mouse α-myosin heavy chain (MHC) promoter to drive cardiac specific expression. The cDNA for murine class I ADH (17) is inserted downstream from the promoter. This cDNA is chosen because class I ADH is the most efficient in the oxidation of ethanol. Wild-type mice (FVB strain) obtained from the in house colony are used to produce transgenic lines containing the ADH transgene (18). The transgenic animals are produced using standard procedures. For producing the ALDH transgenic mice, the insert will be excised and separated from the plasmid by KpnI/NotI restriction digestion and agarose gel electrophoresis. Prior to injection the insert will be purified on Qiagen 20 columns, followed by spin gel chromatography and filtration through 0.22 µm filters. Approximately 100 copies of the purified transgene insert will be microinjected into each mouse embryo of the inbred strain FVB. Twenty microinjected embryos will be implanted into each pseudopregnant female and allowed to come to term. Once transgenic founders are identified they will maintained be on the FVB background. As a means of readily identifying transgenic mice, a second, marker transgene is coinjected with the ADH or ALDH transgenes into fertile embryos. The marker transgene expresses the tyrosinase gene in melanocytes of transgenic mice (19). This transgene corrects albinism since albino mice carry a point mutation in their endogenous tyrosinase gene. As FVB mice are albino this system is suitable for our transgenic animals. The advantages of this identification method are that transgenic mice can be recognized at birth by their pigmentation (20), most mice are spared from the trauma of tail clipping and an enormous amount of routine labor is saved. Southern blot analysis may still be required on DNA from the first generation of founder mice to determine copy number and to insure that the transgenes are intact. Considering the inevitable experimental and technical difficulties of administering ACA in vivo, these transgenic models should provide valid tools to assess the role of ACA in body function.
Assessement of the ACA Production After Ethanol Challenge
Cardiac tissues or ventricular myocytes (200,000 cells per ml) isolated from control or experimental animals with or without acute (30 min after 0.4 g/kg injection of ethanol) or chronic ethanol challenge are placed immediately in sealed vials and stored at -80oC until analysis. Immediately before analysis, the samples are warmed to 25oC. 2 ml of the headspace gas from each vial is removed through the septum on the cap with a gas tight syringe and transferred to a 200 μl loop injection system on a Hewlett-Packard 5890 gas chromatograph equipped with a flame ionization detector. ACA and other components are separated on a 9-meter VOCOL capillary column (Supelco, Inc.) with a 1.8 μm film thickness and an inner diameter of 0.32 mm. The temperature is held isothermally at 30oC, and helium is used as the carrier gas at a flow rate of 1.8 ml/min. Under the specified conditions, separation of ACA from ethanol and other compounds is usually complete within one minute. Quantification may be achieved by calibrating the Gas Chromatography peak areas against those from headspace samples of known ACA standards, over a similar concentration range as the cell or tissue samples, in the same buffer (21).
Cell Culture Model
Isolation of Ventricular Myocytes
Single ventricular myocytes are isolated as described previously (21). In brief, animals are sacrificed after being anesthetized with a ketamine/xylazine solution (3:1, 1.32 mg/kg, i.p.) and hearts are rapidly removed and perfused (at 37oC) with oxygenated (5%CO2-95% O2) Krebs-Henseleit bicarbonate (KHB) buffer (mM: NaCl 118, KCl 4.7, CaCl2 1.25, MgSO4 1.2, KH2PO4 1.2, NaHCO3 25, N-[2-hydro-ethyl]-piperazine-N’-[2-ethanesulfonic acid] (HEPES) 10, glucose 11.1, pH 7.4. Hearts are subsequently perfused with a nominally Ca2+-free KHB buffer for 2-3 min until spontaneous contractions ceased followed by a 20 min perfusion with Ca2+-free KHB containing 223 U/ml collagenase (Worthington Biochemical Corp., Freehold, NJ) and 0.1 mg/ml hyaluronidase (Sigma Chemical, St. Louis, MO). After perfusion, the left ventricle is removed, minced and incubated with the fresh enzyme solution (Ca2+-free KHB containing 223 U/ml collagenase) for 3-5 min. The cells are further digested with 0.02 mg/ml trypsin (Sigma) before being filtered through a nylon mesh (300 mm) and collected by centrifugation (60 x g for 60 sec). Myocytes are then resuspended in a sterile-filtered, Ca2+-free KHB buffer containing (in mM): NaCl 131, KCl 4, MgCl2 1, HEPES 10, and glucose 10, supplemented with 2% bovine serum albumin (BSA), with a pH of 7.4 at 37oC. Initially, cells are washed with Ca2+-free KHB buffer in order to remove any remnant enzyme and extracellular Ca2+ is added incrementally back to 1.25 mM.
Culture of Myocytes with Specific Pharmacological Interventions
Isolated ventricular myocytes from adult normal Sprague-Dawley or Wistar rats maintained in a defined medium consisting of Medium 199 (Sigma) with Earle's salts containing HEPES (25 mM) and NaHCO3 (25 mM), supplemented with albumin (2 mg/ml), L-carnitine (2 mM), creatine (5 mM), taurine (5 mM), insulin (100 nM), penicillin (100 U/ml), streptomycin (100 mg/ml), and gentamicin (5 mg/ml) (22). The modified culture medium is composed of the following per 500 ml Medium 199 buffer: 1.0 g bovine albumin (Sigma), 0.2 g L-carnitine (Sigma), 0.33 g creatine (Sigma), 0.31 g taurine (Sigma), 500 mg penicillin/streptomycin (Gibco), 2.5 mg gentamycin (Sigma), and 1.0 ml (10-7 M) insulin. Myocytes are normally cultured in 2 ml medium in sealed vials with silicone septa (VWR product number 15900-008) for 4 - 6 hours with ACA (μM or mM ranges) or specific pharmacological intervention before mechanical and intracellular Ca2+ properties are evaluated. Our earlier studies failed to observe any noticeable mechanical effect from ACA at concentration below low mM range in either cardiac tissues or myocytes (7, 10), which may be due to the volatile property of ACA in open air. In some studies, the myocytes are co-incubated with the lipid peroxidation inhibitor, butylated hydroxytoluene (20 μM), the CYP2E1 inhibitor diallyl sulfide (100 μM), the xanthine oxidase inhibitor allopurinol (100 μM) or the aldehyde oxidase inhibitors menadione (50 - 100 μM) and chlorpromazine (100 μM). The cells are maintained at 37oC in an incubator with 100% humidity and 5% CO2. Mechanical properties have been shown to remain relatively stable in myocytes within 12-24 hr in the serum-free medium. Only rod-shaped myocytes with clear edges are selected for recording of mechanical properties or intracellular Ca2+ transients. Our preliminary data revealed that ACA at μM range depresses myocyte contractile function possibly through ethanol-inducible form of cytochrome P-450 oxidase (CYP2E1), xanthine oxidase and lipid peroxidation (23).
Mechanical and Functional Characterization
Cell Shortening/Relengthening Measurements
Mechanical properties of ventricular myocytes are assessed using an IonOptix MyoCam® video-based system (IonOptix Co., Milton, MA) as described (24). In brief, coverslips with cells attached are placed in a chamber mounted on the stage of an inverted microscope (IX-70) and superfused (~2 ml/min at 25oC) with a buffer containing (in mM): NaCl 131, KCl 4, CaCl2 1, MgCl2 1, glucose 10, HEPES 10, at pH 7.4. The cells are field-stimulated at a frequency of 0.5 Hz, 3 msec in duration. A video-based edge-detector is used to capture and convert changes in cell length during shortening and relengthening into an analogue voltage signal. Cell shortening and relengthening are assessed using the following indices: peak shortening (PS), time-to-90% PS (TPS) and time-to-90% relengthening (TR90), maximal velocities of shortening (+dL/dt) and relengthening (-dL/dt), respectively.
Intracellular Ca2+ Transient Measurement
Myocytes are loaded with fura-2/AM (0.5 mM) for 10 min at 25oC. Fluorescence measurements are recorded with a dual-excitation single-emission fluorescence photomultiplier system (IonOptix). Myocytes are placed on an inverted microscope and imaged through an Olympus Fluor 40x oil objective. Myocytes are exposed to light emitted by a 75 W halogen lamp through either a 360 or 380 nm filter while being stimulated to contract at 0.5 Hz. Fluorescence emissions are detected between 480-520 nm by a photomultiplier tube after initial illumination at 360 nm for 0.5 sec and then at 380 nm for the duration of the recording protocol. The 360 nm excitation scan is repeated at the end of the protocol and qualitative changes in intracellular Ca2+ concentration ([Ca2+]i) is inferred from the ratio of the fura-fluorescence intensity (FFI) at both wavelengths. Fluorescence decay time (τ) is also measured as an indication of the intracellular Ca2+ clearing rate (24).
Evaluation of the Function of Sarco(endo)plasmic Reticulum Ca2+-ATPase (SERCA):
In order to assess the SERCA-mediated cytosolic Ca2+ clearing, the previously described protocol (25) is followed. After steady-state myocyte contraction had been established, sarcoplasmic reticulum (SR) release is initiated by a brief (100 ms) and rapid introduction of caffeine (10 mM). The introduction of caffeine is under a Na+- and Ca2+-free solution (0Na+/0Ca2+). This maneuver should prevent the extrusion of Ca2+ through Na+-Ca2+ exchanger (NCX). The parameters by which SR function is assessed are SR Ca2+ release (measured by area of cell shortening phase normalized to peak shortening amplitude, AS/PS) and SR Ca2+ uptake (area of cell relengthening phase normalized to peak shortening amplitude AR/PS).
Evaluation of Na+/Ca2+ Exchanger (NCX) Function:
To evaluate the function of NCX in cardiomyocytes, the myocytes are exposed myocytes to a long caffeine protocol. Throughout the continuous caffeine application, SR Ca2+ uptake is functionally disabled since caffeine prevents SR Ca2+ accumulation (25, 26). Therefore, the intracellular Ca2+ transient decline primarily depends on NCX and slow processes such as mitochondrial Ca2+ uptake and sarcolemmal (SL) Ca2+ATPase (27), in the presence of extracellular Na+ and Ca2+ (control buffer with 10 mM caffeine). After the repeated long caffeine exposure (after re-establishing steady-state contraction), in the presence of 5 mM Ni2+ blocks the extrusion of Ca2+ through NCX. Under these conditions, cytosolic Ca2+ clearance primarily depends on the slow processes. The quantification NCX-dependent Ca2+ clearance is measured as differences between areas underneath the twitch curve (normalized to peak shortening amplitude) before and after application of Ni2+.
Biochemical Evaluations of Cardiac Damage
Preparation of Mitochondrial Fraction
Myocardial tissue specimens (70 to 80 mg) are minced and homogenized at 4°C for 30 sec in 12 volumes of HES buffer, which consisted of 10 mM HEPES-NaOH (pH 7.4), 1 mM EDTA, and 250 mM sucrose, in a glass homogenizer with a Teflon pestle. The homogenate produced is then centrifuged at 4°C and 700g for 10 minutes in order to remove any nuclear and myofibrillar debris, the resultant supernatant is centrifuged at 7000g for 10 minutes. The pellet is resuspended and washed 3 times with HES buffer (28).
Measurement of Mitochondrial Respiration
Mitochondrial respiration is measured using an oxygen electrode (YSI International) and oxygen consumption chamber (Gibson Medical Electronics). Experiments are performed at 37oC. The assay medium contained 125 mM KCl, 5 mM MgCl2, 2 mM KPO4 amd 5 mM HEPES-KOH (pH 7.4). Mitochondria are diluted to 0.1 mg/ml. Complex I linked (5 mM glutamate) and complex II-linked substrates (5 mM succinate with 1 μg/ml rotenone) are use for investigations. State 3 respiration is measured for 2 min following the addition of ADP (1 mM). The individual respiratory complexes (I-V) are measured as described previously (29, 30).
Oxidative Stress Status - Glutathione Assay
Glutathione levels are determined in cardiac cells and tissues as an indication of oxidative stress. Glutathione peroxidase catalyzes the reduction of lipid hydroperoxides or hydrogen peroxide using reduced glutathione (GSH) as substrate, thus providing a line of protection against oxidative stress and lipid peroxidation. GSH is regenerated by the reduction of glutathione disulfide (GSSG) through the catalytic action of glutathione reductase. A low ratio of GSH/GSSG suggests enhanced oxidative stress. GSH and GSSG levels are measured according to the method described by Griffith (31). Tissues are washed with PBS buffer and 5 mM EDTA. For measurement of GSH, frozen tissue samples are homogenized in 4 volumes (w/v) of 1% picric acid. Acid homogenates are centrifuged at 16,000 x g (30 minutes) and supernatant fractions collected. Supernatant fractions are assayed for total GSH and GSSG by the standard recycling method (31) and GSH content is determined using a standard curve generated from known concentrations of GSH. The procedure consisted of using one-half of each sample for GSSG determination and the other half for GSH. Samples for GSSG determination are incubated at room temperature with 2 µl of 4-vinyl pyridine (4-VP) per 100 µl sample for 1 hour after vigorous vortexing. Incubation with 4-VP conjugates any GSH present in the sample so that only GSSG is recycled to GSH in the recycling assay. This allowed for measurement of only GSSG without interference by GSH. The GSSG (as GSHx2) is then subtracted from the total GSH to determine actual GSH level.
Fluorescent Detection of Reactive Oxygen Species
2',7'-Dichlorofluorescein (DCF) can be used as a measure of the oxidative stress in myocyte (32). DCF diacetate (DCFDA) will be added to cells of interest for 30 min. DCFDA is prepared in ethanol and diluted into myocyte culture medium to a final concentration of 5 mM. DCFDA is taken up by cells and on deacetylation forms a nonfluorescent DCF. Upon oxidation, this becomes DCF. Myocytes are trypsinized but not fixed, and the mean fluorescence is measured for 10,000 cells using a Becton Dickinson FACScan with excitation at 488 nm and emission at 530 nm (± 21 nm).
Lipid Peroxidation
In order to assess lipid peroxidation, malondialdehyde (MDA) and 4-Hydroxy-2-nonenal (4-HNE) levels, end products of lipid peroxidation, are measured in the cells from in vivo and in vitro studies. A colorimetric assay (LPO-586 Kit; Oxis International) that is based on the method of Esterbauer et al. (33) is used to determine levels of lipid peroxidation. The protein concentration is determined using the Bradford method. Protein samples are stored at -70oC until analysis. In 200 µl of sample, 10 µl of 0.5 M BHT and 650 µl of Reagent 1 is added. The tubes are vortexed and 150 µl of 15.4 M methanesulfonic acid (Reagent 2) is added to the tubes. Samples are then incubated at 45oC for 45 min, which is followed by centrifugation for 10 min at 15,000 x g. The resultant clear supernatant is transferred to a cuvette and the absorbance is measured at 586 nm (color is stable for 1 hour at room temperature). Each assay that is performed also included sample blanks, reagent blanks and MDA and 4-HNE standards. The analyte concentration in each sample is calculated using the molar extinction coefficient at 586 nm of 110,000.
Protein Carbonyl Assay
To assess the oxidative protein damage specific to the heart, the carbonyl content of protein extracted from mitochondria and used for analysis (34). Briefly, proteins are extracted and lysed to prevent proteolytic degradation. Nucleic acids are eliminated by treating the samples with 1% streptomycin sulfate for 15 min, followed by a 10 min centrifugation (11,000 x g). Protein is precipitated by adding an equal volume of 20% TCA to protein (0.5 mg) and centrifuged for 1 min. The TCA solution is removed and the sample resuspended in 10 mM 2,4-dinitrophenylhydrazine (2,4-DNPH) solution. Samples are incubated at room temperature for 15-30 min. 500 µl of 20% TCA is added and samples centrifuged for 3 min. The resultant supernatant is discarded, the pellet washed in ethanol:ethyl acetate and allowed to incubate at room temperature for 10 min. The samples are centrifuged again for 3 min and the ethanol:ethyl acetate steps are repeated 2 more times. The precipitate is resuspended in 6 M guanidine solution, centrifuged for 3 min and insoluble debris removed. The maximum absorbance (360-390 nm) is read versus the appropriate blanks (2 M HCl) and the carbonyl content calculated using the molar absorption coefficient of 22,000 M-1 cm-1.
HNE-Protein Adduct Immunoreactivity
HNE, a major component of lipid peroxidation, has been shown to react with proteins to form HNE-protein adducts. HNE-protein adducts are relatively stable and can be used as a marker of radical-mediated oxidative stress and tissue/cell damage. HNE-protein adduct formation is increased under chronic alcoholism (35). Therefore, it may be helpful to measure HNE-protein adducts under ACA-induced cardiac damage. The formation of reducible HNE-protein adducts (Michael or imine adducts) can be measured using an ELISA method as described (36). Mitochondria are thawed, then diluted to 0.02 mg/ml in 50 mM phosphate buffer at pH 7.4, and subsequently boiled for 5 min. 50 µl of each sample is added to the well of a 96-well microplate, and the protein is allowed to bind for 1 hour at 37oC. Phosphate buffer is used to rinse the wells, which are then treated with 100 µl of 50 mM NaBH4 for another hour at 37oC to reduce further HNE-protein adduct formation. The well is blocked for 30 min and subsequently incubated for 1 hour at 37oC with rabbit antibody 672, which recognizes the reduced HNE-protein adduct. The well is washed and incubated with an alkaline phosphatase-conjugated goat anti-rabbit antibody (Bio-Rad), and then developed using p-nitropheny1 phosphate (Sigma Chemical, St. Louis, MO).
Results and Discussion
The metabolism of ethanol within the body has been investigated and identification of the pathway is useful for the purposes of further investigation. After ethanol is absorbed into the cells, it is converted into ACA by ADH in the cytosol. The ACA that is present is further oxidized into acetate by ALDH within the mitochondrial matrix. Both of these oxidation reactions yield the production of one equivalent NADH (Fig. 1).
Fig. 1.
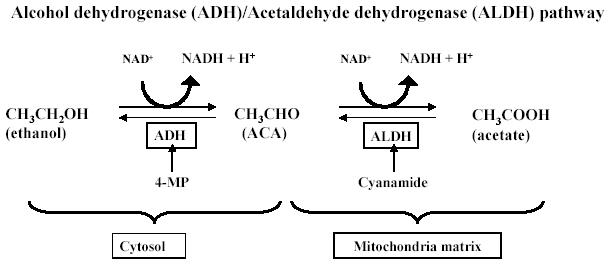
The metabolic pathways of ethanol and ACA (courtesy of Dr. Shannon Bailey at University of Alabama at Birmingham).
The above pathway results in the production of free radicals predicated upon changes in NADH amounts and NADH/NAD+ redox ratios (37). These increases alter the activity of xanthine oxidase, which generates free radicals. Another pathway of ethanol metabolism is the microsomal ethanol oxidizing system (MEOS), which catalyzes the conversion of ethanol to ACA. In chronic situations, it has been shown that the metabolism of ethanol shifts from the ADH pathway, to one involving the MEOS, and CYP2E1 (38). In the chronic state, the levels of MEOS and CYP2E1 have been shown to be elevated (39). The activation of CYP2E1 by ethanol is one of the main metabolic pathways for ethanol which is responsible for the production of oxidative damage in hepatocytes (40). Also, CYP2E1 is expressed constitutively in isolated rat cardiomyocytes (41). Increased lipid peroxidation and CYP2E1 levels have been observed following chronic ethanol administration. This is consistent with the finding that enhanced lipid peroxidation following ethanol ingestion may be prevented with the use of CYP2E1 inhibitors (42). In addition, ethanol may also lead to oxidative insults via a reaction involving aldehyde oxidase with ACA or NADH, which can dysregulate mitochondrial oxidative metabolism (36). The electron transport chain within the mitochondria contributes significantly to the production of reactive oxygen species (ROS), and exposure of ethanol augments the ROS production, which may further be exacerbated by a decrease in mitochondrial antioxidant defenses (43).
For the purposes of investigating the effects of ethanol and ACA, there are several inhibitors that may be employed. Two such inhibitors that may be utilized in investigation are 4-methylpyrazole (4-MP), a selective ADH inhibitor (44), and an ALDH inhibitor, cyanamide (21). Diallyl sulfide, a CYP2E1 inhibitor, may be useful for the assessment of ethanol/ACA (40). As previously mentioned, aldehyde oxidase and xanthine oxidase are both involved in the metabolism of ethanol and ACA, and result in oxidative stress leading to cardiac mechanical dysfunction. As indicated in Fig. 2, both aldehyde oxidase and xanthine oxidase may be intervened pharmacologically with menadione and allopurinol, respectively.
Fig. 2.
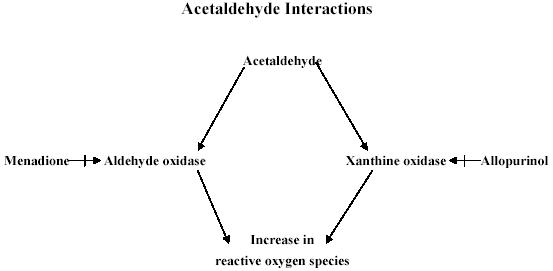
Pharmacological interventions to examine the mechanisms of action involved in the cardiac toxicity of ACA.
One of the main benefits of the in vitro myocyte culture method is that the effect of ACA on cardiac excitation-contraction coupling may be examined with the assistance of specific pharmacological interventions for ACA metabolism. The aforementioned inhibitors of the ethanol/ACA metabolic pathway or sources of free radical generation may be added to the culture dishes instead of employing chronic feeding regimen for in vivo analysis. Another advantage is the ease with which drug interactions may be studied. People with alcohol abuse often use or abuse other drugs that may affect the pharmacokinetics of ethanol, for example, it is reported that 30¯60% of alcoholics consume cocaine (45). Despite the evidence of multiple usage of drugs is involved along with alcohol consumption, little research has been done to understand the drug interactions. Another example for drug interaction is the combinatorial effects of nicotine (smoking) and alcohol. Ethanol and nicotine may synergistically increase heart rate (46), although the mechanism of action remains to be elucidated. The use of specific inhibitors in an in vitro experimental setting (such as the one described in this manuscript) should be able to provide valuable information regarding the combined effects and interactions of other drugs associated with alcohol usage. Development of an in vitro method regarding the use of ACA allows these interactions to be studied in a reliable manner that does not involve a time-consuming in vivo feeding regimen. In addition, parameters such as interstitial materials, nerve fibers, and other cells, which are often present in the setting of in vivo should be eliminated using the in vitro culture method. The presence of heterogeneous cell types, such as fibroblasts, and nerve terminals that occur in multicellular preparations like papillary muscles can make experimental results difficult or impossible to interpret. The mechanical function of the myocytes may be affected by non-myocyte components such as the coronary vasculature and/or interstitial connective tissue. For example, it is possible that the modulations in the contractile performance under ethanol exposure may not be due to actual reduced function of the myocyte, but rather due to increased interstitial fibrosis. Therefore, it is necessary that there are methods available for scientists to study the smallest cardiac contractile unit - ventricular myocytes specifically, independent of any surrounding factors. However, there are drawbacks to this cell culture model as with all the in vitro study, e.g., lack of the physiologic environment which would otherwise be present in an in vivo setting. In response to this deficit, the aforementioned ADH and ALDH transgenic models should be useful for interpretation of the cardiac effects of ACA, in conjunction with our in vitro cell culture model.
Synopsis
Alcohol abuse continues to remain as a prevalent social problem contributing to severe heart problems in alcoholics. It is a current opinion that the toxic effects of alcohol on the heart are attributable, in large part, to the first metabolic product of ethanol - ACA. ACA is formed from the breakdown of ethanol in cells and is far more toxic and reactive than ethanol. In order to better understand the adverse repercussions of chronic alcohol abuse, assessment of cardiac toxicity of ACA using our described methods should lead to useful clues regarding the pathogenesis of alcoholic cardiomyopathy.
Acknowledgments
The authors would like to acknowledge Dr. Matthew Picklo, Sr. from University of North Dakota School of Medicine and Dr. Amy Davidoff from University of New England for their generous help in developing the experimental protocols. Research in Dr. Ren’s laboratory described in this manuscript has been supported by grants from University of North Dakota New Faculty Award, North Dakota Experimental Program to Stimulate Competitive Research (EPSCoR), the NASA NCC-582 (University of North Dakota) and National Institute of Health (NIAAA) 1R15AA/HL13575-01.
Appendix
Protocols
Protocols for isolation of ventricular myocytes and measurement of myocyte mechanics has been described in detail in our previously published article as the following: Ren J, Wold LE. Measurement of cardiac mechanical function in isolated ventricular myocytes from rats and mice by computerized video-based imaging. Biol Proced Online 3: 43-53, 2001. Please refer for detail. The following lists additional protocols described in this manuscript.
Evaluation of the Function of Sarco(endo)plasmic Reticulum Ca2+-ATPase (SERCA)
-
Make the fluo-3AM stock solution as follows:
- 5 μl 1M fluo stock
- 1 μl pluronic solution
- 5 ml contractile buffer (from the stock below)
- 0.05 g Albumin
-
Prepare the following perfusates:
-
Contractile buffer
- 300 ml HEPES
- 0.54 g Glucose
- 300 μl 1 M CaCl2
-
0 Ca2+ buffer
- 50 ml HEPES
- 0.09 g Glucose
-
Lithium buffer no Ca2+
- 50 ml Lithium stock
- 0.09 g Glucose
-
Lithium buffer + Caff
- 10 ml Lithium stock
- 0.018 g Glucose
- 0.019 g Caffeine
-
Fill the four chambers with the above solutions and remove all air bubbles in the tubing.
Load a plate of cells with fluo-3AM by removing the contractile buffer and replacing with fluo-3AM. Load for 30 minutes. After loading, wash the cells 2-3 times with contractile buffer.
Isolate a cell in the viewer and make sure that the electrically stimulated (ES) fluo trace has little background noise.
Record four ES fluo traces.
Switch the perfusate to the Ca2+-buffer and allow perfusion for 15 seconds. Once the cell stops contracting, turn off the electrical stimulus (ES).
Switch the perfusate to Lithium buffer with 0 Ca2+ and perfuse for 15 seconds. (No ES).
Once the program begins recording, perfuse the cell with a 100 msec puff of the Lithium buffer plus caffeine.
Wash the cells with contractile buffer for 1-2 minutes before finding another cell on the same plate.
Record 5-6 traces per well.
Evaluation of Na+/Ca2+ Exchanger (NCX) Function
-
Make the fluo-3AM stock solution as follows:
- 5 μl 1M fluo stock
- 1 μl pluronic solution
- 5 ml contractile buffer (from the stock below)
- 0.05 g Albumin
-
Prepare the following perfusates:
-
Contractile buffer (4)
- 200 ml HEPES
- 0.36 g Glucose
- 200 μl 1 M CaCl2
-
Contractile + Caff (1)
- 10 ml contractile buffer
- 0.019 g Caffeine
-
Contractile + Ni (3)
- 50 ml contractile buffer
- 250 μl 1M NiCl2
-
Contractile + Caff + Ni (2)
- 10 ml contractile buffer
- 0.019 g Caffeine
- 50 μl 1M NiCl2
-
Fill the four chambers with the above solutions and remove all air bubbles in the tubing.
Load a plate of cells with fluo-3AM by removing the contractile buffer and replacing with fluo-3AM. Load for 30 minutes. After loading, wash the cells 2-3 times with contractile buffer.
Isolate a cell in the viewer and make sure that the electrically stimulated (ES) fluo trace has little background noise.
Record four ES fluo traces.
Turn the ES off for 30 seconds.
Perfuse the cell with contractile buffer plus caffeine for 6 seconds. Once the fluo trace returns to baseline, perfuse with contractile buffer.
Allow the cell to recover for 1-2 minutes. Try recording a baseline fluo-3 trace to see if the background is noisy.
Record four ES fluo traces (on the same cell as before).
Switch the perfusate to contractile buffer plus nickel for 15 seconds. Once the cell stops twitching, turn the ES off.
Switch the perfusate to contractile buffer plus nickel plus caffeine and perfuse for 6 seconds.
Wash the plate of cells for 1-2 minutes before finding another one. The protocol can be repeated 4-5 times on the same well of cells.
Oxidative Stress Status - Glutathione Assay
1. Preparing samples
Measure out about 0.050 grams of frozen tissue. Put the sample in a clearly labeled 1ml micro-centrifuge tube. Keep all tubes on ice at all times.
Take the weight of the sample and multiply it by 4000.
This is the amount in μl of picric acid you should add to each tube.
Sonicate each tube for 5-15 seconds.
Centrifuge each tube at 13,500 rpm for 20 minutes.
Take off the supernatant and place it in another clearly labeled tube.
These samples can be frozen in the -80oC freezer until a later time.
2. Assay Procedures
Figure out how many cuvettes you will need to do your samples in triplicate, twice. One for GSH and another for GSSG. This will give you how much buffer you will need to do the assay to avoid wasting reagents.
Example:
NADPH: 150 samples x 0.350ml = 52.5ml of buffer needed.
DTNB: 150 samples x 0.05ml = 7.5ml of buffer needed.
GR: 150 samples x 0.025ml = 3.75ml of buffer needed.
Be sure to round up number of samples and account for extra ml needed to calculate the standard curve.
3. Buffers
-
125mM Phosphate/EDTA buffer:
Mono (500ml): 0.125M X 0.5L X 138.0(F.W.) = 8.625g
Di (500ml): 0.125M X 0.5L X 142.0(F.W.) = 8.875g
-
EDTA buffer: (500ml)
0.0063M X 0.5L X 372.24(F.W.) =1.173g
-
Add 1.173 of EDTA buffer to the mono buffer and another 1.173g to the di buffer.
Stir each solution for 25-30 minutes.
Pour 500-600mL of the di buffer into a 1000mL beaker. Add the mono buffer to the di buffer until the pH of the combined buffers is 7.5. Pour buffer into bottle labeled Phosphate/EDTA.
-
0.3mM NADPH buffer: (350 μl)
0.0003M X liters of buffer needed calculated above (ex. 0.0525L) X 833(F.W.) = number of grams.
-
6mM DTNB buffer: (50 μl)
0.006M X liters of buffer needed calculated above (ex. 0.0075L) X 396.4(F.W.) = number of grams.
Add the number of grams of NADPH and the number of grams of DTNB to the amount of Phosphate/EDTA buffer needed which was calculated in the example. Put this in a jar or a container which can be kept cold and in the dark. This will be the mix buffer.
-
GR Each time you open up a new lot number or sample the dilution will be different.
2500 unit= 1:50 dilution. 3.75ml/50= 75 μl GR in 3.765ml mix buffer
500 unit= 1:10 dilution. 3.75 ml/10= 375 μl GR in 3.375ml mix buffer
600 unit= 1:200 dilution. 3.75ml/200= 18.75 μl in 3.731ml mix buffer
Place the solution in a small falcon tube that should be kept cold.
4. Standard Curve Mix
GSH: start with 10mM stock = 0.0030703g in 1ml H2O
1mM = 100 μl of 10mM in 900 μl H2O
0.1mM = 100 μl of 1mM in 900 μl H2O
0.01mM = 100 μl of 0.1mM in 900 μl H2O
0.002mM = 10 μl of 0.01mM in 40 μl H2O
Be sure to change tips of pipette between each addition and mix each solution.
Conditions: The system is run at 30oC. Run for 5 minutes. Read at 412nm.
Standard Curve
| Mix Buffer | H20 | GSH | GR | ||
| 400 ul | 200 mM | 70 μl | 5 μl | 25 μl | |
| 0.01 mM | 70 μl 65 55 45 35 25 |
5 μl 10 20 30 40 50 |
|||
| 0.1mM | 70 μl 65 |
5 μl 10 |
|||
| Blank | |||||
| 400 μl | 75 μl | 0 μl | |||
Figure standard curve on the computer template (Cricket Graph). Take the Blank and subtract from all the standards and graph a curve. The curve must be linear to continue on to the sample (0.990 or better).
5. Samples
| Mix buffer | H2O | Sample | GR |
| 400 ul | 70 μl | 5 μl | 25 μl |
Add the GR last because this is what starts the reaction.
If the count is higher or lower than the top or bottom of the curve, you must adjust your sample to get it within the curve.
6. GSSG
This is run after GSH and is done by adding Vinyl Pyridine to each of the samples (1 μl of VP to 50 μl of sample, vortex and let sit for 1 hour in fridge before you run on spec). Run the samples the same as you ran the GSH samples.
| Mix | H2O | VP sample | GR |
| 400 μl | 70 μl | 5 μl | 25 μl |
Protein Carbonyl Assay
A 200 mg tissue sample is finely minced in 3 ml of Lysis buffer and is incubated at room temperature for 15 min. The supernatant is then transferred to an Eppendorf tube and centrifuged at 6,000 x g for 10 min. Pellet is left behind.
Two tubes of samples are prepared for each extracted protein with 500 μl in each tube. 500 μl of 20% TCA is added to each tube to precipitate the protein. Samples are incubated on ice for 10 min and centrifuged at 11,000 x g for 5 min using a table top centrifuge.
Discard supernatant and add 500 μl 2 M HCl to one tube (serves as blank for that sample) and add 500 μl 10 mM 2,4, DNPH (dinitrophenylhydrazine, dissolved 2.5 M HCl) to the other tube.
Incubate the tubes in the dark for 1 hour, with vortexing every 15 min.
At the end of 1 hour, add 500 μl 20% TCA to each tube and centrifuge 11,000 x g for 3 min at room temperature.
Remove supernatant and wash pellet with Ethanol/Ethyl acetate wash (1:1) incubate for 10 min. Then centrifuge 11,000 g for 3 min at room temperature, repeat 2 more times to wash pellet.
After the last wash, add 600 μl 6 M Guanadine HCl to pellet and incubate at 37oC for 30 – 60 min to dissolve pellet, centrifuge 11,000 x g for 1 min to remove insoluble debris.
Read the clear supernatant at 360 nm (spectrophotometer may be set to scan 360 – 390 nm wavelength).
Bradford the final sample blanks (usually 1:200 dilution). Use the 6 M Guanadine HCl for standard with the BSA solution.
The final protein carbonyl content = Absorption at 360 nm X 45.45 nmol/ml /protein content (mg).
References
- Fernandez-Sola J, Estruch R, Grau JM, Pare JC, Rubin E, Urbano-Marquez A. The relation of alcoholic myopathy to cardiomyopathy. Ann Intl Med. 1994;120:529–536. doi: 10.7326/0003-4819-120-7-199404010-00001. [DOI] [PubMed] [Google Scholar]
- Patel VB, Why HJ, Richardson PJ, Preedy VR. The effects of alcohol on the heart. Adverse Drug React Toxicol Rev. 1997;16:15–43. [PubMed] [Google Scholar]
- Richardson PJ, Patel VB, Preedy VR. Alcohol and the myocardium. Novartis Found Symp. 1998;216:35–45. doi: 10.1002/9780470515549.ch4. [DOI] [PubMed] [Google Scholar]
- Preedy VR, Patel VB, Reilly ME, Richardson PJ, Falkous G, Mantle D. Oxidants, antioxidants and alcohol: implications for skeletal and cardiac muscle. Front Biosci. 1999;4:e58–66. doi: 10.2741/A480. [DOI] [PubMed] [Google Scholar]
- Laposata EA, Lange LG. Presence of nonoxidative ethanol metabolism in human organs commonly damaged by ethanol abuse. Science. 1986;231:497–499. doi: 10.1126/science.3941913. [DOI] [PubMed] [Google Scholar]
- Espinet C, Argiles JM. Ethanol and acetaldehyde levels in rat blood and tissues after an acute ethanol administration. IRCS Med Sci. 1984;12:830–831. [Google Scholar]
- Ren J, Davidoff AJ, Brown RA. Acetaldehyde depresses shortening and intracellular Ca2+ transients in adult rat ventricular myocytes. Cell Mol Biol. 1997;43:825–834. [PubMed] [Google Scholar]
- Brown RA, Jefferson L, Sudan N, Lloyd LC, Ren J. Acetaldehyde depresses myocardial contraction and cardiac myocyte shortening in spontaneously hypertensive rats: Role of intracellular Ca2+. Cell Mol Biol. 1999;45:453–465. [PubMed] [Google Scholar]
- Ren J, Wold LE, Epstein PN. Diabetes enhances acetaldehyde-induced depression of cardiac myocyte contraction. Biochem Biophys Res Comm. 2000;269:697–703. doi: 10.1006/bbrc.2000.2353. [DOI] [PubMed] [Google Scholar]
- Ren J, Brown RA. Influence of chronic alcohol ingestion on acetaldehyde-induced depression of cardiac contractile function. Alcohol Alcoholism. 2000;35:554–560. doi: 10.1093/alcalc/35.6.554. [DOI] [PubMed] [Google Scholar]
- Leiber C, Barona E, Leo M, Garro A. Effect of chronic alcohol consumption on the metabolism of ethanol. Prog Clin Biochem Res. 1987;241:161–172. [PubMed] [Google Scholar]
- Yoshida A. Molecular genetics of human aldehyde dehydrogenase. Pharmacogenetics. 1992;2:139–147. doi: 10.1097/00008571-199208000-00001. [DOI] [PubMed] [Google Scholar]
- Preedy VR, Richardson PJ. Ethanol induced cardiovascular disease. Br Med Bull. 1994;50:152–163. doi: 10.1093/oxfordjournals.bmb.a072873. [DOI] [PubMed] [Google Scholar]
- Brown RA, Crawford M, Natavio M, Petrovski P, Ren J. Dietary magnesium supplementation attenuates ethanol-induced myocardial dysfunction. Alcohol Clin Exp Res. 1998;22:2062–2072. [PubMed] [Google Scholar]
- De Carli LM, Leiber CS. Fatty liver in the rat after prolonged intake of ethanol with a nutritionally adequate new liquid diet. J Nutrit. 1967;91:331–336. doi: 10.1093/jn/91.3_Suppl.331. [DOI] [PubMed] [Google Scholar]
- Keane B, Leonard BE. Rodent models of alcoholism: a review. Alcohol and Alcohol. 1989;24:299–309. doi: 10.1093/oxfordjournals.alcalc.a044916. [DOI] [PubMed] [Google Scholar]
- Edenberg HJ, Zhang K, Fong K, Bosron WF, Li TK. Cloning and sequencing of cDNA encoding the complete mouse liver alcohol dehydrogenase. Proc Natl Acad Sci USA. 1985;82:2262–2266. doi: 10.1073/pnas.82.8.2262. [DOI] [PMC free article] [PubMed] [Google Scholar]
- Taketo M, Schroeder AC, Mobraaten LE et al. FVB/N: an inbred mouse strain preferable for transgenic analyses. Proc Natl Acad Sci USA. 1991;88:2065–2069. doi: 10.1073/pnas.88.6.2065. [DOI] [PMC free article] [PubMed] [Google Scholar]
- Overbeek PA, Aguilar-Cordova E, Hanten G. Coinjection strategy for visual identification of transgenic mice. Transgenic Res. 1991;1:31–37. doi: 10.1007/BF02512994. [DOI] [PubMed] [Google Scholar]
- Liang Q, Carlson EC, Borgerding AJ, Epstein PN. A transgenic model of acetaldehyde overproduction accelerates alcohol cardiomyopathy. J Pharmacol Exp Ther. 1999;291:766–772. [PubMed] [Google Scholar]
- Duan J, McFadden GE, Borgerding AJ, Norby FL, Ren BH, Ye G, Epstein PN, Ren J. Overexpression of alcohol dehydrogenase exacerbates ethanol-induced contractile defect in cardiac myocytes. Am J Physiol Heart Circ Physiol. 2002;282:H1216–H1222. doi: 10.1152/ajpheart.00780.2001. [DOI] [PubMed] [Google Scholar]
- Ellingsen O, Davidoff AJ, Prasad SK, Berger HJ, Springhorn JP, Marsh JD, Kelly RA, Smith TW. Adult rat ventricular myocytes cultured in defined medium: phenotype and electromechanical function. Am J Physiol. 1993;265:H747–H754. doi: 10.1152/ajpheart.1993.265.2.H747. [DOI] [PubMed] [Google Scholar]
- Aberle NS II, Ren J. Acetaldehyde depresses cardiac contraction in ventricular myocytes: Role of cytochrome p-450 oxidase, xanthine oxidase and lipid peroxidation. Alcohol Clin Exp Res In press. [DOI] [PubMed]
- Ren J, Wold L. Measurement of cardiac mechanical function in isolated ventricular myocytes from rats and mice by computerized video-based imaging. Biol Proced Online. 2001;3:43–53. doi: 10.1251/bpo22. [DOI] [PMC free article] [PubMed] [Google Scholar]
- Yao A, Su Z, Nonaka A, Zubair I, Lu L, Philipson KD, Bridge JHB, Barry WH. Effects of overexpression of the Na+-Ca2+ exchanger on [Ca2+]i transients in murine ventricular myocytes. Circ Res. 1998;82:657–665. doi: 10.1161/01.res.82.6.657. [DOI] [PubMed] [Google Scholar]
- McCall E, Ginsburg KS, Bassani RA, Shannon TR, Qi M, Samarel AM, Bers DM. Ca flux, contractility and excitation-contraction coupling in hypertrophic rat ventricular myocytes. Am J Physiol. 1998;274:H1348–H1360. doi: 10.1152/ajpheart.1998.274.4.H1348. [DOI] [PubMed] [Google Scholar]
- Bers DM. Calcium fluxes involved in control of cardiac myocyte contraction. Circ Res. 1996;87:275–281. doi: 10.1161/01.res.87.4.275. [DOI] [PubMed] [Google Scholar]
- Ide T, Tsutsui H, Hayashidani S. Mitochondrial DNA damage and dysfunction associated with oxidative stress in failing hearts following myocardial infarction. Circ Res. 2001;88:529–535. doi: 10.1161/01.res.88.5.529. [DOI] [PubMed] [Google Scholar]
- Picklo MJ, Amarnath V, McIntyre JO, Graham DG, Montine TJ. 4-Hydroxy-2(E)-nonenal inhibits CNS mitochondrial respiration at multiple sites. J Neurochem. 1999;72:1617–1624. doi: 10.1046/j.1471-4159.1999.721617.x. [DOI] [PubMed] [Google Scholar]
- Picklo MJ Sr., Montine TJ. Acrolein inhits respiration in isolated brain mitochondria. Biochim Biophys Acta. 2001;1535:145–152. doi: 10.1016/s0925-4439(00)00093-4. [DOI] [PubMed] [Google Scholar]
- Griffith OW. Glutathione and glutathione disulfide In: Bergmeyer HU Bergmeyer J (eds) Methods of enzymatic analysis Vol 8, Verlag Chemie Deerfield Beach, FL. 1986; pp. 521-529.
- Ye G, Metreveli NS, Ren J, Epstein PN. Overexpression of metallothionein reverses diabetes induced functional deficits in diabetic cardiomyocytes by inhibiting ROS production. Diabetes In press.
- Esterbauer H, Schaur RJ, Zollner H. Chemistry and biochemistry of 4-hydroxynonenal malonaldehyde and related aldehydes. Free Radic Biol Med. 1991;11:81–128. doi: 10.1016/0891-5849(91)90192-6. [DOI] [PubMed] [Google Scholar]
- Ren J, Roughead ZK, Norby FL, Rakoczy S, Wold LE, Mabey RL, Brown-Borg HM. Increases in insulin-like growth factor-1 level and peroxidative damage after gestational ethanol exposure in rats. Pharmacol Res In press. [DOI] [PubMed]
- Ohhira M, Ohtake T, Matsumoto A, Saito H, Ikuta K, Fujimoto Y, Ono M, Toyokuni S, Kohgo Y. Immunohistochemical detection of 4-hydroxy-2-nonenal-modified-protein adducts in human alcoholic liver diseases. Alcohol Clin Exp Res. 1998;22:145S–149S. doi: 10.1111/acer.1998.22.s3_part1.145s. [DOI] [PubMed] [Google Scholar]
- Montine KS, Reich E, Neely MD, Sidell KR, Olson SJ, Markesbery WR, Montine TJ. Distribution of reducible 4-hydroxynonenal adduct immunoreactivity in Alzheimer disease is associated with APOE genotype. J Neuropathol Exp Neurol. 1998;57:415–425. doi: 10.1097/00005072-199805000-00005. [DOI] [PubMed] [Google Scholar]
- Mantle D, Preedy VR. Free radicals as mediators of alcohol toxicity. Adverse Drug React Toxicol Rev. 1999;18:235–252. [PubMed] [Google Scholar]
- Tanaka E, Terada M, Misawa S. Cytochrome P450 2E1: its clinical and toxicological role. J Clin Pharm Ther. 2000;25:165–175. doi: 10.1046/j.1365-2710.2000.00282.x. [DOI] [PubMed] [Google Scholar]
- Lieber CS. Alcoholic liver injury: pathogenesis and therapy in 2001. Pathol Biol (Paris) 2001;49:738–752. doi: 10.1016/s0369-8114(01)00239-5. [DOI] [PubMed] [Google Scholar]
- Cederbaum AI, Wu D, Mari M, Bai J. CYP2E1-dependent toxicity and oxidative stress in HepG2 cells. Free Radic Biol Med. 2001;31:1539–1543. doi: 10.1016/S0891-5849(01)00743-2. [DOI] [PubMed] [Google Scholar]
- Thum T, Borlak J. Cytochrome P450 mono-oxygenase gene expression and protein activity in cultures of adult cardiomyocytes of the rat. Br J Pharmacol. 2000;130:1745–1752. doi: 10.1038/sj.bjp.0703465. [DOI] [PMC free article] [PubMed] [Google Scholar]
- Novak RF, Woodcroft KJ. The alcohol-inducible form of cytochrome P450 (CYP 2E1): role in toxicology and regulation of expression. Arch Pharm Res. 2000;23:267–282. doi: 10.1007/BF02975435. [DOI] [PubMed] [Google Scholar]
- Hoek JB, Cahill A, Pastorino JG. Alcohol and mitochondria: A dysfunctional relationship. Gastroenterology. 2002;122:2049–2063. doi: 10.1053/gast.2002.33613. [DOI] [PMC free article] [PubMed] [Google Scholar]
- Sarkola T, Iles MR, Kohlenberg-Mueller K, Eriksson CJ. Ethanol acetaldehyde, acetate and lactate levels after alcohol intake in white men and women: effect of 4-methylpyrazole. Alcohol Clin Exp Res. 2002;26:239–245. [PubMed] [Google Scholar]
- Petry NM. A behavioral economic analysis of polydrug abuse in alcoholics: asymmetrical substitution of alcohol and cocaine. Drug Alcohol Depend. 2001;62:31–39. doi: 10.1016/s0376-8716(00)00157-5. [DOI] [PubMed] [Google Scholar]
- Mehta MC, Jain AC, Billie M. Combined effects of alcohol and nicotine on cardiovascular performance in a canine model. J Cardiovasc Pharmacol. 1998;31:930–936. doi: 10.1097/00005344-199806000-00018. [DOI] [PubMed] [Google Scholar]