Abstract
To determine the distribution of the epidermal growth factor (EGF) receptor (EGFR) on the surface of cells responding to EGF as a chemoattractant, an EGFR-green fluorescent protein chimera was expressed in the MTLn3 mammary carcinoma cell line. The chimera was functional and easily visualized on the cell surface. In contrast to other studies indicating that the EGFR might be localized to certain regions of the plasma membrane, we found that the chimera is homogeneously distributed on the plasma membrane and becomes most concentrated in vesicles after endocytosis. In spatial gradients of EGF, endocytosed receptor accumulates on the upgradient side of the cell. Visualization of the binding of fluorescent EGF to cells reveals that the affinity properties of the receptor, together with its expression level on cells, can provide an initial amplification step in spatial gradient sensing.
INTRODUCTION
Chemotaxis, the oriented movement of cells in a spatial gradient of a soluble chemoattractant, is an important mechanism for directing cell motion in normal and pathologic circumstances (Devreotes and Zigmond, 1988; Zigmond, 1996; Milne et al., 1997; Jones et al., 1998). For eukaryotic cells, this process involves a determination of chemoattractant concentration differences over the cell surface. Based on a spatial difference in chemoattractant concentration, amoeboid cells develop a polarized morphology and move toward higher concentrations of chemottractant. Chemoattractant concentrations are typically detected by cell surface receptors. Both G protein-coupled receptors and receptor tyrosine kinases have been shown to mediate chemotactic responses to their specific ligands. Downstream signaling pathways triggered by these receptors are presumed to amplify spatial differences in the number of occupied receptors and to polarize the cell for movement in the appropriate direction. Thus, the initial step in gradient detection relies on the binding properties and spatial distributions of occupied and unoccupied receptors on the cell surface.
Chemotactic responses mediated by G protein-coupled receptors have been extensively studied in Dictyostelium and neutrophils, demonstrating that the receptors are evenly distributed over the cell surface, even in polarized cells (Xiao et al., 1997; Servant et al., 1999). On the contrary, previous data had suggested that receptor tyrosine kinases, such as the epidermal growth factor (EGF) receptor (EGFR), concentrate at the site of protrusions (Gonzalez et al., 1993; Diakonova et al., 1995; Bretscher and Aguado-Velasco, 1998a). In the presence of electric fields and ligand, receptors for EGF, transforming growth factor-β, and fibroblast growth factor are concentrated in the front of the cell, although the majority may be in vesicles (Zhao et al., 1999). Macrophages migrating in a gradient of colony-stimulating factor 1 (CSF-1) also show increased amounts of internalized CSF-1 receptor in the front half of the cell (Jones et al., 1998). Such studies suggest that a different mechanism may be involved in chemotactic responses mediated by receptor tyrosine kinases.
To resolve this issue, we have followed the distribution of a green fluorescent protein (GFP)-tagged EGFR in cells responding to EGF, both as spatial gradients and as sudden changes in concentration. We find that receptors are evenly distributed on the surfaces of chemotaxing cells but that receptor internalization is polarized. In addition, the high affinity of the EGFR together with the high numbers of receptors on the cell surface provides an opportunity for an initial amplification step at the level of the receptor.
MATERIALS AND METHODS
Cells and Reagents
MTLn3 metastatic rat mammary adenocarcinoma cells (Neri et al., 1982) and the E11 stable transfectants derived from MTLn3 cells were grown as previously described (Segall et al., 1996). Unless otherwise mentioned, cells were prepared for all experiments as follows: cells were plated at low density in complete medium for ∼24 h on acid-cleaned dishes (MatTek Corp., Ashland, MA) and were starved for 3 h before the experiment in either MEMH (alpha-MEM, Life Technologies, Grand Island, NY; supplemented with 0.35% bovine serum albumin (BSA) and 12 mM HEPES, pH 7.4) or L15B medium (Life Technologies; supplemented with 0.35% BSA).
Tetramethylrhodamine (TMR) EGF was obtained from Molecular Probes (Eugene, OR), and murine EGF was obtained from Life Technologies. Antitransferrin receptor antibodies were obtained from PharMingen (San Diego, CA) (22191D), anti EGFR receptor antibody was obtained from Upstate Biotechnology (Lake Placid, NY), and labeled secondary antibodies were from Accurate Biochemicals (Westbury, NY).
Construction of Cells Expressing GFP-tagged Rat EGFR
The rat EGFR cDNA was generously provided by H. S. Earp (University of North Carolina, Chapel Hill, NC). Polymerase chain reaction (PCR) primers were designed to produce a product with 5′ SalI digestion site with Kozak consensus sequence and a 3′ SacII site. The primer sequences were: TGAGTCGACGCGGCCGCCACCATGCGACCCTCAGGGACTGC and TTCCGCGGTGCTCCAATAAACTCACTGCT. PCR was performed using Pwo polymerase (Promega, Madison, WI). The PCR product was fully digested with SacII followed by partial digestion with SalI, and the larger partial digest product was subcloned into pEGFPN1 digested with SacII and SalI. The absence of PCR-induced mutations was confirmed by sequencing. The sequence linking the C-terminal amino acid of the EGFR to the N-terminal amino acid of GFP was ProArgAlaArgAspProProValAlaThr.
MTLn3 cells were transfected with the EGFR–GFP fusion construct using lipofectamine and stable transfectants were selected with neomycin. Isolated clones were subcloned and screened for membrane-bound GFP fluorescence. One clone, termed E11, was used for further experiments.
Western Blotting
Samples were collected using SDS sample buffer or NP40 lysis buffer directly from culture dishes. For quantitation, equal protein amounts from MTLn3 and E11 cell lysates in NP40 lysis buffer were loaded on the gel in 2-fold dilutions. Blots were probed with a primary antibody to the EGFR that recognizes the rat EGFR (Santa Cruz). Enhanced-chemiluminescence was used for the detection of primary antibody binding, and bands of equivalent intensity on the same blots were identified. The corresponding amounts of protein loaded were used to estimate the relative numbers of receptors in E11 cells compared with MTLn3 cells.
EGF-induced Lamellipod Extension and Chemotaxis
EGF-induced lamellipod extension was measured as changes in total cell area and chemotaxis to EGF was measured in modified Boyden chambers as previously described (Segall et al., 1996; Bailly et al., 1998a; Wyckoff et al., 1998).
Immunofluorescence
Immunofluorescence labeling for transferrin receptors was performed as previously described (Bretscher and Aguado-Velasco, 1998a; Bailly et al., 1998b).
Binding of TMR–EGF
To measure the binding of TMR–EGF, cells were starved for 3 h in MEMH, were washed with ice-cold DPBSB (DPBS with 0.5 mM MgCl2, 0.5 mM CaCl2, and 0.35% BSA), and were placed at 4°C. The cells were incubated with varying concentrations of TMR–EGF and EGF in ice-cold DPBSB for 3 h at 4°C (Lichtner et al., 1995), were rinsed four times with ice-cold DPBSB, and were fixed with 3.7% formaldehyde in fix buffer (Bailly et al., 1998b) for 20 min. Cells were imaged on an Olympus (Melville, NY) IX70 microscope with a 40× long working distance objective coupled to a cooled CCD camera (Photometrics, Roper Scientific, Tucson, AZ) using IPLab Spectrum software (Scanalytics, Fairfax, VA). Constant exposure and gain settings were used for all samples on a given day to allow for direct linear comparison. Digitized images were converted linearly in NIH Image (http://rsb.info.nih.gov/nih-image/) and were analyzed for average cellular fluorescence in the fluorescein channel (for GFP fluorescence) and the rhodamine channel (for TMR–EGF fluorescence). For each cell, average background fluorescence around that cell was subtracted. To compare total TMR–EGF binding between E11 and MTLn3 cells, the average fluorescence of cells binding 5 nM TMR–EGF + 100 nM EGF (nonspecific binding) was subtracted from the average fluorescence of cells binding 5 nM TMR–EGF alone.
Time-lapse Live-Cell Fluorescence Imaging
Cells were starved in L15 with 0.35% BSA for 3 h and were viewed on an Olympus IX70 microscope with 60× NA 1.4 infinity-corrected optics coupled to a Power Macintosh (Apple Computer, Cupertino, CA)-driven cooled CCD camera (Photometrics) using IPLab Spectrum software (Scanalytics) in a 37°C environmental chamber. The dishes were covered with mineral oil (Sigma Chemical, St. Louis, MO) to reduce drying artifacts, and excitation light levels were 1–5% of maximum with 1- to 5-s exposure times for optimal viability. To minimize cell damage by the imaging process, exposure times that only visualized the cell expressing the highest density of EGFR–GFP were used when analyzing the distribution of labeled EGF (TMR–EGF) and EGFR (EGFR–GFP) on the same cells. Similar results were seen for cells expressing lower amounts of EGFR–GFP if only imaging for TMR–EGF over shorter periods of time was performed. User-programmed scripts took phase and fluorescence images every 5–30 s. Fluorescence intensity of extending flat lamellipods was quantitated as a function of distance back from the leading edge in NIH Image using a user-defined macro (Chan et al., 1998).
Micropipets were pulled on a Narishige (East Meadow, NY) PB-7 puller. They were filled with 50 μM EGF (for stimulation by diffusion), 50 nM EGF, or 250 nM EGF (for chemotaxis or saturation stimulation, respectively, using pressure pulses). For pressure ejection of EGF, an Eppendorf (Eppendorf Scientific, Inc., Westbury, NY) microinjection system and pressures of 10–40 psi were used.
For confocal live cell imaging, a Noran (Middleton, WI) OZ real-time imaging system on an Olympus IX 70 microscope with 60× NA1.4 infinity-corrected optics was utilized with an environmental chamber, as described above. Cells were imaged with 19% of maximum laser intensity using a 15-μm slit size. Images were typically averaged 32 times for each confocal slice (1 s total exposure), and slices were obtained every 0.5 or 1 μm. A new z-series was obtained every 20–40 s. High-speed and reproducible Z planes were achieved using a piezo controller. Z-series stacks were imported into NIH-Image and analyzed.
For the analysis of cells stained with NBD-C6-SM (Molecular Probes), cells were starved in MEMH for 3 h, then were rinsed twice with MEMH (without BSA) and stained with 25 μM total lipid (NBD-C6-SM:dioleylphosphatidylcholine 1:1) at 36°C for 30 min. They were then rinsed five times with MEMH lacking BSA, twice with L15, and were imaged on the cooled CCD station described above.
Vesicle Counting
To evaluate the direction of vesicle movement in cells exposed to a homogeneous concentration of EGF, individual cells were observed and the movement of EGFR-containing vesicles was recorded using time lapse microscopy. The numbers reported concern only the vesicles, regardless of size, that were moving consistently in one given direction (either toward the leading edge, or from the leading edge toward the nucleus) during the course of a video (5–10 min), and do not reflect the total number of vesicles. A significant number of vesicles mainly orbited around the nucleus, while others simply could not be followed from frame to frame. A total of 140 vesicles (large and small) were analyzed from 15 cells in eight different EGF upshifts, and the percentage of vesicles moving toward and away from the leading edge were calculated. It should be noted that the percentage of vesicles moving toward the leading edge is probably an overestimate of the real value, because the vesicles moving away from the edge were sometimes too dense to be counted with complete accuracy.
To determine the distribution of EGFR-containing vesicles in polarized cells, the number of vesicles were counted on a steady image of cells after they had clearly oriented toward the gradient of EGF (3–5 min after initiation of the gradient). Each cell was divided into a posterior part (away from the pipet) and an anterior part (facing the pipet) using a line drawn perpendicularly to the pipet orientation through the center of the nucleus. The vesicles were counted in the two different parts, and the numbers were converted to the percentage of total vesicles for each cell. Results are expressed as mean ± SEM.
Gradient Evaluation
Changes in the steepness of the gradient were evaluated using fluorescence measurements in 10 cells responding to a gradient of TMR–EGF generated by pressure applied to micropipets filled with 50 nM TMR–EGF. Measurements for each cell were made using a constant (roughly 1-μm) region on an Olympus microscope to allow linear measurements of fluorescence, as described above. For each cell, fluorescence was measured as follows: 1) an extending lamellipod on the side of the cell closest to the micropipet, 2) in the medium next to the lamellipod, 3) on a lamellipod or flat membrane structure on the side of the cell away from the micropipet, and 4) in the medium next to the side of the cell away from the micropipet. The differences in fluorescence in the medium then were calculated by subtracting the fluorescence value for the medium on the side near the micropipet from the value for the medium on the side far from the micropipet. For TMR–EGF bound to the cell surface, the fluorescence value for the medium next to the appropriate side of the cell was subtracted from the cell value. Then the difference in fluorescence between the sides of the cell near and far from the micropipet was calculated. For measuring TMR–EGF in internalized vesicles, the average value of the fluorescence of the internalized vesicles on the side of the cell closer to the micropipet was measured and the fluorescence value for the medium on the side of the cell near the micropipet was subtracted.
RESULTS
The EGFR–GFP Chimera Is Functional
To follow the distribution of EGFRs on cells responding to EGF, an EGFR–GFP fusion protein was expressed in MTLn3 cells. Stable clones expressing the construct were selected by screening neomycin-resistant colonies by fluorescence microscopy. The E11 clone that showed relatively high GFP fluorescence associated with cell membranes was analyzed in more detail and was used in further experiments.
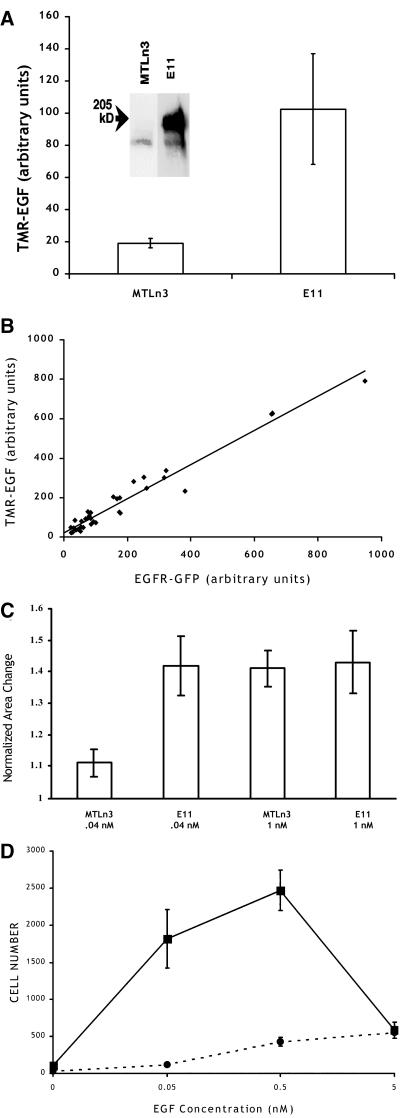
The EGFR–GFP construct expressed in E11 cells was deemed to be functional according to the following criteria. Western blotting with an anti-EGFR antibody revealed the expression of a new band of increased molecular weight, as expected from the fusion of GFP to the receptor (Figure 1A, inset). The ability of the transfected receptor to bind EGF was evaluated using TMR-labeled EGF, and E11 cells bound roughly five times more TMR–EGF than MTLn3 cells (Figure 1A), which is consistent with quantitation by Western blot (our unpublished results). TMR–EGF binding correlated with GFP fluorescence on a single-cell basis as well (Figure 1B), confirming that the EGF binding reflected the expression level of the EGFR–GFP construct.
Figure 1.
The EGFR–GFP chimera in E11 cells is functional. (A) Binding of 5 nM TMR–EGF on MTLn3 (n = 25) and E11 (n = 35) cells. Means and SEMs are plotted. Inset: Western blot showing the expression of the GFP construct in E11 cells, with the position of the 205-kDa molecular weight marker shown (arrow). (B) Correlation of EGFR–GFP expression (GFP fluorescence) with TMR–EGF binding (TMR fluorescence) on individual E11 cells. (C) Relative levels of EGF-induced lamellipod extension. Means and SEMs are plotted (n = 10 cells for each condition). (D) Chemotactic responses of E11 (squares, solid line) and MTLn3 (circles, dashed line) cells. Values given as mean and SEM of three different measurements.
Using EGF-induced lamellipod extension as a sensitive assay for receptor functionality (Segall et al., 1996; Bailly et al., 1998b), EGFR–GFP expressing E11 cells were found to be more sensitive to the addition of EGF compared with control untransfected MTLn3 cells (Figure 1C). Similarly, chemotactic responses to EGF were increased compared with the parental cell line and were shifted to lower EGF concentrations, as expected from an increase in the expression of the functional receptor (Figure 1D). Furthermore, we observed a dramatic increase in tyrosine phosphorylation (as measured by mean fluorescence intensity) in E11 cells after stimulation with EGF, with a clear accumulation of phosphotyrosine at the membrane, which is consistent with activation of the transfected GFP-tagged receptor (our unpublished results). These results are consistent with analyses by Carter and Sorkin (1998) that fusion of GFP to the C terminus produces a functional receptor.
Cell Responses to EGF Upshifts
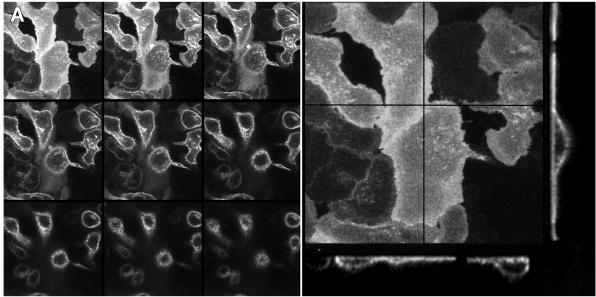
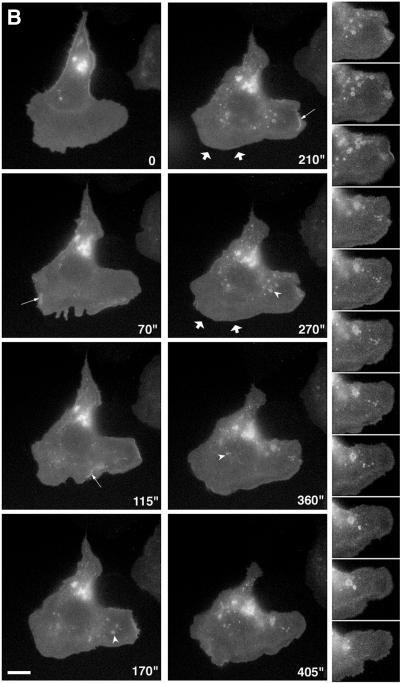
In the absence of stimulation, the distribution of the EGFR–GFP construct on the plasma membrane was uniform (Figure 2A; Figure 2B first frame), with apparent slight increases in ruffles or internalized vesicles, most likely due to the three-dimensional character of these structures. On stimulation with EGF, E11 cells show transient ruffling (Figure 2B, thin arrows; see corresponding video), as well as typical horizontal lamellipod extension (large arrows), as has been seen in the parental MTLn3 cells (Bailly et al., 1998b; Wyckoff et al., 1998). Similar effects are seen using time-lapse confocal microscopy and stereo reconstruction (our unpublished results). The stimulation with EGF was also followed by the appearance of large bright vesicles (white arrowheads), that could be seen forming from the ruffles (Figure 2B and video) and from the extending lamellipods. In regions of flat lamellipod extension, smaller fluorescent dots also could be observed forming from ruffles and moving back from the extending lamellipods (Figure 2B, sequence at right). The video clearly demonstrates that after stimulation the cell undergoes ruffling and extension phases, most of the vesicles (large or small) being generated when the ruffles curl back at the edge of the lamellipod. It is also clear from the video (not shown in Figure 2B) that a lot of ruffling occurs on the top of the cell and extending lamellipod, generating numerous vesicles (visible in the frames that have a slightly higher focus in the video). These two types of internalization (large vesicles and small punctate structures) are consistent with current knowledge of endocytosis and probably reflect macropinocytosis (Swanson and Watts, 1995) and clathrin-mediated (Marsh and McMahon, 1999) endocytic events, respectively.
Figure 2.
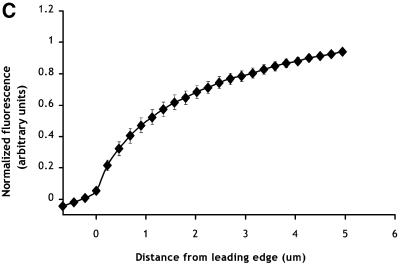
The EGFR–GFP chimera is not concentrated at the leading edges of the extending lamellipods. (A) Distribution of the EGFR–GFP in unstimulated E11 cells. Left: Z-series images collected with a Noran confocal microscope as described in MATERIALS AND METHODS. Right: projection and corresponding transverse sections of the z-series shown on top. The crossed lines in the projection mark the positions at which the transverse sections were made. (B) Response of an E11 cell to the addition of 5 nM EGF at 0 s using GFP fluorescence. Thin arrows, ruffle; large arrows, extending lamellipod; arrowheads, large EGFR–GFP-containing vesicles. At right is a detail of a portion of the lamellipod of the same cell showing the formation of a group of small vesicles from a ruffle and the movement of the vesicles back from the leading edge over a total of 215 s. Bar, 10 um. (C) Quantitation of EGFR–GFP fluorescence in extending lamellipods. GFP fluorescence was quantitated as a function of distance from the leading edge of the lamellipod (0 μm). Mean ± SEM, n = 12.
The ability of certain parts of the cell to extend more efficiently than others in response to EGF could reflect localized regions of increased density of EGFR. Indeed, studies with A431 cells have suggested that there were increases in numbers of EGFRs in EGF-induced protrusions (Rijken et al., 1991; Gonzalez et al., 1993). However, as can be seen in Figure 2, A and B, receptor density on the plasma membrane appears to be uniform. Furthermore, although there was dramatic internalization of the receptor mainly from sites of extension, if we analyzed areas of the cell periphery in which flat lamellipods were extending, there was no indication of increased fluorescence at the edges of the lamellipods (Figure 2C), confirming that receptor density over the cell surface remained uniform.
Distribution of the EGFR in Polarized Cells
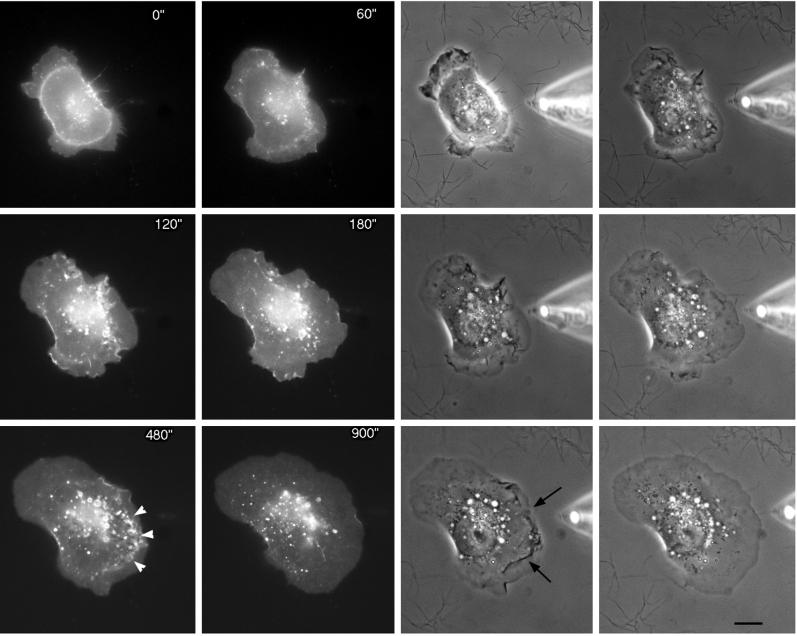
An even distribution of EGFRs would provide chemotactic cells with greater sensitivity to changing gradients of the chemoattractant. However, it is possible that receptors only accumulate in particular regions of the plasma membrane under conditions of cell polarization, similar to apical/basal segregation of cell surface proteins or to the accumulation of the yeast mating factor receptor in spatial gradients of mating factor. To evaluate this possibility, cells were stimulated with spatial gradients of EGF using micropipets filled with EGF to generate polarized extension (Figure 3 and corresponding video). After a few minutes in the presence of the gradient of EGF, the cells reoriented themselves and became polarized toward the gradient (Bailly et al., 1998b; and Figure 3). However, there was again no evidence for a significant increase in receptor density at the leading edges of lamellipods in these conditions. On the other hand, increased ruffling (Figure 3, arrows) and internalization of EGF-receptors (Figure 3, arrowheads) were observed on the side of the cell nearest the pipet, indicating polarization of receptor endocytosis. It is possible that the density of the receptor is increased on dorsal ruffles just before or concomitant with internalization, which is most easily seen by viewing the video from which Figure 3 was made. Evaluation of the number of EGFR-containing vesicles 3–5 min after stimulation when they are clearly oriented toward the pipet showed that 66 ± 6% of the vesicles in polarized cells are concentrated in the anterior part of the cell facing the EGF-containing pipet (572 vesicles were analyzed on nine different cells, as defined in MATERIALS AND METHODS).
Figure 3.
Internalized EGFR–GFP accumulates on the source side of the cell in spatial gradients of EGF. A pipet containing 50 μM of EGF was placed next to an E11 cell at 0 s, and cell responses followed in phase (right) and with GFP fluorescence (left). Black arrows point to a ruffling area, showing EGFR internalization (white arrowheads). Bar, 10 um.
Role of Polarized Membrane Secretion in Maintaining Even Receptor Distribution
Given the increased endocytosis of the receptor at the protruding edges of the cell, one mechanism for maintaining a uniform distribution of receptors might be exocytosis of new receptors at the leading edge of the cell. It also has been proposed that exocytosis of new membrane at the leading edge might be the key mechanism for determining sites of cell protrusion (Bretscher and Aguado-Velasco, 1998b). Receptors, as they bind the attractant, move back from the leading edge as they are endocytosed. Exocytosis of new receptors might compensate for the loss of these endocytosed receptors. Such exocytic mechanisms might predict the following: 1) movement of new receptors to the leading edge of the cell, where they can bind EGF and maintain the polarization; 2) massive movement of membrane to the leading edge of the cell to replace the endocytosed membrane and to provide new membrane for the cell protrusion; 3) increases in recycled proteins such as the transferrin receptor at the leading edge of the cell; and 4) a gradient of EGF bound to the cell with the lowest amount of EGF bound at the extreme edge of the lamellipod (where EGF has not yet bound newly exocytosed receptors).
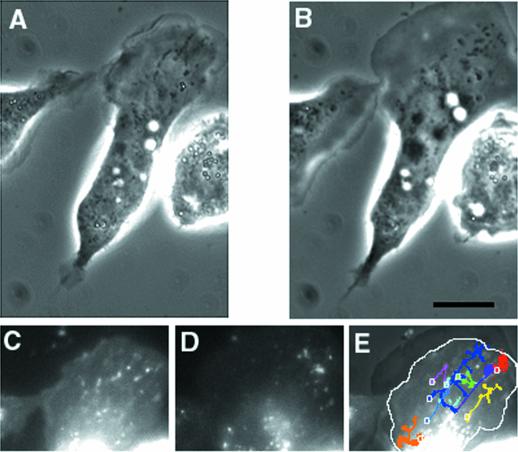
The above predictions were tested to evaluate the likelihood of the receptor distribution being maintained by polarized secretion of membrane. First, analysis of the movement of EGFR–GFP-containing vesicles at the leading edge showed that the majority of them (86%) moved back from the leading edge, and only after careful observation were we able to detect vesicle movement toward the leading edge (14% of the moving vesicles, see MATERIALS AND METHODS). Furthermore, most of the vesicles moving toward the leading edge did not reach the extreme edge of the lamellipod, and we were not able to identify fusion of these vesicles at the leading edge (our unpublished results). In addition, movement of membrane particles toward the leading edge of EGF-stimulated cells was not observed using membrane dyes such as NBD-C6-CM, PKH26, or NBD-C6-SM. As shown in Figure 4 and the corresponding video, observation of membrane-recycling dynamics using NBD-C6-SM showed that most of the vesicles orbit as satellites around the nucleus and that relatively few actually move toward the leading edge. The vesicles that move away from the center of the cell tend to go to limited regions of the periphery, while lamellipod extension occurs over a much broader area. Membrane recycling is occurring during this time, as indicated by the reduction in overall fluorescence in Figure 4D compared with Figure 4C. Comparable results were obtained with the two other membrane dyes used (our unpublished results). Transferrin receptors, which are part of a rapidly recycling receptor system (Inoue et al., 1993; Cavanaugh and Nicolson, 1998; Bretscher and Aguado-Velasco, 1998a) did not demonstrate dramatic concentration on extending lamellipods (Figure 5). Finally, addition of TMR–EGF did not produce a gradient of rhodamine fluorescence on extending lamellipods. Rather, the extreme edge of the lamellipod appeared to be as intensely labeled as the regions back from the edge (Figure 6A). Thus, we conclude that membrane exocytosis at the leading edge of the cell is unlikely to be the cause of the even receptor distribution on the plasma membrane.
Figure 4.
Movement of membrane vesicles during lamellipod extension. The cells were starved for 2 h then exposed to NBD-C6-SM for 30 min, followed by imaging on the Olympus CCD station. At time 0, 5 nM EGF with 0.35% BSA was added to the cells. The addition of BSA allows the visualization of recycling vesicles by removing the label from the plasma membrane. Phase contrast (A and B) and fluorescence (C and D) images of a cell 60 s (A and C) and 220 s (B and D) after the addition of EGF. (E) A superposition of the fluorescence images is shown together with the phase image of the top of the cell (B). It shows the paths taken for all the vesicles observed in the lamellipod area. The origin of each vesicle is shown as a white ring, and the different colors show the directions of movement of different vesicles (some of which split to form multiple progeny). The white outline indicates the position of the edge of the lamellipod (A) before extension has occurred. During EGF-induced lamellipod extension, most vesicles move toward the upper right side of the cell, although lamellipod extension occurs over the entire top of the cell. Bar, 10 um.
Figure 5.
Transferrin receptors are not concentrated at the leading edges of extending lamellipods after EGF stimulation. Left: phase contrast image. Right, transferrin receptors visualized by immunofluorescence. Bar, 10 um.
Figure 6.
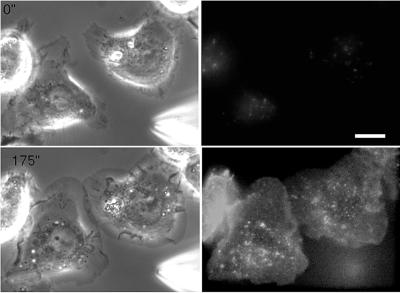
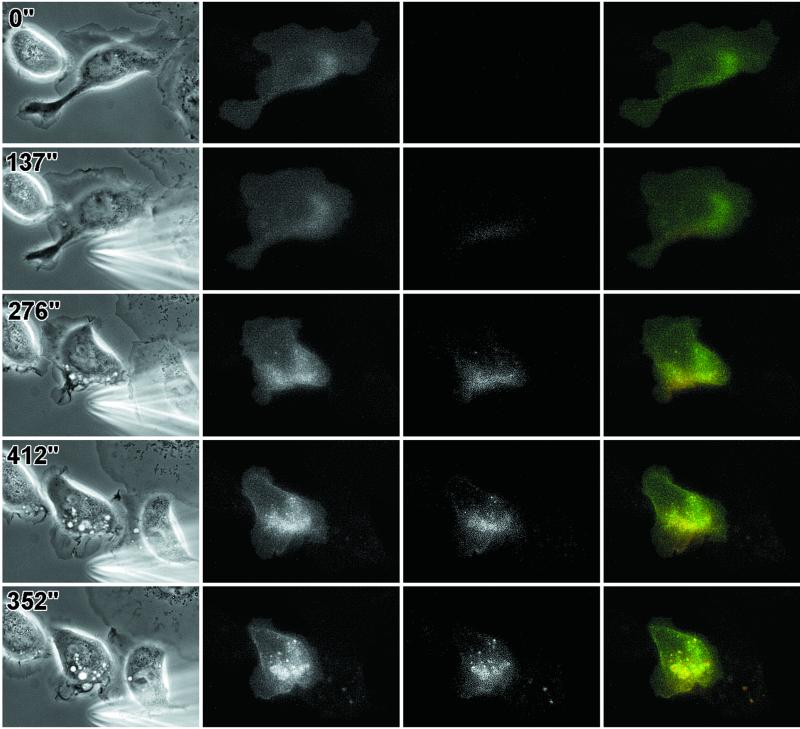
EGF localization during chemotactic responses. (Above) TMR–EGF is concentrated on the surfaces of cells. A pipet filled with 250 nM TMR–EGF was placed near E11 cells, and a pressure pulse causing a saturating release of TMR–EGF was initiated at 0 s. Weak autofluorescence of the cells can be seen before the release of TMR–EGF. Phase (left) and TMR–EGF fluorescence (right) are shown. (Facing page) Internalized TMR–EGF and EGFR–GFP accumulate on the sides of cells closest to the micropipet. Pressure ejection from a pipet filled with 50 nM TMR–EGF was initiated at 0 s, and cells were imaged using phase contrast (left), GFP fluorescence (green, left), and TMR–EGF fluorescence (red, right). Overlap of green and red fluorescence generates a yellow color (far right image). Bar, 10 um..
Localization of EGF During Gradient Detection
We used TMR-labeled EGF to analyze the binding of EGF to the receptors. Application of saturating amounts of TMR–EGF indicated that cells can concentrate EGF on their plasma membranes since the TMR–EGF fluorescence was higher on cells than in the surrounding medium (Figure 6A). This observation suggests two mechanisms by which high-affinity receptors could enhance gradients of chemoattractant. First, at low EGF concentrations, the concentration of the ligand on the cell surface indicates that the absolute number of bound ligands is increased compared with the number of free EGF molecules present in an equivalent volume of solution, potentially amplifying any signals that are generated. Second, because EGFRs have off rates and internalization rates, which are both on the order of minutes (French et al., 1995; Ware et al., 1997), cells can act like absorbers of EGF. Thus, as EGF molecules bind to the side of the cell closest to the micropipet, they are removed from solution. This potentially reduces the effective concentration of EGF reaching receptors at the rear of the cell, and consequently lowers the internalization rate in that area.
To evaluate the effects of receptor affinity on gradient detection, micropipets were filled with low concentrations of TMR–EGF (50 nM, Figure 6B). On application of a pressure pulse to induce the release of TMR–EGF from the micropipet, accumulation of TMR–EGF on the side of the cell closest to the pipet could be detected. A dramatic enhancement of the internalization of labeled EGF on the side of the cell closest to the pipet followed. Imaging of both the receptor (EGFR–GFP) and the ligand (TMR–EGF) demonstrated that the internalization of the ligand–receptor complex was highly polarized, although, as reported above, there was no accumulation of the receptor itself on the plasma membrane nearest to the pipet. To determine whether the cells enhanced the gradient of EGF, fluorescence due to TMR–EGF in the medium and on the cell surface was measured on flat lamellipods near and far from the pipet. The mean difference in medium TMR–EGF between the side of the cell nearest the pipet and the side away from the pipet (in arbitrary units) was 116 ± 23. The corresponding value for surface TMR–EGF was 294 ± 121. These values are significantly different from each other (p < 0.02 [t test]), indicating a 2.5-fold larger absolute difference in TMR–EGF on the cell surface compared with the medium. The amount of EGFR–GFP fusion protein measured at the same positions in the same cells showed no significant difference between the two ends of the cells. To determine whether the presence of the cell actually steepened the relative concentration gradient across the cell, we compared the relative amounts of TMR–EGF bound to the two ends of the cell. There was 2.5 ± 0.29 times more TMR–EGF bound to the side of the cell nearest to the pipet. Using the diffusion equation, and the distances between the cells and the pipet, that ratio would be predicted to be 3.4 ± 0.28. Thus, we do not detect an enhancement of the relative gradient across the cell. On the other hand, when the amount of TMR–EGF present in vesicles was quantified, the maximum intensity of internalized TMR–EGF on the side of the cell closest to the pipet was found to be six times the amount of TMR–EGF bound to the side of the cell away from the pipet. These results suggest that although receptor densities do not vary across the cell surface, the affinity and internalization properties of the receptors can amplify the apparent signal in the two following ways: 1) by increasing the absolute difference of ligand bound to the two ends of the cell, and 2) by concentrating the internalized ligand–receptor complexes on the side of the cell closest to the gradient source.
DISCUSSION
We focused this study on examining the initial steps in receptor tyrosine kinase–ligand interaction and its contributions to chemotactic responses, using a GFP-tagged EGFR. The EGFR appeared to be uniformly distributed over the cell surface under all of the following observed conditions: unstimulated motility, lamellipod extension in response to a uniform increase in EGF concentration, and during polarized motility in response to an EGF gradient. This uniform distribution is consistent with what was observed for heterotrimeric G protein-coupled chemoattractant receptors in Dictyostelium (Xiao et al., 1997) and neutrophils (Servant et al., 1999). On the other hand, previous studies of the EGFR have suggested that the receptor might be concentrated in lamellipods in A431 cells (Diakonova et al., 1995) or in keratinocytes polarized by electric fields (Zhao et al., 1999). However, contrary to the MTLn3 cells studied here, A431 cells have extremely high levels of EGFRs, a fraction of which might then be more stably associated with certain subcellular compartments. In keratinocytes polarized by electric fields, the receptor–ligand complex might be physically oriented by the electric field (Giugni et al., 1987), such redistribution being unnecessary in simple chemotactic gradients.
Although there was clear polarization in the sites of internalization of the EGFR, with internalization occurring just behind the leading edges of cells, we could not find any evidence of polarized membrane recycling to the leading edges of extending lamellipods. Thus, it is unlikely that polarized membrane secretion is responsible for the maintenance of the even surface distribution of the receptor we observed in our system. Likewise, the major sites of membrane reinsertion do not appear to be at the leading edge of the extending lamellipod. More probably, membrane insertion occurs over the dorsal surface of the cell where dorsal protrusions transiently form, providing additional membrane to allow extension at sites determined by the chemotactic orientation of the cell. Lateral diffusion of receptors with a diffusion coefficient of 0.5 − 1 × 10⁻¹⁰ cm2/s (Benveniste et al., 1988; Kusumi et al., 1993; Brock et al., 1999) is likely to be sufficient for maintaining an even receptor distribution, given the lamellipod extension rates of roughly 1 μm/min. These results are consistent with studies of neutrophils that indicate that membrane insertion is unlikely to occur directly at the site of lamellipod extension (Lawson and Maxfield, 1995; Lee et al., 1990). We cannot rule out the possibility that a small fraction of membrane vesicles fuse at the leading edge or that vesicles that are poorly stained by all the dyes that we have tried (NBD-C6-SM, NBD-C6-CM, or PKH26) are the primary vesicles moving to the leading edge. However, such vesicles would not carry concentrated amounts of EGFR either, since we observe movement of GFP-labeled vesicles away from the leading edge rather than toward it. Similarly, although there are significant numbers of transferrin receptors cycling in these cells (Inoue et al., 1993), the recycling is likely to be occurring over the entire cell surface since we did not observe a significant concentration of the transferrin receptor on the leading edges of extending lamellipods.
Due to the relatively high affinity of the receptor, EGF becomes concentrated on the cell surface relative to its concentration in suspension. For example, the typical low-affinity EGF binding site has a Kd of around 1 nM (Lichtner et al., 1995). With 50,000 receptors per cell, and a cell volume of 2 pl, when the EGF concentration in the medium is 1 nM, the concentration of occupied receptors averaged over the entire cell volume will be 21 nM. However, the receptors are concentrated on the cell surface and not evenly distributed throughout the cell, resulting in even more dramatic fluorescence at the cell membrane. This property raises the possibility of a receptor-mediated mechanism for gradient amplification in which the absolute difference in the amount of chemoattractant bound to the near and far ends of the cell is greater than the difference in molecules in the medium between the two ends of the cell. Our measurements using fluorescent EGF confirmed that the difference in bound EGF between the two ends of the cell was greater than the corresponding difference in the medium. Dictyostelium chemoattractant receptors do not have such high affinities (Janssens and Van Haastert, 1987), and increases in bound ligand due to the affinity are unlikely to occur in these cells. On the contrary, neutrophils do have high-affinity receptors for chemoattractants (Sklar, 1987), and these affinity properties have been used for detailed comparisons of ligand–receptor kinetics with downstream signaling pathways in neutrophils (Sklar, 1987), although not in studies involving spatial gradients of fluorescent ligands.
Because of the relatively low off rate for dissociation of EGF from its receptor, it is likely that as an EGF molecule binds to a receptor, it is internalized before it is released. In this case, most of the ligand that binds the receptors would be internalized, resulting in two effects. First, there may be a perturbation of ligand binding to the cell: for a gradient of chemoattractant, the binding of EGF to the front of the cell will sequester molecules that would normally diffuse to the rear of the cell and bind there, amplifying the gradient detected by the cell. Such effects could also steepen morphogenetic gradients during development. However, our measurements of TMR–EGF bound to flat lamellipods do not show an enhancement greater than that expected from diffusion from a point source, arguing against this effect being significant under our stimulation conditions. A second effect of the internalization of the EGFR is polarization of the endocytosed receptor–ligand complexes. We found that endocytosis of the receptor and the ligand was polarized to the side of the cell exposed to the higher concentration of EGF. This is consistent with studies of the CSF-1 receptor, which indicate that the amount of internalized receptor is higher at the front of the cell than at the rear in cells polarized by a gradient of CSF-1 (Jones et al., 1998). Transient increases in gradient steepness that are present during the formation of the gradient (when release is initiated from the pipet) are retained in the form of increased amounts of internalized complexes on the side of the cell closest to the source. Such prolonged increases may aid in providing an initial determination of the source of the chemoattractant or may stabilize cell polarization.
In summary, we envision the following sequence of events occurring for the early stages of chemotactic responses of cells stimulated with a spatial gradient of EGF. A responsive cell begins with a uniform distribution of EGFRs over the cell surface with relatively small amounts of the internalized receptor. As the EGF gradient is applied, higher amounts of EGF bind to the side of the cell closest to the source. The affinity of the receptors amplifies the signal provided by low concentrations of EGF. In addition, internalized receptor–ligand complexes remain concentrated on the side of the cell closest to the EGF source, potentially continuing to contribute to polarization of the cell. The fusion of recycling vesicles occurs over the dorsal surface of the cell, providing additional membrane for lamellipod extension, but not focussed at the precise site of extension. Internalization of the receptor occurs through both small clathrin-coated pits as well as through the formation of endosomes from ruffles. Further internal signaling mechanisms probably aid in amplifying the signaling difference between receptors on the near and far sides of the cell to generate a polarized cell that moves toward the source of EGF. We expect that this scenario will be applicable to all chemoattractant receptors that have high affinity and are endocytosed rapidly in response to binding of the ligand.
Supplementary Material
ACKNOWLEDGMENTS
We thank H. S. Earp for the cDNA of the rat EGFR, and the Analytical Imaging Facility for microscopy. This work was supported by grants from the National Institutes of Health, the Department of Defense, and the Mortimer Harriman Trust. J.E.S. is supported by an Established Scientist Award from the New York City Affiliate of the American Heart Association. M.B. is supported by National Institutes of Health training grant 2-T32-CA09475. Videos corresponding to the figures can be seen at http://www.aecom.yu.edu/asb/segall/segall.htm.
Footnotes
REFERENCES
- Bailly M, Condeelis JS, Segall JE. Chemoattractant-induced lamellipod extension. Microsc Res Tech. 1998a;43:433–443. doi: 10.1002/(SICI)1097-0029(19981201)43:5<433::AID-JEMT9>3.0.CO;2-2. [DOI] [PubMed] [Google Scholar]
- Bailly M, Yan L, Whitesides GM, Condeelis JS, Segall JE. Regulation of protrusion shape and adhesion to the substratum during chemotactic responses of mammalian carcinoma cells. Exp Cell Res. 1998b;241:285–299. doi: 10.1006/excr.1998.4031. [DOI] [PubMed] [Google Scholar]
- Benveniste M, Livneh E, Schlessinger J, Kam Z. Overexpression of epidermal growth factor receptor in NIH-3T3-transfected cells slows its lateral diffusion and rate of endocytosis. J Cell Biol. 1988;106:1903–1909. doi: 10.1083/jcb.106.6.1903. [DOI] [PMC free article] [PubMed] [Google Scholar]
- Bretscher MS, Aguado-Velasco C. EGF induces recycling membrane to form ruffles. Curr Biol. 1998a;8:721–724. doi: 10.1016/s0960-9822(98)70281-7. [DOI] [PubMed] [Google Scholar]
- Bretscher MS, Aguado-Velasco C. Membrane traffic during cell locomotion. Curr Opin Cell Biol. 1998b;10:537–541. doi: 10.1016/s0955-0674(98)80070-7. [DOI] [PubMed] [Google Scholar]
- Brock R, Vamosi G, Vereb G, Jovin TM. Rapid characterization of green fluorescent protein fusion proteins on the molecular and cellular level by fluorescence correlation microscopy. Proc Natl Acad Sci USA. 1999;96:10123–10128. doi: 10.1073/pnas.96.18.10123. [DOI] [PMC free article] [PubMed] [Google Scholar]
- Carter RE, Sorkin A. Endocytosis of functional epidermal growth factor receptor-green fluorescent protein chimera. J Biol Chem. 1998;273:35000–35007. doi: 10.1074/jbc.273.52.35000. [DOI] [PubMed] [Google Scholar]
- Cavanaugh PG, Nicolson GL. Selection of highly metastatic rat MTLn2 mammary adenocarcinoma cell variants using in vitro growth response to transferrin. J Cell Physiol. 1998;174:48–57. doi: 10.1002/(SICI)1097-4652(199801)174:1<48::AID-JCP6>3.0.CO;2-G. [DOI] [PubMed] [Google Scholar]
- Chan AY, Raft S, Bailly M, Wyckoff JB, Segall JE, Condeelis JS. EGF stimulates an increase in actin nucleation and filament number at the leading edge of the lamellipod in mammary adenocarcinoma cells. J Cell Sci. 1998;111:199–211. doi: 10.1242/jcs.111.2.199. [DOI] [PubMed] [Google Scholar]
- Devreotes PN, Zigmond SH. Chemotaxis in eukaryotic cells: a focus on leukocytes and Dictyostelium. Annu Rev Cell Biol. 1988;4:649–686. doi: 10.1146/annurev.cb.04.110188.003245. [DOI] [PubMed] [Google Scholar]
- Diakonova M, Payrastre B, van Velzen AG, Hage WJ, van Bergen en Henegouwen PM, Boonstra J, Cremers FF, Humbel BM. Epidermal growth factor induces rapid and transient association of phospholipase C-gamma 1 with EGF-receptor and filamentous actin at membrane ruffles of A431 cells. J Cell Sci. 1995;108:2499–2509. doi: 10.1242/jcs.108.6.2499. [DOI] [PubMed] [Google Scholar]
- French AR, Tadaki DK, Niyogi SK, Lauffenburger DA. Intracellular trafficking of epidermal growth factor family ligands is directly influenced by the pH sensitivity of the receptor/ligand interaction. J Biol Chem. 1995;270:4334–4340. doi: 10.1074/jbc.270.9.4334. [DOI] [PubMed] [Google Scholar]
- Giugni TD, Braslau DL, Haigler HT. Electric field-induced redistribution and postfield relaxation of epidermal growth factor receptors on A431 cells. J Cell Biol. 1987;104:1291–1297. doi: 10.1083/jcb.104.5.1291. [DOI] [PMC free article] [PubMed] [Google Scholar]
- Gonzalez FA, Seth A, Raden DL, Bowman DS, Fay FS, Davis RJ. Serum-induced translocation of mitogen-activated protein kinase to the cell surface ruffling membrane and the nucleus. J Cell Biol. 1993;122:1089–1101. doi: 10.1083/jcb.122.5.1089. [DOI] [PMC free article] [PubMed] [Google Scholar]
- Inoue T, Cavanaugh PG, Steck PA, Brunner N, Nicolson GL. Differences in transferrin response and numbers of transferrin receptors in rat and human mammary carcinoma lines of different metastatic potentials. J Cell Physiol. 1993;156:212–217. doi: 10.1002/jcp.1041560128. [DOI] [PubMed] [Google Scholar]
- Janssens PM, Van Haastert PJ. Molecular basis of transmembrane signal transduction in Dictyostelium discoideum. Microbiol Rev. 1987;51:396–418. doi: 10.1128/mr.51.4.396-418.1987. [DOI] [PMC free article] [PubMed] [Google Scholar]
- Jones GE, Allen WE, Ridley AJ. The Rho GTPases in macrophage motility and chemotaxis. Cell Adhes Commun. 1998;6:237–245. doi: 10.3109/15419069809004479. [DOI] [PubMed] [Google Scholar]
- Kusumi A, Sako Y, Yamamoto M. Confined lateral diffusion of membrane receptors as studied by single particle tracking (nanovid microscopy): effects of calcium-induced differentiation in cultured epithelial cells. Biophys J. 1993;65:2021–2040. doi: 10.1016/S0006-3495(93)81253-0. [DOI] [PMC free article] [PubMed] [Google Scholar]
- Lawson MA, Maxfield FR. Ca(2+)- and calcineurin-dependent recycling of an integrin to the front of migrating neutrophils. Nature. 1995;377:75–79. doi: 10.1038/377075a0. [DOI] [PubMed] [Google Scholar]
- Lee J, Gustafsson M, Magnusson KE, Jacobson K. The direction of membrane lipid flow in locomoting polymorphonuclear leukocytes. Science. 1990;247:1229–1233. doi: 10.1126/science.2315695. [DOI] [PubMed] [Google Scholar]
- Lichtner RB, Kaufmann AM, Kittmann A, Rohde-Schulz B, Walter J, Williams L, Ullrich A, Schirrmacher V, Khazaie K. Ligand mediated activation of ectopic EGF receptor promotes matrix protein adhesion and lung colonization of rat mammary adenocarcinoma cells. Oncogene. 1995;10:1823–1832. [PubMed] [Google Scholar]
- Marsh M, McMahon HT. The structural era of endocytosis. Science. 1999;285:215–220. doi: 10.1126/science.285.5425.215. [DOI] [PubMed] [Google Scholar]
- Milne JL, Kim JY, Devreotes PN. Chemoattractant receptor signaling: G protein-dependent and -independent pathways. Adv Second Messenger Phosphoprotein Res. 1997;31:83–104. doi: 10.1016/s1040-7952(97)80011-0. [DOI] [PubMed] [Google Scholar]
- Neri A, Welch D, Kawaguchi T, Nicolson GL. Development and biologic properties of malignant cell sublines and clones of a spontaneously metastasizing rat mammary adenocarcinoma. J Natl Cancer Inst. 1982;68:507–517. [PubMed] [Google Scholar]
- Rijken PJ, Hage WJ, van Bergen en Henegouwen PM, Verkleij AJ, Boonstra J. Epidermal growth factor induces rapid reorganization of the actin microfilament system in human A431 cells. J Cell Sci. 1991;100:491–499. doi: 10.1242/jcs.100.3.491. [DOI] [PubMed] [Google Scholar]
- Segall JE, Tyerech S, Boselli L, Masseling S, Helft J, Chan A, Jones J, Condeelis J. EGF stimulates lamellipod extension in metastatic mammary adenocarcinoma cells by an actin-dependent mechanism. Clin Exp Metastasis. 1996;14:61–72. doi: 10.1007/BF00157687. [DOI] [PubMed] [Google Scholar]
- Servant G, Weiner OD, Neptune ER, Sedat JW, Bourne HR. Dynamics of a chemoattractant receptor in living neutrophils during chemotaxis. Mol Biol Cell. 1999;10:1163–1178. doi: 10.1091/mbc.10.4.1163. [DOI] [PMC free article] [PubMed] [Google Scholar]
- Sklar LA. Real-time spectroscopic analysis of ligand-receptor dynamics. Annu Rev Biophys Biophys Chem. 1987;16:479–506. doi: 10.1146/annurev.bb.16.060187.002403. [DOI] [PubMed] [Google Scholar]
- Swanson JA, Watts C. Macropinocytosis. Trends Cell Biol. 1995;5:424–428. doi: 10.1016/s0962-8924(00)89101-1. [DOI] [PubMed] [Google Scholar]
- Ware MF, Tice DA, Parsons SJ, Lauffenburger DA. Overexpression of cellular Src in fibroblasts enhances endocytic internalization of epidermal growth factor receptor. J Biol Chem. 1997;272:30185–30190. doi: 10.1074/jbc.272.48.30185. [DOI] [PubMed] [Google Scholar]
- Wyckoff JB, Insel L, Khazaie K, Lichtner RB, Condeelis JS, Segall JE. Suppression of ruffling by EGF in chemotactic cells. Exp Cell Res. 1998;242:100–109. doi: 10.1006/excr.1998.4093. [DOI] [PubMed] [Google Scholar]
- Xiao Z, Zhang N, Murphy DB, Devreotes PN. Dynamic distribution of chemoattractant receptors in living cells during chemotaxis and persistent stimulation. J Cell Biol. 1997;139:365–374. doi: 10.1083/jcb.139.2.365. [DOI] [PMC free article] [PubMed] [Google Scholar]
- Zhao M, Dick A, Forrester JV, McCaig CD. Electric field-directed cell motility involves upregulated expression and asymmetric redistribution of the epidermal growth factor receptors and is enhanced by fibronectin and laminin. Mol Biol Cell. 1999;10:1259–1276. doi: 10.1091/mbc.10.4.1259. [DOI] [PMC free article] [PubMed] [Google Scholar]
- Zigmond SH. Signal transduction and actin filament organization. Curr Opin Cell Biol. 1996;8:66–73. doi: 10.1016/s0955-0674(96)80050-0. [DOI] [PubMed] [Google Scholar]
Associated Data
This section collects any data citations, data availability statements, or supplementary materials included in this article.


