Abstract
The import of nucleus-encoded preproteins into plastids requires the coordinated activities of membrane protein complexes that facilitate the translocation of polypeptides across the envelope double membrane. Tic20 was identified previously as a component of the import machinery of the inner envelope membrane by covalent cross-linking studies with trapped preprotein import intermediates. To investigate the role of Tic20 in preprotein import, we altered the expression of the Arabidopsis Tic20 ortholog (atTic20) by antisense expression. Several antisense lines exhibited pronounced chloroplast defects exemplified by pale leaves, reduced accumulation of plastid proteins, and significant growth defects. The severity of the phenotypes correlated directly with the reduction in levels of atTic20 expression. In vitro import studies with plastids isolated from control and antisense plants indicated that the antisense plastids are defective specifically in protein translocation across the inner envelope membrane. These data suggest that Tic20 functions as a component of the protein-conducting channel at the inner envelope membrane.
INTRODUCTION
Nucleus-encoded preproteins are imported into chloroplasts via the cooperative action of multimeric complexes (translocons) in the outer and inner chloroplast envelope membranes, designated the Toc and Tic complexes, respectively (Schnell et al., 1997; Keegstra and Cline 1999; Bauer et al., 2001). Components of the Toc and Tic machinery associate physically to form a membrane supercomplex that facilitates the direct translocation of preproteins from the cytoplasm (Nielsen et al., 1997; Schnell et al., 1997; Kouranov et al., 1998) to the stroma. One function of the translocons is to maintain the critical permeability barrier of the organelle to ions and metabolites during the protein import reaction. Membrane translocation of preproteins is proposed to proceed through selectively permeable protein-conducting channels (van den Wijngaard and Vredenberg, 1997) formed by components of the Toc and Tic complexes.
Covalent cross-linking (Ma et al., 1996) and electrophysiological (Hinnah et al., 1997) studies suggest that Toc75, an integral outer membrane component, participates in protein conductance at the outer membrane. Toc75 is predicted to form a β-barrel structure in the outer membrane (Sveshnikova et al., 2000), providing a potential pore for the transport of unfolded preproteins. The nature of the protein-conducting channel of the Tic apparatus has not been defined. The activity of an inner membrane anion channel, PIRAC (protein import–related anion channel), is associated with protein import (van den Wijngaard and Vredenberg, 1997, 1999; van den Wijngaard et al., 1999, 2000), supporting the concept that protein translocation at the Tic machinery occurs through a regulated channel that opens in response to preproteins during import.
Tic20 is a 20-kD integral inner membrane protein containing four predicted α-helical transmembrane segments and short N- and C-terminal soluble domains (Kouranov et al., 1998). Tic20 was identified as a Tic component using covalent cross-linking studies with preproteins trapped at various stages during in vitro import in isolated pea chloroplasts (Ma et al., 1996; Kouranov and Schnell, 1997). Cross-linking to pea Tic20 (psTic20) was detected at an intermediate stage in import after the preproteins had inserted across the outer membrane and increased at later stages in import when the preproteins had inserted across the inner membrane translocon (Kouranov and Schnell, 1997). These results, coupled with the topology of psTic20, led us to propose that it constitutes part of the protein-conducting channel at the inner membrane. Interestingly, psTic20 and Tim17, a component of the protein-conducting channel of the mitochondrial inner membrane translocon, are distantly related to a class of prokaryotic branched-chain amino acid transporters (Rassow et al., 1999; Reumann et al., 1999). The similarities in size and primary sequence among this group of membrane proteins support the hypothesis that Tic20 participates in preprotein translocation.
psTic20 associates with two additional Tic components, psTic22 and psTic110. The function of psTic22 is unknown, but its localization to the intermembrane space and interactions with translocating preproteins suggest that it participates in coordinating the interaction of the Toc and Tic complexes during import (Kouranov et al., 1998). psTic110 associates with plastid ClpC (Akita et al., 1997; Nielsen et al., 1997) and Cpn60 (Kessler and Blobel, 1996) and is proposed to concentrate these two stromal chaperones at the site of protein import to facilitate membrane transport and subsequent folding of the import substrate. The three Tic components (Akita et al., 1997; Nielsen et al., 1997; Kouranov et al., 1998), along with a fourth component, psTic40 (Stahl et al., 1999), associate with the Toc complex to form a Toc-Tic supercomplex that corresponds to functional protein import sites across the double membrane envelope.
We have altered the expression levels of the Arabidopsis ortholog of psTic20, atTic20, in an effort to determine whether the activities of Tic20 correlate with a role in inner membrane translocation. The expression of an atTic20 antisense gene results in a reduction in atTic20 expression and pronounced pale phenotypes in transgenic Arabidopsis. Plastids from atTic20 antisense plants are defective in their ability to import preproteins, leading to pronounced defects in chloroplast biogenesis. These results support the identification of Tic20 as a Tic component and provide additional evidence for its role as a component of the protein-conducting channel of the inner membrane preprotein translocon.
RESULTS
Identification and Expression Pattern of the atTic20 Gene
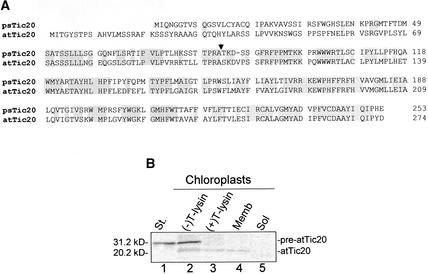
An examination of the available Arabidopsis genomic sequence data revealed the existence of a single gene, designated atTic20, exhibiting a high degree of identity to psTic20. The deduced amino acid sequences of the proteins from the two species exhibit 58% overall identity and 73% identity in the sequences corresponding to the mature polypeptides (Figure 1A). In contrast to the known psTic20 transit sequence of 83 amino acids, the atTic20 protein is predicted to contain an N-terminal transit sequence of 102 amino acids. The precursor form of atTic20 was targeted to isolated chloroplasts and processed to its predicted size, confirming it as a chloroplast protein (Figure 1B). Newly imported atTic20 was insensitive to protease digestion in intact chloroplasts and fractionated with the chloroplast membrane fraction (Figure 1B), consistent with its localization to the inner envelope membrane. On the basis of this high degree of identity, we designate atTic20 as the ortholog of psTic20.
Figure 1.
Comparison of atTic20 and psTic20.
(A) Alignment of psTic20 and atTic20. Identical residues are indicated by shaded boxes. The position of the transit sequence cleavage site of psTic20 is indicated by the arrowhead.
(B) Import of pre-atTic20 into isolated chloroplasts. In vitro–translated 35S-pre-atTic20 was incubated in a standard protein import reaction with chloroplasts (25 μg of chlorophyll) for 30 min at 26°C. After the import reaction, the chloroplasts were treated for 30 min on ice in the presence (+) or absence (−) of 100 μg/mL thermolysin (T-lysin). Thermolysin-treated chloroplasts were lysed and fractionated into membrane (Memb) and soluble (Sol) components. All samples were analyzed by SDS-PAGE on 15% (w/v) acrylamide gels and phosphorimaging. 35S-pre-atTic20 was imported into chloroplasts and processed to its mature form. The measured sizes of pre-atTic20 (31.2 kD) and mature atTic20 (20.2 kD) are indicated at left. Lane 1 (St.) contains 10% of the 35S-pre-atTic20 translation product added to each reaction.
Previous studies have shown that the activities and levels of the protein import apparatus correlate with plastid development, peaking during periods of rapid growth and plastid proliferation (Dahlin and Cline, 1991; Jarvis et al., 1998). As a central component of the plastid protein import apparatus, the expression of atTic20 is expected to follow a similar profile. As a first step in the in vivo analysis of atTic20, we examined the developmental and tissue-specific expression profiles of the atTic20 gene. Wild-type Arabidopsis (Wassilewskija) plants were grown under short day conditions (8 hr of light and 16 hr of dark). Total RNA was extracted at different ages between 5 and 60 days after germination from the aboveground portion of the plants, and the relative abundance of atTic20 mRNA was determined by quantitative comparative reverse transcriptase–mediated polymerase chain reaction (RT-PCR) using 18S rRNA as an internal control. The ratio of the amount of the atTic20 RT-PCR product to the 18S rRNA RT-PCR product was used as an arbitrary measurement unit. The 5′ sense primer for amplifying atTic20 cDNA spans the splice site of two exons of the atTic20 gene that are separated by a 247-bp intron, thereby preventing the amplification of any genomic DNA that might contaminate the RNA preparations accidentally.
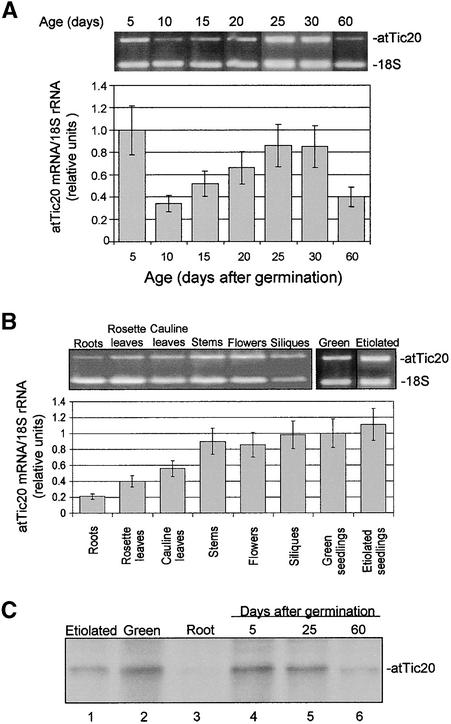
As shown in Figure 2A, the atTic20 mRNA levels were high at 5 days after germination, when cotyledons were expanding, and decreased to a lower level at 10 days, when the cotyledons stopped expanding and the primary leaves began to develop. The expression of atTic20 increased as the primary leaves expanded and additional rosette leaves developed, with levels peaking at 25 days. The atTic20 mRNA levels declined after 30 days as the plants matured and began to bolt. These results clearly indicate that the expression of atTic20 mRNA correlates with developmental stages involving cell growth and increases in chloroplast size and numbers.
Figure 2.
Expression Pattern of atTic20.
(A) Temporal expression pattern of atTic20 mRNA. Total RNA was extracted from wild-type Arabidopsis plants at the ages indicated. The relative atTic20 mRNA levels were determined by comparative RT-PCR using 18S rRNA as the control (see Methods). The levels of atTic20 mRNA are expressed as the ratio of the ethidium bromide stain intensity of the atTic20 and 18S rRNA PCR products. atTic20 expression was highest during periods of rapid growth and declined as plants matured.
(B) Tissue distribution of atTic20 mRNA expression. Total RNA was extracted from the indicated tissues of 40-day-old light-grown or 5-day-old etiolated plants. The relative atTic20 mRNA level in each tissue was determined by comparative RT-PCR as described in (A). atTic20 mRNA was detected at varying levels in all tissues examined.
(C) Distribution of the atTic20 protein. Total membrane fractions (75 μg of protein each) from etiolated, green, and root tissues or green tissue harvested at the times indicated were resolved by SDS-PAGE, transferred to nitrocellulose, and immunoblotted with anti-atTic20 IgG. atTic20 protein was detected in all tissues examined, with the highest levels found in young green tissues. Error bars in (A) and (B) indicate ±sd.
To obtain the tissue-specific expression profile of atTic20, the mRNA levels in roots, rosette leaves, cauline leaves, stems, flowers, and siliques of mature plants as well as green and etiolated seedlings were examined. atTic20 was expressed in all tissues examined, although the relative levels varied among different tissues (Figure 2B). The levels of atTic20 were highest in rapidly growing tissues, such as stems, developing flowers, and siliques. Furthermore, atTic20 mRNA was found at equivalent levels in both etiolated and light-grown seedlings, suggesting a role of the protein in early chloroplast development.
To confirm that atTic20 levels correlate with atTic20 protein levels, we immunoblotted extracts from different ages and several tissues of Arabidopsis seedlings with an antibody to an N-terminal peptide derived from atTic20. Figure 2C demonstrates that atTic20 was present in all tissues and ages examined. The levels of atTic20 ranged from their highest levels in green tissues, to moderate levels in etiolated plants, to their lowest levels in roots. atTic20 was most abundant in the early stages of plant development (5 and 25 days after germination), with lower levels apparent in mature plants (60 days after germination). These data correlate with the mRNA levels detected by RT-PCR and reflect the relative levels of plastid development in these tissues. These results indicate that atTic20 is expressed throughout the plant and is not restricted to photosynthetic tissues, consistent with its proposed role as a general component of the import machinery.
Generation and Phenotypic Analysis of atTic20 Antisense Plants
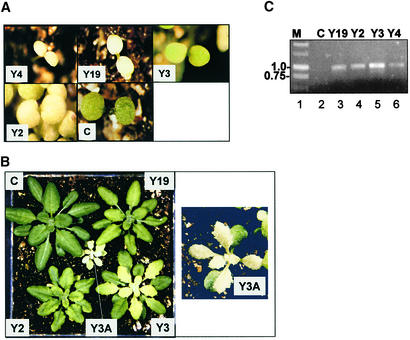
The atTic20 cDNA coding region (825 bp) was cloned into a binary vector, pCAMBIA3300-1, in the antisense orientation with respect to the 35S promoter of cauliflower mosaic virus. Transformation by floral dipping of wild-type Arabidopsis with this construct renders the transformants resistant to the herbicide BASTA (phosphinothricin). Several hundred BASTA-resistant plants were obtained from the T1 generation. Approximately 40% of the BASTA-resistant plants appeared indistinguishable from the control plants transformed with the vector alone (data not shown). Thirty percent of the T1 transformants possessed pale cotyledons but recovered fully and were indistinguishable from control plants at later stages of development (data not shown). Another 10% of the BASTA-resistant T1 transformants exhibited severe pale phenotypes (Figure 3A, Y4). These plants lacked any apparent chlorophyll and failed to survive on soil or Suc-supplemented agar plates beyond the cotyledon stage of development (data not shown). The inviability of these plants likely is attributable to a severe reduction in atTic20 expression, suggesting that atTic20 is required for viability.
Figure 3.
Phenotypes of atTic20 Antisense Plants.
(A) Comparison of 5-day-old control (C), Y2, Y3, Y4, and Y19 antisense lines grown on soil. The Y4 and Y19 lines exhibit marked pale phenotypes at early stages of plant development, whereas the Y3 and Y2 lines are only slightly pale.
(B) Comparison of 40-day-old control (C), Y2, Y3, and Y19 antisense lines grown on soil. A 40-day-old Y3 plant homozygous for the atTic20 antisense gene (Y3A) is shown in the center of the left panel and shown enlarged 2.5 times at right. The true leaves of Y2, Y3, and Y19 antisense plants exhibit a variety of pale phenotypes and moderate growth defects. Y3 homozygous plants (Y3A) exhibit a severe pale phenotype and growth defect.
(C) Confirmation of antisense gene incorporation into the genome of lines exhibiting antisense phenotypes. Genomic DNA from the indicated antisense (Y19, Y2, Y3, andY4) and control (C) plants was extracted and subjected to PCR using primers p3300s and p3300a that are specific for regions of the pCAMBIA3300-1 vector flanking the atTic20 antisense gene. Lane 1 contains DNA molecular mass markers (M). The 1.0- and 0.75-kb markers are indicated at left.
The remaining T1 transformants exhibited a variety of pale phenotypes throughout development. Seedlings of three viable lines that represent the spectrum of pale phenotypes are shown in Figure 3A. Approximately 15% of the T1 plants, represented by lines Y2 and Y19, exhibited very pale cotyledons. These lines were viable on soil, but the green tissues remained notably pale throughout the life cycle of the plants (Figure 3B, Y2 and Y19). The phenotypes of these two lines remained stable in three subsequent generations that have been examined.
Another 5% of the T1 seedlings exhibited mildly pale phenotypes in their cotyledons (Figure 3A, Y3), but their developing leaves and stems were significantly pale (Figure 3B, Y3). These seedlings were viable but retained a pale phenotype throughout development. The Y3 line represents this population. Interestingly, plants from the T2 generation of the Y3 line exhibited a Mendelian 1:2:1 segregation of pale phenotypes. Twenty-five percent of the plants exhibited a phenotype indistinguishable from wild-type plants and were BASTA sensitive. Fifty percent of the plants exhibited a significantly pale phenotype similar to the T1 plants. The remaining 25% exhibited a much more severe pale phenotype (Figure 3B, Y3A). We designate these plants Y3A. In addition to a nearly albino pigmentation, the true leaves of the Y3A plants had exaggerated serrated edges. One hundred percent of the progeny of the Y3A plants exhibited the severe phenotype in the three subsequent generations that have been examined. The phenotypic segregation profile of the Y3 line is explained most easily if the T1 generation was hemizygous for a single antisense gene insertion and the Y3A plants corresponded to plants homozygous for the insertion. The increase in the severity of the pale phenotype in Y3A could be explained by increased antisense expression from the additional antisense gene. DNA gel blot analysis of the plants from the Y3 line supported the existence of a single antisense gene insertion in these plants (data not shown).
The incorporation of the antisense atTic20 construct into the genome of the four antisense lines presented in Figure 3A was confirmed by PCR amplification of total genomic DNA using a primer pair corresponding to the pCAMBIA3300-1 sequences adjacent to the antisense Tic20 cDNA cloning site. As shown in Figure 3C, genomic DNA from all four BASTA-resistant lines yielded the expected ∼900-bp PCR product, whereas the control sample failed to give an amplification product.
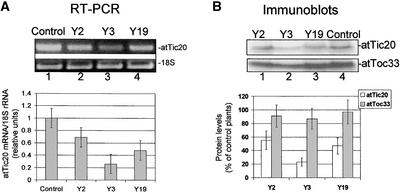
For the purpose of analyzing the antisense phenotypes, we focused our studies on the three viable lines that exhibited the most pronounced pale phenotypes (Y2, Y3, and Y19). To test whether the phenotypes of the antisense lines result from a decrease in atTic20 expression, we determined the levels of atTic20 mRNA and protein in these plants. Plants at 30 days after germination were chosen for analysis because the highest levels of atTic20 mRNA are detected in true leaves of control plants at this stage of development (Figure 2A). Figure 4 shows that atTic20 mRNA levels were reduced markedly in the three antisense lines. The levels of atTic20 mRNA were lowest in the Y3 line, representing ∼25% of control levels, whereas atTic20 mRNA levels in the Y2 and Y19 lines were reduced to 65 and 50% of control levels, respectively (Figure 4A). Immunoblots of extracts from control and antisense lines with anti-atTic20 IgG confirmed that the levels of atTic20 in chloroplast envelopes were reduced in all three antisense lines, with the lowest levels observed in Y3 plants (Figure 4B). The level of atToc33, a component of the outer envelope translocon, was not altered significantly in the antisense lines (Figure 4B), suggesting that antisense expression selectively alters atTic20 levels. Thus, the reduced levels of atTic20 correlate directly with the severity of the pale phenotypes in the antisense lines, supporting the link between atTic20 expression and plastid biogenesis.
Figure 4.
Suppression of atTic20 mRNA and Protein Expression in Antisense Arabidopsis Plants.
(A) atTic20 mRNA levels in antisense plants. Total RNA was extracted from the leaves of 30-day-old control or antisense (Y2, Y3, and Y19) plants. The relative amount of atTic20 mRNA in each RNA sample was determined by comparative RT-PCR using 18S rRNA as the internal control. The graph at bottom represents the average of four experiments. The gel at top shows an ethidium bromide–stained agarose gel from one representative experiment. The levels of atTic20 mRNA were reduced significantly in all three antisense lines.
(B) atTic20 protein levels in antisense plants. Immunoblots of chloroplast envelope membranes (25 μg of protein each) from control and antisense (Y2, Y3, and Y19) plants with anti-atTic20 and anti-atToc33 IgGs. The levels of atTic20 and atToc33 in antisense samples are expressed as a percentage of the levels measured in samples from control plants. The gel at top shows one representative immunoblot of four used for the quantitative analysis. The immunoblots confirm that atTic20 expression is reduced in all three antisense lines, whereas atToc33 is not affected significantly. Error bars indicate ±sd.
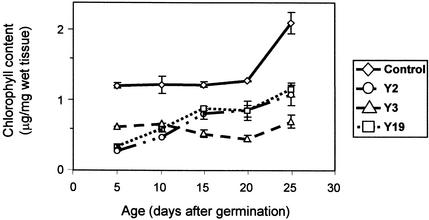
To quantitatively measure the pale phenotype of the mutant lines, the chlorophyll content of the aboveground portion of control and antisense plants grown under short-day conditions was determined at 5-day intervals. The chlorophyll content of control plants did not change dramatically during the first 20 days of development but increased dramatically between 20 and 25 days (Figure 5). The chlorophyll content of the antisense lines was consistently lower than that of control plants (Figure 5). The chlorophyll content of the Y2 and Y19 lines began at very low levels, consistent with their pale phenotypes at the early seedling stage. Although these levels increased with development, both lines reached a maximum chlorophyll content equivalent to one-half that of control plants at 30 days. In contrast, the Y3 line remained pale at all stages of development, with no appreciable increase in chlorophyll content upon maturity. The chlorophyll content of Y3 plants was less than 25% of the levels of control plants at 25 days (Figure 5).
Figure 5.
Comparison of Chlorophyll Content in Antisense and Control Plants.
Chlorophyll was extracted from the aboveground portions of control and antisense atTic20 (Y2, Y3, and Y19) plants at 5-day intervals with 80% acetone. Chlorophyll content was quantified by absorption at 652 nm by the method of Arnon (1949). Each data point represents the mean of four or more measurements. The chlorophyll content of all three antisense lines was reduced throughout development, consistent with their pale phenotypes. Error bars indicate ±sd.
All three lines exhibited measurable growth defects. The wet weights of 40-day-old Y2, Y19, and Y3 lines averaged 50, 30, and 55% less, respectively, than control plants (Figure 3B). The Y3A plants averaged 85% lower wet weights compared with control plants (Figure 3B). Growth of the Y2, Y3, Y3A, and Y19 lines on agar plates supplemented with Suc did not alter the visible phenotypes or growth characteristics of the plants (data not shown). Therefore, the pale phenotypes were not simply the result of a photosynthetic defect but likely were caused by a general defect in plastid function.
Chloroplast Content and Morphology in Antisense Plants
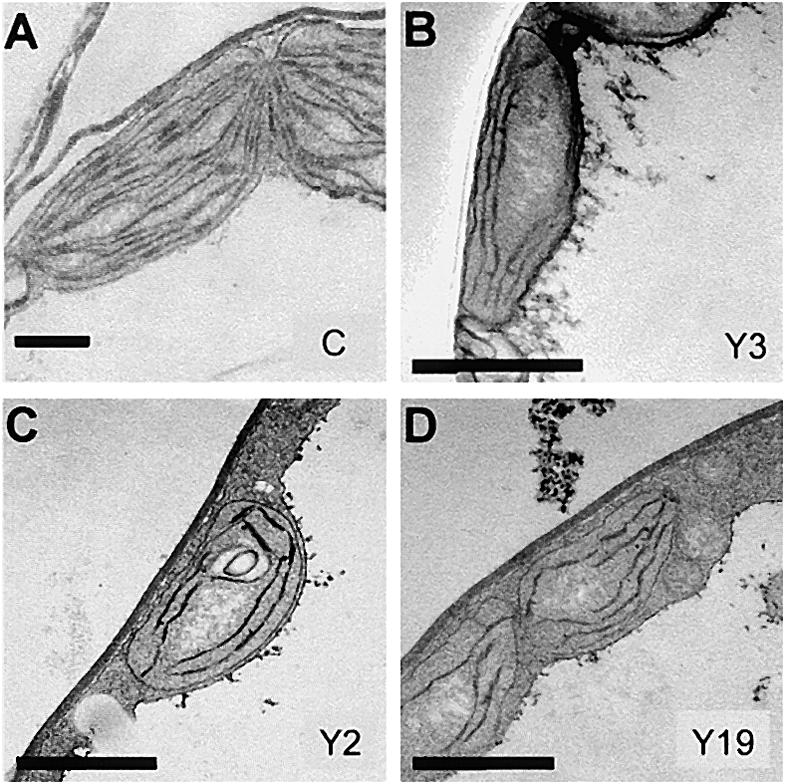
To assess the effects of atTic20 levels on chloroplast biogenesis directly, we examined the morphology of chloroplasts from the primary leaves of 10-day-old antisense plants by electron microscopy. The chloroplasts from the antisense plants exhibited marked alterations in thylakoid membrane abundance and organization (Figure 6). The amount of thylakoid membrane in chloroplasts from all three lines was reduced significantly. Furthermore, fewer grana were observed in the chloroplasts from the antisense plants (Figures 6B to 6D) compared with the extensive, orderly stacked network of control thylakoids (Figure 6A). Examination of multiple sections indicated that plastids from the antisense plants generally were smaller than control plastids. However, the number of chloroplasts per cell did not appear to be altered significantly. These results confirm that atTic20 is required for chloroplast development and maintenance and that reduction in atTic20 levels causes defects in plastid development.
Figure 6.
Ultrastructure of Chloroplasts from atTic20 Antisense Plants.
Control (A), Y3 (B), Y2 (C), and Y19 (D) antisense plants were grown on agar plates containing 1% Suc. Electron microscopic samples were prepared from the pale leaves of antisense plants and the corresponding green leaves of control plants of the same age. The antisense lines exhibited a decrease in thylakoid membrane development consistent with their pale phenotypes. Bars = 400 nm.
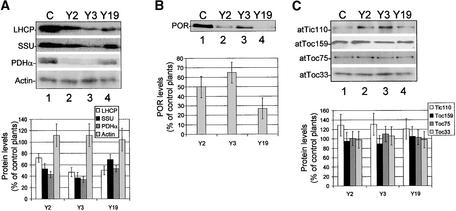
Both the pale phenotype and the abnormal chloroplast ultrastructure of antisense plants were in agreement with a defect in protein import across the chloroplast envelope. To explore this possibility, we examined the abundance of nucleus-encoded chloroplast proteins in antisense and control plants by comparative immunoblotting. We examined the levels of two major nucleus-encoded chloroplast proteins in the antisense lines, the major light-harvesting complex protein (LHCP) and the small subunit of ribulose-1,5-bisphosphate carboxylase/oxygenase (SSU). Both proteins were strongly light induced and expressed predominantly in chloroplasts. In addition, we examined the levels of the α-subunit of the E1 subunit of pyruvate dehydrogenase (PDHα), an enzyme expressed constitutively in all plastid types (Johnston et al., 1997). All three lines showed marked decreases in the accumulation of LHCP, SSU, and PDHα (Figure 7A). The levels of all plastid proteins were lowest in the Y3 line, consistent with its pronounced phenotype. All three proteins were detected as their mature forms, indicating that they have been imported into chloroplasts (Figure 7A). In no case did we observe the accumulation of precursor forms of any of the three proteins. The levels of actin were not altered in the antisense lines, indicating a specific reduction in plastid-specific proteins (Figure 7A). These data suggest that reduced levels of atTic20 result in the inefficient import and accumulation of plastid preproteins, resulting in growth defects, underdeveloped thylakoid membranes, and reduced photosynthetic capacity.
Figure 7.
Accumulation of Nucleus-Encoded Plastid Proteins in Antisense Plants.
Protein was extracted directly from total aboveground tissue of antisense and control (C) seedlings by boiling in SDS-PAGE sample buffer. Samples were resolved by SDS-PAGE, transferred to nitrocellulose membranes, and immunoblotted with antisera to the proteins indicated at left. The levels of the indicated proteins in antisense samples are expressed as a percentage of the levels of the corresponding protein measured in samples from control plants. The top section in each panel shows one representative immunoblot of the four used for the quantitative analysis.
(A) Immunoblots of extracts (10 μg of protein) from 30-day-old light-grown seedlings. The levels of three plastid proteins, LHCP, SSU, and PDHα, were reduced in the antisense plants. The levels of the cytoplasmic marker, actin, were not reduced in the antisense lines.
(B) Immunoblot of extracts (25 μg of protein) from 5-day-old etiolated seedlings with anti-POR serum. The accumulation of the major etioplast protein POR was reduced in atTic20 antisense plants.
(C) Immunoblots of extracts (25 μg of protein) from 30-day-old light-grown seedlings with anti-atTic110, anti-atToc159, anti-atToc75, and anti-atToc33 sera. The levels of other Toc and Tic components were not reduced by atTic20 antisense expression. Error bars indicate ±sd.
We also examined the abundance of protochlorophyllide oxidoreductase (POR) in 5-day-old etiolated seedlings. POR is the major nucleus-encoded plastid protein in etioplasts of dark-grown plants (Griffiths, 1978). The abundance of POR was reduced in all three antisense lines compared with control plants (Figure 7B). Thus, a decrease in atTic20 expression appears to have a general effect on the accumulation of plastid proteins at all developmental stages.
In contrast to the levels of chloroplast proteins in mature plants (Figure 7A), the levels of POR were lowest in the Y2 and Y19 lines, whereas Y3 plants had a more modest reduction in POR accumulation. These data suggest a differential expression of the antisense transgenes during development. Consistent with this proposal, we measured the levels of atTic20 mRNA by comparative RT-PCR and found that they were higher in etiolated Y3 plants than in etiolated Y2 and Y19 plants (data not shown). These data are consistent with the more pronounced phenotype of the Y2 and Y19 lines at early stages of plant development compared with the Y3 line (Figure 3A).
We examined the levels of atTic110, atToc75, atToc33, and atToc159 in each antisense line to determine whether the effects on plastid protein accumulation were specific for decreases in atTic20 or were caused by a secondary effect on the accumulation of other components of the import apparatus. atTic110 (Lubeck et al., 1996) and atToc75 (Tranel and Keegstra, 1996) contain transit peptides and appear to involve components of the Toc/Tic system for their import, whereas atToc33 (Chen and Schnell, 1997) and atToc159 (Muckel and Soll, 1996) insert into the outer membrane independent of a transit sequence. All three Toc components were detected in antisense plants at nearly the same levels as in control plants (Figure 7C), indicating that the outer membrane translocon is intact. The levels of atTic110 were increased slightly compared with control plants in all three antisense lines. These data indicate that the defect in the accumulation of nucleus-encoded proteins in the antisense plants is attributable directly to reduced levels of atTic20 and not to indirect effects on the biogenesis of other components of the import apparatus.
Chloroplast Protein Import into Antisense Plastids
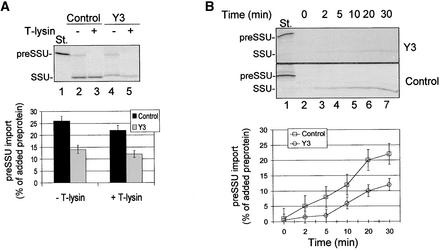
To obtain direct evidence that the reduction in atTic20 expression affects chloroplast protein import, we determined the ability of plastids isolated from antisense plants to import preproteins. We focused our studies on the Y3 line because it exhibits the most consistent and severe phenotype. As a first step, we investigated the import of the precursor to SSU (preSSU). Chloroplasts isolated from 2- to 4-week-old control or antisense Y3 plants were incubated with 35S-preSSU in a standard import reaction. preSSU associated with chloroplasts and was processed to a protease-insensitive mature form in both control and Y3 plants (Figure 8A), indicating the import of the preprotein. Although both control and Y3 chloroplasts imported preSSU, the import efficiency of Y3 plastids was reduced to ∼50% of the levels observed in control chloroplasts (Figure 8A). Analysis of the kinetics of import indicates that the low import capacity was attributable to a reduction in import rate (Figure 8B). Thus, the defect in chloroplast biogenesis observed in the antisense plants correlates with a defect in the rate of protein import, supporting the direct role of atTic20 in the import reaction.
Figure 8.
Import of preSSU into Isolated Chloroplasts of Antisense Plants.
Chloroplasts were prepared from 2- to 4-week-old control or Y3 seedlings grown on agar plates containing 1% Suc.
(A) Import of preSSU in control and antisense plants. In vitro–translated 35S-preSSU was incubated with chloroplasts (50 μg of chlorophyll) from control or Y3 antisense plants in a standard protein import reaction for 30 min. The samples were divided in half and treated with 100 μg/mL thermolysin (+ T-lysin) or buffer (− T-lysin) on ice for 30 min. The chloroplasts were reisolated through 40% Percoll silica gel and analyzed directly by SDS-PAGE and phosphorimaging. One-tenth of the 35S-preSSU in vitro translation product (St.) added to each reaction is shown in lane 1. The level of preSSU import was reduced in Y3 antisense chloroplasts.
(B) Time course of 35S-preSSU import into isolated chloroplasts from control or Y3 antisense plants. Import was performed as in (A). Samples corresponding to 25 μg of chlorophyll were collected at the times indicated, treated with 100 μg/mL thermolysin on ice for 30 min, reisolated through 40% Percoll silica gel, and analyzed directly by SDS-PAGE and phosphorimaging. One-tenth of the 35S-preSSU in vitro translation product (St.) added to each reaction is shown in lane 1. The positions of precursor (preSSU) and mature (SSU) proteins are indicated at left. The chloroplasts from Y3 antisense plants exhibited a slower rate of preSSU import than control plants.
The gel at the top of each panel shows one representative fluorograph of the four used for the quantitative analysis. Error bars indicate ±sd.
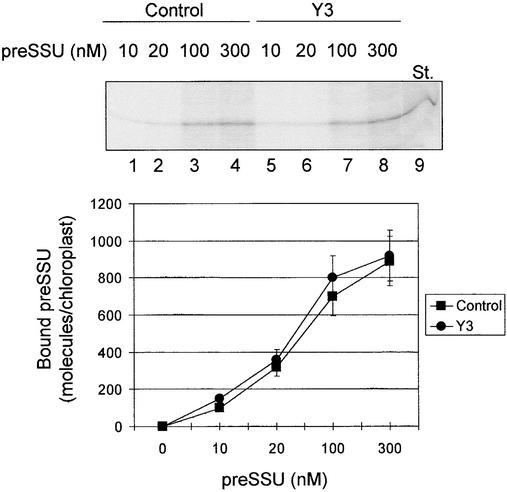
We have proposed that Tic20 functions as a component of the protein-conducting channel in the inner membrane. Therefore, we determined whether or not preprotein translocation at the inner membrane was affected specifically in the Y3 chloroplasts. First, we tested the ability of Y3 chloroplasts to translocate preproteins at the outer membrane. The incubation of isolated chloroplasts with preproteins in the presence of 0.1 mM ATP results in the formation of an early import intermediate that has inserted across the outer but not the inner membrane (Schnell and Blobel, 1993; Young et al., 1999). We used these conditions as a quantitative measure of protein translocation through the Toc complex. Figure 9 shows that the levels of the early import intermediate were indistinguishable in Y3 and control chloroplasts. These results indicate that preprotein binding to and insertion into the outer membrane translocon is not affected in the atTic20-deficient chloroplasts.
Figure 9.
Titration of the Formation of a preSSU Early Import Intermediate in Chloroplasts from Antisense Plants.
Chloroplasts were prepared from 2- to 4-week-old control or Y3 seedlings grown on agar plates containing 1% Suc. Isolated chloroplasts were depleted of endogenous ATP by incubating at 26°C in the dark for 10 min. Energy-depleted chloroplasts (50 μg of chlorophyll) were incubated with 0.1 mM ATP and varying concentrations of 35S-preSSU as indicated at 26°C in the dark for 10 min. The chloroplasts were reisolated through 40% Percoll silica gel and analyzed directly by SDS-PAGE and phosphorimaging. Ten picomoles of 35S-preSSU is shown in lane 9 (St.). The gel at top shows one representative fluorograph of the four used for the quantitative analysis. The association of preSSU with the Toc complex was not altered in the Y3 antisense plants. Error bars indicate ±sd.
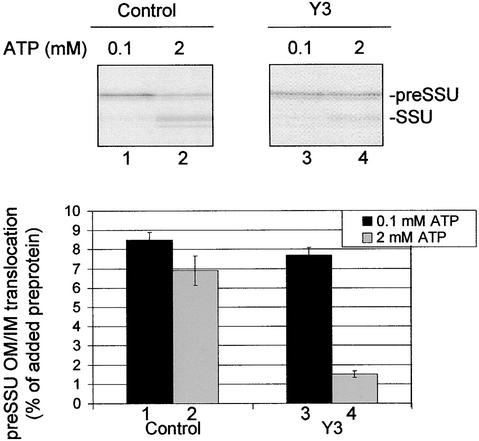
Second, we tested the ability of the Y3 chloroplasts to import the early intermediate across the inner membrane. Chloroplasts from control and Y3 plants were incubated with 35S-preSSU under conditions that lead to the formation of the early import intermediate (Figure 10, lanes 1 and 3). Once again, the levels of the early import intermediate were indistinguishable in control and Y3 chloroplasts. The chloroplasts were reisolated and suspended in import buffer containing 2 mM ATP to promote translocation across the inner membrane (Figure 10, lanes 2 and 4). Under these conditions, control chloroplasts imported ∼81% of the early intermediate into the stroma, where it was processed to its mature form (Figure 10, cf. lanes 1 and 2). In contrast, Y3 plastids imported ∼20% of the early import intermediate over the same period (Figure 10, cf. lanes 3 and 4). Thus, the Y3 chloroplasts are selectively defective in preprotein translocation across the inner membrane. These data are consistent with the hypothesis that atTic20 functions as a component of the protein-conducting channel in the inner membrane translocon.
Figure 10.
Translocation of preSSU across the Inner Envelope Membrane of Chloroplasts from Antisense Plants.
Chloroplasts were prepared from 2- to 4-week-old control or Y3 seedlings grown on agar plates containing 1% Suc. Isolated chloroplasts were depleted of endogenous ATP by incubating at 26°C in the dark for 10 min. The chloroplasts were incubated with 0.1 mM ATP and 200 nM 35S-preSSU at 26°C in the dark for 10 min. The chloroplasts were reisolated through 40% Percoll silica gel, resuspended in buffer containing 2 mM ATP, and incubated for 15 min at 26°C in the light. The chloroplasts were collected by centrifugation and analyzed directly by SDS-PAGE and phosphorimaging. The positions of precursor (preSSU) and mature (SSU) proteins are indicated at right. The amount of 35S-preSSU bound to chloroplasts during the first incubation in the presence of 0.1 mM ATP is shown by the black bars. The amount of mature 35S-SSU associated with chloroplasts after the subsequent incubation in the presence of 2 mM ATP is shown by the gray bars. The gels at top show representative fluorographs of the four used for the quantitative analysis. The import of preSSU into chloroplasts of Y3 antisense plants was inhibited selectively at the stage of translocation across the inner envelope membrane. IM, inner membrane; OM, outer membrane. Error bars indicate ±sd.
DISCUSSION
We obtained multiple lines of transgenic plants that have significantly lower expression levels of atTic20 by expressing an antisense atTic20 gene in Arabidopsis. The atTic20 antisense plants exhibited a variety of defects, including pale to nearly albino leaves, retarded growth (Figure 3), abnormal plastid ultrastructure (Figure 6), and reduced accumulation of nucleus-encoded plastid proteins (Figure 7). Plastids from the most severely affected antisense line, Y3, exhibited a specific defect in preprotein translocation across the inner envelope membrane (Figure 10). Together, these phenotypes strongly suggest that Tic20 plays a central role in preprotein import into plastids by participating in translocation across the inner membrane.
A variety of different pale phenotypes were observed among the atTic20 antisense plants (Figure 3). The variation in the developmental onset of the pale phenotypes in the antisense lines likely is the result of variation in the cell- or tissue-specific profile of antisense expression as a result of the position of the T-DNA insertions in the genome. Such variation is well documented for other antisense approaches (Gutensohn et al., 2000; Kumar and Soll, 2000). Nevertheless, the pale phenotypes in all of the antisense lines are most pronounced in rapidly growing tissues (Figure 3). The expression of two additional import components, atToc33 and atToc75, has been shown previously to correlate with rapid growth and development in green tissues (Jarvis et al., 1998; Gutensohn et al., 2000). The demand for protein import is highest in these tissues because of the rapid development and increased division of chloroplasts. The levels of these import components decrease as leaves mature, and demand for protein import primarily is for organelle maintenance. We observed a similar expression profile for atTic20 (Figure 2). Therefore, the correlation between rapid growth and the pale phenotype in the atTic20 antisense plants is consistent with the role of atTic20 in protein import.
The phenotypes of the atTic20 antisense plants are similar to the phenotypes of previously characterized Arabidopsis mutants of plastid import components. Arabidopsis lines lacking the major Toc34-like protein, atToc33, or expressing an antisense atToc33 gene exhibit a marked pale phenotype early in development but recover to develop fully in a manner similar to the Y2 and Y19 antisense atTic20 lines (Jarvis et al., 1998; Gutensohn et al., 2000). They also show abnormal chloroplast morphology, including a reduction in thylakoid membrane development, accumulation of nucleus-encoded chloroplast proteins, and overall plastid size. A mutant lacking atToc159, ppi2, exhibits a severe albino phenotype and is not viable on soil (Bauer et al., 2000a). The plastids from the ppi2 mutant contain significantly less LHCP, SSU, and other nucleus-encoded plastid proteins. This phenotype is similar to the extremely pale phenotype exhibited by the atTic20 antisense plants that fail to develop beyond the cotyledon stage (Figure 3A, Y4). Antisense tobacco plants with reduced levels of the stromal processing protease also exhibit dramatic growth defects, a chlorotic phenotype, and reduced thylakoids (Wan et al., 1998).
The import defect exhibited by the atTic20 antisense plants appears to affect the accumulation of an array of nucleus-encoded plastid proteins (Figure 7). In addition to reduced levels of chloroplast-specific proteins such as SSU and LHCP, the antisense lines contained reduced levels of POR, a protein expressed predominantly in etioplasts, and PDHα, an enzyme expressed constitutively in all plastid types. These data, in conjunction with the observation that growth on Suc did not alter the antisense phenotypes, indicate that atTic20 is a general component of the Tic apparatus that is required for the import of proteins in all plastid types. This is in contrast to atToc33 and atToc159, which appear to be involved specifically in chloroplast development (Jarvis et al., 1998; Bauer et al., 2000a). The atTic159 null mutant, ppi2, is not viable on soil but survives if the photosynthetic defect is bypassed by supplementing the plants with Suc (Bauer et al., 2000a; Yu and Li, 2001). The two Toc proteins are encoded by small gene families that are expressed differentially during development (Jackson-Constan and Keegstra, 2001). atTic20 is expressed in all tissues examined and is likely to be required at all developmental stages.
There are conflicting reports in the literature using in vitro import assays regarding whether or not prePORA is imported into chloroplasts by the general Toc-Tic machinery (Aronsson et al., 2000; Reinbothe et al., 2000). Although our data do not exclude the possibility that some stage of POR import may involve components other than the known Toc and Tic proteins, it is clear that atTic20 participates in POR accumulation in vivo. Therefore, translocation of PORA across the inner envelope membrane is likely to involve at least this component of the Tic translocon.
In vitro protein import assays using isolated chloroplasts from the Y3 line provided direct evidence that atTic20 is a core component of the Tic translocon. The import kinetics of preSSU in Y3 plastids were significantly slower than control chloroplasts (Figure 8). Translocation of preSSU across the outer envelope membrane did not appear to be affected because the formation of a preSSU early import intermediate that is trapped in transit through the Toc complex is comparable in both Y3 and control plastids (Figure 9). This is con-sistent with the observation that Toc components were expressed at normal levels in antisense plants. In contrast, the efficiency of translocation of the early intermediate across the inner envelope was reduced approximately twofold to threefold over control levels (Figure 10). These data provide direct evidence for the participation of atTic20 in preprotein translocation across the inner membrane. Previous studies have demonstrated that psTic20 cross-links to trapped import intermediates that are inserted partially across the inner membrane (Kouranov and Schnell, 1997). These data, in conjunction with the data from the analysis of the antisense plants, support the hypothesis that atTic20 is a component of the protein-conducting channel of the Tic apparatus.
The levels of other Toc and Tic components examined were not reduced in the antisense lines, although at least one of these components, atTic110, is proposed to use the general import pathway (Stahl et al., 1999). In ppi2, an atToc159 null mutant, the levels of the import components examined, including atTic110, were normal (Bauer et al., 2000a). In that case, the authors proposed that the import of the Toc/Tic components uses a different preprotein receptor (i.e., atToc132 or atToc120) and thus a different Toc translocon. Here, we extend this hypothesis and speculate that the import of atTic110 relies not only on a distinct Toc translocon but also on a distinct Tic translocon. In fact, the mitochondrial inner membrane translocon components Tim17, Tim23, and Tim44 and some other inner membrane proteins are imported by a distinct Tim complex (Bauer et al., 2000b). The unique Tim complex contains Tim22, a protein structurally related to Tim23 and Tim17. A similar system might exist in chloroplasts. Indeed, in addition to the atTic20 gene, two Arabidopsis genes encoding proteins with some similarity to atTic20 exist (Jackson-Constan and Keegstra, 2001). These two genes might represent distinct Tic complexes that could account for the import of specific classes of plastid proteins. The atTic20 antisense lines provide an experimental system in which to examine the diversity of translocation pathways across the inner envelope membrane.
One unexpected result is that the abundance of atTic110 was increased slightly in the antisense plants (Figure 7). The increased levels of atTic110 may reflect an attempt by the plants to compensate for a defective inner membrane translocon by increasing the expression of the Tic components. It will be of interest to examine the levels of atTic22 and other Tic components when reagents become available to determine if their targeting or expression is affected in the atTic20-deficient lines.
METHODS
Plant Material and Growth Conditions
All experiments were performed with Arabidopsis thaliana ecotype Wassilewskija. Plants were grown at 21.5°C with 8 hr (short-day condition) or 16 hr (long-day condition) of daylight as indicated in the text. For growth on agar plates, seed were surface-sterilized and sown on 0.9% agar containing 0.5 times concentrated Murashige and Skoog (1962) medium, 1% (w/v) Suc, and/or 50 μg/mL BASTA (phosphinothricin; Sigma Chemical, St. Louis, MO).
Construction of pCAMBIA3300-1/Antisense atTic20
The atTic20 expressed sequence tag clone F1H7T7 was obtained from the Arabidopsis Biological Research Center (Columbus, OH). The region corresponding to the atTic20 open reading frame was amplified from F1H7T7 by polymerase chain reaction (PCR) using the atTic20s primer (forward primer, 5′-GTTGGTAAGGATGATAACTG-3′) and the atTic20a-BamHI primer (reverse primer, 5′-GGATCCTTA- GTCGTACGGAATC-3′). The binary vector pCAMBIA3300-1 was digested with NcoI and treated with the Klenow fragment of DNA polymerase to generate blunt ends. The purified atTic20 open reading frame PCR product and blunt-end pCAMBIA3300 were ligated, and antisense atTic20 clones were confirmed by DNA sequencing. The pCAMBIA3300-1 vector was a kind gift from Dr. Felix Kessler (Swiss Federal Institute of Technology, Zurich, Switzerland).
Plant Transformation and Selection
The pCAMBIA3300-1/antisense atTic20 plasmid was transformed into Agrobacterium tumefaciens (GV3101) and introduced into Arabidopsis plants using the floral dip protocol (Clough and Bent, 1998). BASTA-resistant plants were confirmed for T-DNA transformation by PCR of genomic DNA of the transformants (McKinney et al., 1995). The confirmed antisense plants were grown to maturity under long- day conditions. Plants from the T1 seed of the transformed plants were assumed to be derived from independent T-DNA insertion events for purposes of phenotype characterization.
Chlorophyll Extraction and Quantification
Chlorophyll was extracted from total aboveground tissue or leaf tissue of antisense plants (T2 generation) and control plants of the same age by grinding in 80% acetone. The chlorophyll concentrations were determined by measuring absorbance at 652 nm (Arnon, 1949) and are expressed as μg chlorophyll/mg wet weight. The chlorophyll contents represent the means of four to seven samples.
Comparative Reverse Transcriptase–Mediated PCR
Total RNA was extracted from total aboveground tissue or leaf tissue of antisense plants (T2 generation) and control plants of the same age using the RNeasy Plant Mini Kit (Qiagen, Valencia, CA). First-strand cDNA was synthesized using random hexamer primers and 1 μg of total RNA with the SuperScript First-Strand Synthesis System (Invitrogen, Carlsbad, CA). The cDNA was diluted eight times, and 1 μL of the diluted cDNA was used as a template for each 50-μL PCR reaction. Comparative reverse transcriptase (RT)–mediated PCR was performed using the gene-specific primers for Tic20 and plant 18S rRNA as an internal control (QuantumRNA Plant 18S Internal Standards Kit; Ambion, Austin, TX). The gene-specific primer pairs to atTic20 were as follows: forward, atTic205′UTL (5′-CCTTGTTTG- TGAAGGCATTTT A-3′); reverse, atTic203′UTL (5′-GGAGTCATAACG-ATCCAATGTTGTTTC-3′). The linear range of the comparative PCR was determined to be 22 to 32 cycles, and the optimal ratio of the 18S rRNA and atTic20 primers was determined to be 6:4. Ethidium bromide–stained PCR products were quantified using a Kodak Digital DC120 EDAK digital camera system (Eastman Kodak, Rochester, NY). Each mRNA level represents the mean of four RT-PCR experiments.
Protein Extraction and Immunoblotting
Total protein was extracted directly in boiling SDS-PAGE sample buffer from total aboveground tissue or leaf tissue of antisense plants and control plants of the same age (Bauer et al., 2000a) for all immunoblots except those probed with anti-atTic20 serum. For anti-atTic20 immunoblots, total membrane fractions or total chloroplast envelope membrane fractions were prepared from antisense or control plants as described previously (Ma et al., 1996). Samples corresponding to equivalent amounts of protein were resolved by SDS-PAGE and transferred to nitrocellulose membranes. Immunoblotting was performed as described previously (Ma et al., 1996). Immunoblot signals were determined using a STORM chemiluminescence detector (Molecular Dynamics, Sunnyvale, CA) and by densitometric scanning of x-ray films. The amount of protein used for all immunoblots was chosen to ensure that the chemiluminescence signal for each antigen was a linear function of protein content. The relative level of each protein in the antisense plant extracts was expressed as a percentage of the chemiluminescence signal measured for the corresponding protein in control plant extracts.
Antisera to atTic20 were raised against an N-terminal peptide (SKDVPSSFRFPPMTKK). Antisera to atToc33 and Arabidopsis protochlorophyllide oxidoreductase (POR) were raised against full-length atToc33 and amino acids 70 to 234 of prePORA that had been expressed in Escherichia coli. Antiserum to the small subunit of ribulose-1,5-bisphosphate carboxylase/oxygenase (SSU) was prepared from purified ribulose-1,5-bisphosphate carboxylase/oxygenase as described previously (Schnell et al., 1991). Antiserum to the major light-harvesting complex protein (LHCP) was a kind gift of Dr. Kenneth Cline (University of Florida, Gainesville). Anti-actin (catalog no. A4700; Sigma Chemical Co., St. Louis, MO) was purchased from Sigma. Antisera to atTic110, atToc75, and atToc159 were a kind gift from Dr. Felix Kessler. Antiserum to the pyruvate dehydrogenase E1α subunit (PDHα) was a kind gift of Dr. Douglas Randall (University of Missouri, Columbia).
Electron Microscopy
Leaflets were fixed with 2.5% glutaraldehyde in 0.05 M sodium cacodylate, pH 7.4, under vacuum for 3 hr and washed three times with 0.05 M sodium cacodylate, pH 7.4. Fixed samples were treated with 1% osmium tetroxide in 0.05 M sodium cacodylate, pH 7.4, for 2 hr and washed three times with 0.05 M sodium cacodylate, pH 7.4. The samples were dehydrated by the following treatments: incubation in 70% ethanol for 10 min, incubation in 100% ethanol for 10 min, and incubation twice in 100% propylene oxide for 15 min. EMbed812 embedding mixture (Electron Microscopic Sciences, Fort Washington, PA) was prepared according to the manufacturer's instructions. Dehydrated samples were infiltrated with one-third concentrated EMbed812 (in propylene oxide) for 3 hr, two-thirds concentrated Embed812 overnight, and 100% Embed812 for 1.5 hr before embedding in EMbed812 by incubation at 60°C for 24 hr. Seventy-nanometer sections of the samples were prepared and dried on 150-mesh copper grids and poststained with uranyl acetate and lead citrate as described previously (Smith and Croft, 1991). The grids were dried and observed using a Philips-Tecnai (Eindhoven, The Netherlands) 12 transmission electron microscope.
Arabidopsis Chloroplast Preparation
Two- to 4-week-old Arabidopsis seedlings were grown on 0.9% agar plates containing 1% Suc and 0.5 times concentrated Murashige and Skoog medium including 50 μg/mL BASTA for antisense lines. The preparation of chloroplasts was performed as described by Fitzpatrick and Keegstra (2001). Briefly, aboveground tissue was collected and chopped into small pieces in digestion buffer (400 mM sorbitol, 0.5 mM CaCl2, and 20 mM Mes-KOH, pH 5.2). The plant tissue was treated with 4% Cellulase and 0.8% Macerozyme (Yakult Honsha, Tokyo, Japan) in digestion buffer at room temperature under moderate light for 3 to 4 hr to generate protoplasts. The protoplasts were separated from the plant tissue by filtering through 200-μm nylon mesh and washed with protoplast resuspension buffer (400 mM sorbitol, 0.5 mM CaCl2, and 20 mM Mes-KOH, pH 6.0). The protoplasts were lysed in breakage buffer (300 mM sorbitol, 5 mM EDTA, 5 mM EGTA, 10 mM NaHCO3, 0.1% BSA, and 20 mM Tricine-KOH, pH 8.4) by filtering sequentially through 20- and 10-μm nylon mesh. Chloroplasts were isolated and purified on Percoll as described previously (Ma et al., 1996).
In Vitro Import Assay
Chloroplasts were prepared from 2- to 4-week-old atTic20 antisense or control plants. The amounts of chloroplasts prepared from different lines were normalized to total protein content. Formation of early import intermediates and import assays were performed as described previously (Young et al., 1999; Chen et al., 2000) using 35S-Met–labeled in vitro–translated pea precursor to SSU (preSSU). For import, chloroplasts were incubated with 2 mM ATP under light at room temperature for the times indicated in Figures 8 and 10, repurified on 40% Percoll silica gel, and subjected to SDS-PAGE. Thermolysin treatments were performed on ice for 30 min using 100 μg thermolysin/mL as described previously (Schnell et al., 1994).
For binding and chase experiments, chloroplasts containing 130 μg of protein were preincubated in the dark at 26°C for 10 min to deplete endogenous ATP. The depleted chloroplasts were incubated for 10 min with 0.1 mM ATP and 35S-preSSU to form the early import intermediate. The chloroplasts were purified on 40% Percoll silica gel, and one-half was dissolved directly in SDS-PAGE sample buffer. The remaining chloroplasts were resuspended in import buffer containing 2 mM ATP and incubated for 15 min at 26°C. The chloroplasts then were collected with a brief spin and analyzed by SDS-PAGE. All samples were quantified using a Phosphorimager (Molecular Dynamics). The concentration of 35S-preSSU in Figure 9 was calculated from the known specific radioactivity of the 35S-Met used in the translation reaction. The phosphorimage intensity of serial dilutions of 35S-Met was converted to a molar amount based on its specific radioactivity (1000 Ci/mmol). This factor was used to determine the specific radioactivity of the 35S-preSSU by comparing the phosphorimage intensities of 35S-Met and 35S-preSSU.
Accession Numbers
The GenBank accession numbers for the genes described in this article are AC004809 (atTic20), AF095285 (psTic20), and N96442 (atTic20 expressed sequence tag clone F1H7T7).
Acknowledgments
The authors thank Tanya Wallas for her expert technical assistance and Dr. Kenneth Keegstra for providing the protocol for chloroplast isolation from Arabidopsis. This work was supported by Grant Nos. MCB-0090727 to D.J.S. and MCB-9904524 supporting L.F. from the National Science Foundation.
Article, publication date, and citation information can be found at www.plantcell.org/cgi/doi/10.1105/tpc.010336.
References
- Akita, M., Nielsen, E., and Keegstra, K. (1997). Identification of protein transport complexes in the chloroplastic envelope membranes via chemical cross-linking. J. Cell Biol. 136, 983–994. [DOI] [PMC free article] [PubMed] [Google Scholar]
- Arnon, D.I. (1949). Copper enzymes in isolated chloroplasts: Polyphenooxidase in Beta vulgaris. Plant Physiol. 24, 1–15. [DOI] [PMC free article] [PubMed] [Google Scholar]
- Aronsson, H., Sohrt, K., and Soll, J. (2000). NADPH:protochlorophyllide oxidoreductase uses the general import route into chloroplasts. Biol. Chem. 381, 1263–1267. [DOI] [PubMed] [Google Scholar]
- Bauer, J., Chen, K., Hiltbrunner, A., Wehrli, E., Eugster, M., Schnell, D., and Kessler, F. (2000. a). The major protein import receptor of plastids is essential for chloroplast biogenesis. Nature 403, 203–207. [DOI] [PubMed] [Google Scholar]
- Bauer, M.F., Hofmann, S., Neupert, W., and Brunner, M. (2000. b). Protein translocation into mitochondria: The role of TIM complexes. Trends Cell Biol. 10, 25–31. [DOI] [PubMed] [Google Scholar]
- Bauer, J., Hiltbrunner, A., and Kessler, F. (2001). Molecular biology of chloroplast biogenesis: Gene expression, protein import and intraorganellar sorting. Cell. Mol. Life Sci. 58, 420–433. [DOI] [PMC free article] [PubMed] [Google Scholar]
- Chen, D., and Schnell, D.J. (1997). Insertion of the 34-kDa chloroplast protein import component, IAP34, into the chloroplast outer membrane is dependent on its intrinsic GTP-binding capacity. J. Biol. Chem. 272, 6614–6620. [DOI] [PubMed] [Google Scholar]
- Chen, K., Chen, X., and Schnell, D.J. (2000). Initial binding of preproteins involving the Toc159 receptor can be bypassed during protein import into chloroplasts. Plant Physiol. 122, 813–822. [DOI] [PMC free article] [PubMed] [Google Scholar]
- Clough, S.J., and Bent, A.F. (1998). Floral dip: A simplified method for Agrobacterium-mediated transformation of Arabidopsis thaliana. Plant J. 16, 735–743. [DOI] [PubMed] [Google Scholar]
- Dahlin, C., and Cline, K. (1991). Developmental regulation of the plastid protein import apparatus. Plant Cell 3, 1131–1140. [DOI] [PMC free article] [PubMed] [Google Scholar]
- Fitzpatrick, L.M., and Keegstra, K. (2001). A method for isolating a high yield of Arabidopsis chloroplasts capable of efficient import of precursor proteins. Plant J. 27, 59–65. [DOI] [PubMed] [Google Scholar]
- Griffiths, W.T. (1978). Reconstitution of chlorophyll formation by isolated etioplast membranes. Biochem. J. 174, 681–692. [DOI] [PMC free article] [PubMed] [Google Scholar]
- Gutensohn, M., Schulz, B., Nicolay, P., and Flügge, U.L. (2000). Functional analysis of two Toc34 homologues in Arabidopsis indicates specialized functions in vivo. Plant J. 23, 771–783. [DOI] [PubMed] [Google Scholar]
- Hinnah, S.C., Hill, K., Wagner, R., Schlicher, T., and Soll, J. (1997). Reconstitution of a chloroplast protein import channel. EMBO J. 16, 7351–7360. [DOI] [PMC free article] [PubMed] [Google Scholar]
- Jackson-Constan, D., and Keegstra, K. (2001). Arabidopsis genes encoding components of the chloroplastic protein import apparatus. Plant Physiol. 125, 1567–1576. [DOI] [PMC free article] [PubMed] [Google Scholar]
- Jarvis, P., Chen, L.-J., Li, H., Peto, C.A., Fankhauser, C., and Chory, J. (1998). An Arabidopsis mutant defective in the plastid general protein import apparatus. Science 282, 100–103. [DOI] [PubMed] [Google Scholar]
- Johnston, M.L., Luethy, M.H., Miernyk, J.A., and Randall, D.D. (1997). Cloning and molecular analyses of the Arabidopsis thaliana plastid pyruvate dehydrogenase subunits. Biochim. Biophys. Acta 1321, 200–206. [DOI] [PubMed] [Google Scholar]
- Keegstra, K., and Cline, K. (1999). Protein import and routing systems of chloroplasts. Plant Cell 11, 557–570. [DOI] [PMC free article] [PubMed] [Google Scholar]
- Kessler, F., and Blobel, G. (1996). Interaction of the protein import and folding machineries in the chloroplast. Proc. Natl. Acad. Sci. USA 93, 7684–7689. [DOI] [PMC free article] [PubMed] [Google Scholar]
- Kouranov, A., and Schnell, D.J. (1997). Analysis of the interactions of preproteins with the import machinery over the course of protein import into chloroplasts. J. Cell Biol. 139, 1677–1685. [DOI] [PMC free article] [PubMed] [Google Scholar]
- Kouranov, A., Chen, X., Fuks, B., and Schnell, D.J. (1998). Tic20 and Tic22 are new components of the protein import apparatus at the chloroplast inner envelope membrane. J. Cell Biol. 143, 991–1002. [DOI] [PMC free article] [PubMed] [Google Scholar]
- Kumar, M.A., and Soll, D. (2000). Antisense HEMA1 RNA expression inhibits heme and chlorophyll biosynthesis in Arabidopsis. Plant Physiol. 122, 49–55. [DOI] [PMC free article] [PubMed] [Google Scholar]
- Lubeck, J., Soll, J., Akita, M., Nielsen, E., and Keegstra, K. (1996). Topology of IEP110, a component of the chloroplastic protein import machinery present in the inner envelope membrane. EMBO J. 15, 4230–4238. [PMC free article] [PubMed] [Google Scholar]
- Ma, Y., Kouranov, A., LaSala, S., and Schnell, D.J. (1996). Two components of the chloroplast protein import apparatus, IAP86 and IAP75, interact with the transit sequence during the recognition and translocation of precursor proteins at the outer envelope. J. Cell Biol. 134, 315–327. [DOI] [PMC free article] [PubMed] [Google Scholar]
- McKinney, E.C., Ali, N., Traut, A., Feldmann, K.A., Belostotsky, D.A., McDowell, J.M., and Meagher, R.B. (1995). Sequence-based identification of T-DNA insertion mutations in Arabidopsis: Actin mutants act2-1 and act4-1. Plant J. 8, 613–622. [DOI] [PubMed] [Google Scholar]
- Muckel, E., and Soll, J. (1996). A protein import receptor of chloroplasts is inserted into the outer envelope membrane by a novel pathway. J. Biol. Chem. 271, 23846–23852. [DOI] [PubMed] [Google Scholar]
- Murashige, T., and Skoog, F. (1962). A revised medium for rapid growth and bioassays with tobacco tissue culture. Physiol. Plant. 15, 473–497. [Google Scholar]
- Nielsen, E., Akita, M., Davila-Aponte, J., and Keegstra, K. (1997). Stable association of chloroplastic precursors with protein translocation complexes that contain proteins from both envelope membranes and a stromal Hsp100 molecular chaperone. EMBO J. 16, 935–946. [DOI] [PMC free article] [PubMed] [Google Scholar]
- Rassow, J., Dekker, P.J., van Wilpe, S., Meijer, M., and Soll, J. (1999). The preprotein translocase of the mitochondrial inner membrane: Function and evolution. J. Mol. Biol. 286, 105–120. [DOI] [PubMed] [Google Scholar]
- Reinbothe, S., Mache, R., and Reinbothe, C. (2000). A second, substrate-dependent site of protein import into chloroplasts. Proc. Natl. Acad. Sci. USA 97, 9795–9800. [DOI] [PMC free article] [PubMed] [Google Scholar]
- Reumann, S., Davila-Aponte, J., and Keegstra, K. (1999). The evolutionary origin of the protein-translocating channel of chloroplastic envelope membranes: Identification of a cyanobacterial homolog. Proc. Natl. Acad. Sci. USA 96, 784–789. [DOI] [PMC free article] [PubMed] [Google Scholar]
- Schnell, D.J., and Blobel, G. (1993). Identification of intermediates in the pathway of protein import into chloroplasts and their localization to envelope contact sites. J. Cell Biol. 120, 103–115. [DOI] [PMC free article] [PubMed] [Google Scholar]
- Schnell, D.J., Blobel, G., and Pain, D. (1991). Signal peptide analogs derived from two chloroplast precursors interact with the signal recognition system of the chloroplast envelope. J. Biol. Chem. 266, 3335–3342. [PubMed] [Google Scholar]
- Schnell, D.J., Kessler, F., and Blobel, G. (1994). Isolation of components of the chloroplast protein import machinery. Science 266, 1007–1012. [DOI] [PubMed] [Google Scholar]
- Schnell, D.J., Blobel, G., Keegstra, K., Kessler, F., Ko, K., and Soll, J. (1997). A nomenclature for the protein import components of the chloroplast envelope. Trends Cell Biol. 7, 303–304. [DOI] [PubMed] [Google Scholar]
- Smith, M., and Croft, S. (1991). Embedding and thin section preparation. In Electron Microscopy in Biology, J.R. Harris, ed (New York: Oxford University Press), pp. 17–37.
- Stahl, T., Glockmann, C., Soll, J., and Heins, L. (1999). Tic40, a new “old” subunit of the chloroplast protein import translocon. J. Biol. Chem. 274, 37467–37472. [DOI] [PubMed] [Google Scholar]
- Sveshnikova, N., Grimm, R., Soll, J., and Schleiff, E. (2000). Topology studies of the chloroplast protein import channel Toc75. Biol. Chem. 381, 687–693. [DOI] [PubMed] [Google Scholar]
- Tranel, P.J., and Keegstra, K. (1996). A novel, bipartite transit peptide targets OEP75 to the outer membrane of the chloroplastic envelope. Plant Cell 8, 2093–2104. [DOI] [PMC free article] [PubMed] [Google Scholar]
- van den Wijngaard, P.W., and Vredenberg, W.J. (1997). A 50-picosiemens anion channel of the chloroplast envelope is involved in chloroplast protein import. J. Biol. Chem. 272, 29430–29433. [DOI] [PubMed] [Google Scholar]
- van den Wijngaard, P.W., and Vredenberg, W.J. (1999). The envelope anion channel involved in chloroplast protein import is associated with Tic110. J. Biol. Chem. 274, 25201–25204. [DOI] [PubMed] [Google Scholar]
- van den Wijngaard, P.W., Dabney-Smith, C., Bruce, B.D., and Vredenberg, W.J. (1999). The mechanism of inactivation of a 50-pS envelope anion channel during chloroplast protein import. Biophys. J. 77, 3156–3162. [DOI] [PMC free article] [PubMed] [Google Scholar]
- van den Wijngaard, P.W., Demmers, J.A., Thompson, S.J., Wienk, H.L., de Kruijff, B., and Vredenberg, W.J. (2000). Further analysis of the involvement of the envelope anion channel PIRAC in chloroplast protein import. Eur. J. Biochem. 267, 3812–3817. [DOI] [PubMed] [Google Scholar]
- Wan, J., Bringloe, D., and Lamppa, G.K. (1998). Disruption of chloroplast biogenesis and plant development upon down-regulation of a chloroplast processing enzyme involved in the import pathway. Plant J. 15, 459–468. [Google Scholar]
- Young, M.E., Keegstra, K., and Froehlich, J.E. (1999). GTP promotes the formation of early-import intermediates but is not required during the translocation step of protein import into chloroplasts. Plant Physiol. 121, 237–244. [DOI] [PMC free article] [PubMed] [Google Scholar]
- Yu, T.S., and Li, H. (2001). Chloroplast protein translocon components atToc159 and atToc33 are not essential for chloroplast biogenesis in guard cells and root cells. Plant Physiol. 127, 90–96. [DOI] [PMC free article] [PubMed] [Google Scholar]


