Abstract
Current assessment of orthotopic tumor models in animals utilizes survival as the primary therapeutic end point. In vivo bioluminescence imaging (BLI) is a sensitive imaging modality that is rapid and accessible, and may comprise an ideal tool for evaluating anti-neoplastic therapies [1]. Using human tumor cell lines constitutively expressing luciferase, the kinetics of tumor growth and response to therapy have been assessed in intraperitoneal [2], subcutaneous, and intravascular [3] cancer models. However, use of this approach for evaluating orthotopic tumor models has not been demonstrated. In this report, the ability of BLI to noninvasively quantitate the growth and therapeutic-induced cell kill of orthotopic rat brain tumors derived from 9L gliosarcoma cells genetically engineered to stably express firefly luciferase (9LLuc) was investigated. Intracerebral tumor burden was monitored over time by quantitation of photon emission and tumor volume using a cryogenically cooled CCD camera and magnetic resonance imaging (MRI), respectively. There was excellent correlation (r=0.91) between detected photons and tumor volume. A quantitative comparison of tumor cell kill determined from serial MRI volume measurements and BLI photon counts following 1,3-bis(2-chloroethyl)-1-nitrosourea (BCNU) treatment revealed that both imaging modalities yielded statistically similar cell kill values (P=.951). These results provide direct validation of BLI imaging as a powerful and quantitative tool for the assessment of antineoplastic therapies in living animals.
Keywords: luciferase, bioluminescence, in vivo imaging, cell kill, therapeutic response
Introduction
Rodent tumor models have become indispensable in the discovery and assessment of new anticancer therapies [4]. Many preclinical in vivo studies of experimental therapeutics utilize rapidly growing transplantable mouse or human tumor cell lines injected subcutaneously in syngeneic or immuno-deficient rodents, to facilitate quantitation of tumor growth and treatment response using caliper measurements of tumor volume. However, these studies may not be representative of tumor biology as the phenotypes of neoplastic cells can be modulated by interaction with surrounding normal tissue, and both treatment responses and therapy-induced toxicities can vary at different organ sites [5–8]. Orthotopic tumor models are arguably more appropriate models of human cancer because they may reproduce some of the organ-specific properties of human tumor growth. However, quantitative measurements of therapeutic-induced changes in tumor growth in orthotopic models are more difficult to obtain, usually requiring that large numbers of animals be killed at multiple time points to overcome variability between animals. These facts underscore the need for high-throughput surrogate markers for evaluating therapeutic response in preclinical studies of new therapeutic strategies.
Materials and Methods
Production of 9Lluc Cell Line
The luciferase expression plasmid pGL3 (Promega, Madison, WI) was cotransfected into 9L cells in the presence of an expression vector for neomycin resistance (neoR) at a ratio of 10:1. The resulting G418R colonies were isolated and cultured independently and the best expressing lines were identified based on the level of bioluminescent activity in the presence of luciferin in living cells. A highly bioluminescent clone (9LLuc) that demonstrated in vivo growth characteristics similar to the parental 9L cell line was selected for further studies.
Animal Model
Rat 9LLuc cells were grown as monolayers in minimal essential medium (MEM) supplemented with 10% fetal calf serum, 100 IU/ml penicillin and 100 mg/ml streptomycin, and 2 mM l-glutamine at 37°C in a 95/5% air/CO2 atmosphere. Intracerebral 9LLuc tumors were induced in male Fischer 344 rats weighing between 125 and 135 g by implantation of 105 cells in 5 µl serum-free MEM in the right forebrain at a depth of 3 mm through a 1-mm burr hole. The surgical field was cleaned with 70% ethanol and the burr hole was filled with bone wax to prevent extracerebral extension of the tumor. For chemotherapeutic studies, 1,3-bis(2-chloroethyl)-1-nitrosourea (BCNU) was dissolved in absolute ethanol and diluted in saline (10% final ethanol) at the time of treatment and administered by a single i.p. injection at a dose of 1.0xLD10 (n=5) corresponding to 13.3 mg BCNU/kg body weight. Control 9LLuc animals (n=5) received an i.p. injection of vehicle (10% ethanol in saline) only.
Magnetic Resonance Imaging
Magnetic resonance imaging (MRI) was performed every other day beginning 10 days after tumor cell implantation on a Varian Unity Inova system equipped with a 7.0-T, 18.3-cm horizontal bore magnet (Oxford Instruments Inc., Oxfordshire, UK) and a quadrature rat head coil. Rats were anesthetized with a 2% isofluorane/air mixture and maintained at 37°C inside the magnet using a heated, thermostated circulating water bath. A single-slice sagittal gradient-echo sequence was used to confirm proper animal positioning and to prescribe subsequent acquisitions. T2-weighted transverse brain images were obtained using a spin-echo sequence with the following parameters: 3.0-second repetition time, 60-msec echo time, field of view=30x30 mm using a 128x128 matrix, slice thickness=1 mm, number of slices=15 with no gap, and one excitation. Tumor volumes were derived from multislice MR data sets as previously described [9]. In brief, the tumor boundary visualized in each slice was defined as a region-of-interest (ROI) using image-processing software (Advanced Visual Systems, Waltham, MA). The sum of the number of tumor-containing pixels in each slice was then multiplied by the MR voxel volume to obtain the total tumor volume. Voxel volume was calculated as:
In Vivo Bioluminescence Imaging
In vivo bioluminescence imaging (BLI) was conducted on a cryogenically cooled IVIS™ system (Xenogen Corp., Alameda, CA) coupled to a data-acquisition PC running LivingImage™ software (Xenogen Corp.) as an overlay on IGOR (Wavemetrics, Seattle, WA) under Windows 98. This system has been recently developed by Xenogen Corporation to provide outstanding signal-to-noise images of luciferase signals emerging from within living animals. Before imaging, animals were anesthetized in a plastic chamber filled with 2% isofluorane/air mixture and 150 mg/ml of luciferin (potassium salt, Xenogen Corp.) in normal saline was injected (i.p.) at a dose of 150 mg/kg body weight. This dose and route of administration has been previously shown to be optimal for studies in rodents when images were acquired between 10 and 20 minutes post-luciferin administration [10]. During image acquisition, isofluorane anesthesia was maintained using a nose cone delivery system and animal body temperature was regulated using a digitally thermostated bed integrated within the IVIS system. A gray scale body surface image was collected in the chamber under dim illumination, followed by acquisition and overlay of the pseudocolor image representing the spatial distribution of detected photon counts emerging from active luciferase within the animal. An integration time of 1 minute was used for luminescent image acquisition. Signal intensity was quantified as the sum of all detected photon counts within a region of interest prescribed over the rat head using the LivingImage™ software package.
Tumor Cell Kill Calculations and Statistical Analysis
Quantitation of tumor cell kill from imaging data for each animal was accomplished as previously described [9]. In brief, log(cell kill)=log10[Vpre/Vpost] where V represents the tumor volume or summed photon counts from MRI and BLI measurements, respectively. Statistical comparisons between log cell kill values obtained by MRI and BLI were made using unpaired Student's t test. Differences in animal survival rates were determined by Kaplan-Meier Analysis. A probability value of P<.05 was considered significant.
Results
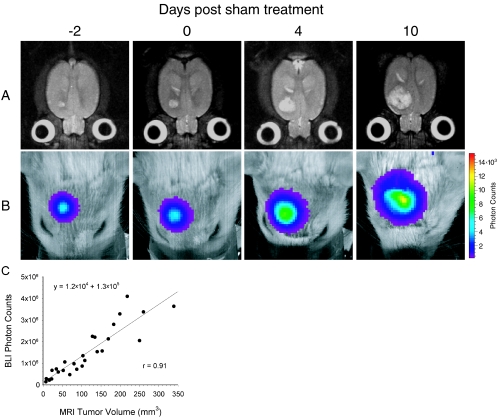
The ability of BLI to quantitate in vivo tumor burden in an orthotopic animal model was investigated through in vivo measurements of both the tumor volume and photon emission from the same group of animals over time. A time series of transverse T2-weighted MR images of a representative tumor-bearing rat brain demonstrates the growth of a 9LLuc tumor, which appears as a hyperintense lesion in the right forebrain (Figure 1A). Corresponding BL images of the same animal, displayed as a pseudocolor image overlaid on a gray scale reference image of the rat head, reveal an intense signal arising from the tumor (Figure 1B). Scatter of tumor-emitted photons as they pass through the brain, bone, and skin likely account for the BL pseudocolor image exceeding the tumor dimensions as measured by MRI. Over time, the bioluminescence signal from the tumor increased in both apparent diameter and intensity as the tumor volume, as measured by MRI, increased. The detected luminescent signal at each time point was quantified and plotted against the corresponding MRI-determined tumor volume for each of the five sham-treated animals. Linear regression analysis revealed an excellent correlation (r=0.91) between the measurement of intracerebral tumor burden using these two imaging modalities (Figure 1C).
Figure 1.
Kinetics of intracranial glioma growth in a representative animal. 9LLuc cells were implanted intracerebrally at 16 days before sham treatment with ethanol vehicle and tumor progression was monitored with MRI (A) and BLI (B). The days, post-sham treatment, on which the images were obtained are indicated at the top. The MR images are T2-weighted and are of a representative slice from the multislice dataset. The scale to the right of the BL images describes the color map for the luminescent signal. Correlation of tumor volume with in vivo photon emission is shown where tumor volume was measured from T2-weighted MR images and plotted against total measured photon counts (C). The relationship between the two measurements was defined by regression analysis (r=0.91).
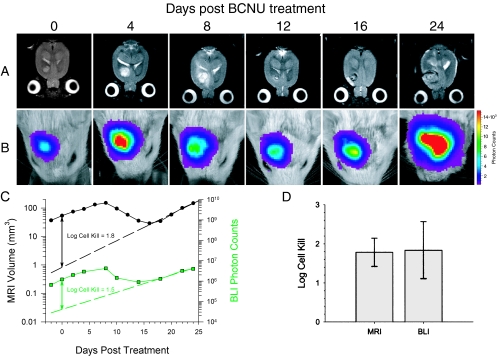
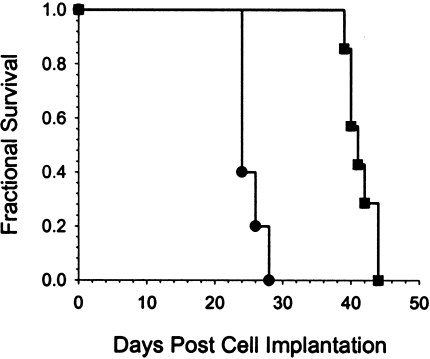
Quantitation of therapeutic efficacy was accomplished on a separate group of rats with intracerebral 9LLuc tumors, which were treated with the chemotherapeutic agent BCNU. MR and BL images of a representative animal from this experiment are shown in Figure 2A and B, respectively. The first images were acquired within 2 hours of BCNU administration followed by repeat scans acquired at selected posttreatment intervals. The MR images revealed that the tumor continued to expand up to 8 days after treatment followed by regression and subsequent regrowth. The corresponding BL images revealed parallel changes in detected photon emission over this same time period. Similar results were observed for the other four animals in the BCNU-treatment group. A plot of tumor volume and detected photon counts versus time for this animal is shown in Figure 2C along with an exponential fit of the tumor regrowth data. Extrapolation of the tumor regrowth back to the time of treatment, allowed for quantitation of cell kill in each animal studied, as previously described [9]. Mean log cell kill values determined by MRI and BLI were 1.78±0.36 (n=5 animals) and 1.84±0.73 (n=5 animals), respectively (Figure 2D), indicating that these two independent imaging methods were statistically identical (P=.951). The BCNU-induced tumor cell kill resulted in a statistically significant increase (P=.007) in the survival of the treated animals (41.0±0.7 days) compared with the controls (25.2±7.2 days) as shown in Figure 3.
Figure 2.
Temporal analysis of the response of a 9LLuc tumor to BCNU chemotherapy. Tumor cells were implanted 16 days before treatment. Tumor volume was monitored with T2-weighted MRI (A) and intratumoral luciferase activity was monitored with BLI (B). The days post-BCNU therapy on which the images were obtained are indicated at the top. The scale to the right of the BL images describes the color map for the photon count. Quantitative analysis of tumor progression and response to BCNU chemotherapy (C). Tumor volumes (●) and total tumor photon emission (■) obtained by T2-weighted MRI and BLI, respectively, are plotted versus days post-BCNU treatment. The dashed lines are the regression fits of the exponential tumor repopulation following therapy. The solid vertical lines denote the apparent tumor-volume and photon-production losses elicited by BCNU on the day of treatment from which log cell kill values were calculated as previously described [9]. Comparison of log cell kill values determined from MRI and BLI measurements (D). Log cell kill elicited by BCNU chemotherapy was calculated using MRI (1.78±0.36) and BLI (1.84±0.73). Data are represented as mean±SEM for each animal (n=5). There was no statistically significant difference between the log kills calculated using the MRI and BLI data (P=.951).
Figure 3.
Kaplan-Meier survival analysis of 1xLD10 BCNU-treated (■) and sham-treated control (●) animals. The mean survival times were 41.0±0.7 and 25.2±7.5 days, respectively, for the treated and control groups (mean±SEM, n=5). There was a statistically significant increased life span in the treated animals (P=.007 Mantel-Cox logrank test).
Discussion
We have previously reported that serial measurements of tumor volume obtained from standard T2-weighted MR images of intracerebral 9L tumors can be used to accurately quantitate tumor cell kill in individual animals [9]. In this study, MRI-based measurements were used to validate BLI-based measurements of orthotopic tumor growth and therapy-induced tumor cell kill in individual animals. There appears to be a linear relationship between MRI-determined tumor volume and tumor light output as measured through BLI. Both living and dead tumor cells, as well as dead tumor cell debris, infiltrating host cells, and peritumoral edema may all contribute to the MRI-determined tumor volume. In contrast, tumor light output is presumably derived solely from metabolically active transformed tumor cells. This may result in less robust correlation between MRI-determined tumor volume and photon counts in treated tumors or large untreated tumors in which regions of the tumor may be necrotic. In support of this hypothesis, we have observed less significant correlations between tumor volume and photon counts following treatment (data not shown). This may represent an advantage of BLI over direct measurements of tumor volume using MRI or calipers as it provides a quantitative surrogate measure of the number metabolically active tumor cells.
Other advantages of the BLI approach for preclinical evaluation of therapeutic interventions include reasonable equipment costs, short scanning times of only 1 to 5 minutes, simultaneous scanning of multiple animals in a single image acquisition, and minimal postprocessing requirements. However, BLI is currently a two-dimensional imaging modality with only 1- to 2-mm spatial resolution due to photon scattering, which impairs detailed assessment of tumor anatomy and invasion. The quantitative nature and higher throughput of BLI should significantly reduce the cost of preclinical drug discovery and development by accelerating in vivo analyses of orthotopic animal models of neoplastic disease.
Acknowledgement
We thank Phillip Kish for technical assistance.
Footnotes
Support for this work was provided by the National Cancer Institute (R24-CA83099, P20-CA86442, NOI-CO-07013).
References
- 1.Contag CH, Jenkins D, Contag PR, Negrin RS. Use of reporter genes for optical measurements of neoplastic disease in vivo. Neoplasia. 2000;2:41–52. doi: 10.1038/sj.neo.7900079. [DOI] [PMC free article] [PubMed] [Google Scholar]
- 2.Sweeney TJ, Mailander V, Tucker AA, Olomu AB, Zhang W, Cao Y, Negrin RS, Contag CH. Visualizing the kinetics of tumor-cell clearance in living animals. Proc Natl Acad Sci USA. 1999;96:12044–12049. doi: 10.1073/pnas.96.21.12044. [DOI] [PMC free article] [PubMed] [Google Scholar]
- 3.Edinger M, Sweeney TJ, Tucker AA, Olomu AB, Negrin RS, Contag CH. Noninvasive assessment of tumor cell proliferation in animal models. Neoplasia. 1999;1:303–310. doi: 10.1038/sj.neo.7900048. [DOI] [PMC free article] [PubMed] [Google Scholar]
- 4.Curt GA. The use of animal models in cancer drug discovery and development. Stem Cells. 1994;12:23–29. doi: 10.1002/stem.5530120107. [DOI] [PubMed] [Google Scholar]
- 5.Dong Z, Radinsky R, Fan D, Tsan R, Bucana CD, Wilmanns C, Fidler IJ. Organ-specific modulation of steady-state mdr gene expression and drug resistance in murine colon cancer cells. J Natl Cancer Inst. 1994;86:913–920. doi: 10.1093/jnci/86.12.913. [DOI] [PubMed] [Google Scholar]
- 6.Fidler IJ, Wilmanns C, Staroselsky A, Radinsky R, Dong Z, Fan D. Modulation of tumor cell response to chemotherapy by the organ environment. Cancer Metastasis Rev. 1994;13:209–222. doi: 10.1007/BF00689637. [DOI] [PubMed] [Google Scholar]
- 7.Killion JJ, Radinsky R, Fidler IJ. Orthotopic models are necessary to predict therapy of transplantable tumors in mice. Cancer Metastasis Rev. 1998;17:279–284. doi: 10.1023/a:1006140513233. [DOI] [PubMed] [Google Scholar]
- 8.Ross BD, Mitchell SL, Merkle H, Garwood M. In vivo 31P and 2H NMR studies of rat brain tumor pH and blood flow during acute hyperglycemia: differential effects between subcutaneous and intracerebral locations. Magn Reson Med. 1989;12:219–234. doi: 10.1002/mrm.1910120208. [DOI] [PubMed] [Google Scholar]
- 9.Ross BD, Zhao YJ, Neal ER, Stegman LD, Ercolani M, Ben-Yoseph O, Chenevert TL. Contributions of cell kill and posttreatment tumor growth rates to the repopulation of intracerebral 9L tumors after chemotherapy: an MRI study. Proc Natl Acad Sci USA. 1998;95:7012–7017. doi: 10.1073/pnas.95.12.7012. [DOI] [PMC free article] [PubMed] [Google Scholar]
- 10.Contag CH, Spilman SD, Contag PR, Oshiro M, Eames B, Dennery P, Stevenson DK, Benaron DA. Visualizing gene expression in living mammals using a bioluminescent reporter. Photochem Photobiol. 1997;66:523–531. doi: 10.1111/j.1751-1097.1997.tb03184.x. [DOI] [PubMed] [Google Scholar]


