

Abstract
Current theories of CF pathogenesis predict different predisposing “local environmental” conditions and sites of bacterial infection within CF airways. Here we show that, in CF patients with established lung disease, Psuedomonas aeruginosa was located within hypoxic mucopurulent masses in airway lumens. In vitro studies revealed that CF-specific increases in epithelial O2 consumption, linked to increased airway surface liquid (ASL) volume absorption and mucus stasis, generated steep hypoxic gradients within thickened mucus on CF epithelial surfaces prior to infection. Motile P. aeruginosa deposited on CF airway surfaces penetrated into hypoxic mucus zones and responded to this environment with increased alginate production. With P. aeruginosa growth in oxygen restricted environments, local hypoxia was exacerbated and frank anaerobiosis, as detected in vivo, resulted. These studies indicate that novel therapies for CF include removal of hypoxic mucus plaques and antibiotics effective against P. aeruginosa adapted to anaerobic environments.
Introduction
Lung infections with Pseudomonas aeruginosa constitute the predominant disease phenotype in cystic fibrosis (CF) patients (1). Despite a vigorous and rapid influx of functional peripheral blood neutrophils into infected CF airways (2) accompanied by the production of high titers of specific Ab’s, P. aeruginosa infections become chronic (3), airways are destroyed, and lung function declines.
Several hypotheses have been offered to explain the failure of mucosal defense and the high prevalence of P. aeruginosa in the CF lung. Most hypotheses have focused on bacterial infection of CF airway epithelia, mediated by an increased binding of P. aeruginosa to the surfaces of CF airway epithelial cells (4, 5) impaired internalization and killing of P. aeruginosa by CF airway epithelia due to the absence of cystic fibrosis transmembrane conductance regulator (CFTR) at the apical surface (6), or “high-salt”–mediated defensin inactivation (7). In contrast, the reduced airway surface liquid (ASL) volume (impaired mucus clearance) hypothesis predicts infection by P. aeruginosa and other pathogens of stationary mucus adherent to airway surfaces.
As an approach to distinguish among these hypotheses, we sought to identify the site of P. aeruginosa infection in freshly excised CF airways, differentiating between the intraluminal (mucus) and epithelial surface compartments. Based on our observations that P. aeruginosa resided in the intraluminal contents, we asked what conditions confronted P. aeruginosa in this microenvironment in vivo in CF patients, focusing on O2 availability. We extended these studies to investigate in vitro whether airway mucus hypoxia (O2 gradients) was present in thickened CF mucus before infection and whether steep O2 gradients within mucus were unique to the CF genotype. Finally, we explored the hypotheses that (a) bacteria deposited on airway surfaces penetrate into hypoxic mucus, and (b) P. aeruginosa responses to hypoxia, e.g., increased alginate production, may favor its persistence in the CF lung.
Methods
Study subjects: normal, CF, and disease controls.
Lungs from seven CF patients chronically infected with P. aeruginosa were obtained for morphometric analyses after lung transplantation (five males and two females, mean age 29.5 years; Cystic Fibrosis/Pulmonary Research and Treatment Center, University of North Carolina, Chapel Hill, Chapel Hill, North Carolina, USA) or after lobectomy (two females, mean age 8 years; Service de Pédiatrie, Centre Hospitalier Lyon-Sud, Pierre-Bénite, France). Nasal polyps from four CF patients (mean age 14.3 years; Ear, Nose and Throat Clinic, Klinikum Ludwigshafen, Germany), and from four non-CF individuals (mean age 46.5 years; Ear, Nose and Throat Clinic, University of Tübingen, Germany) were used for spheroid cell cultures. Cells for planar cell cultures were obtained from seven normal lung transplant donors (four males, three females, mean age 42 ± 6 years), eight CF lung transplant recipients (four males, three females, mean age 34 ± 3 years), and two primary ciliary dyskinesia (PCD) lung transplant recipients (one male, one female, ages 15 and 50 years, respectively). For in vivo oxygen partial pressure (pO2) measurements, six CF patients (two males, four females, mean age 23.8 years; mean forced expiratory volume in one second, 55.7% predicted) were studied. Data were successfully obtained from three patients. Informed consent was obtained from all patients and/or parents, and all parts of the study were approved by the local ethical committees.
Bacterial strains.
PAO1 (8) bacteria were grown for adhesion experiments in vitro overnight at 37°C in 5 ml Trypticase soy broth (TSB; Oxoid Ltd., Basingstoke, United Kingdom). A bacterial suspension (10–50 μl) of the overnight culture (OD600nm 0.05) was inoculated into 5 ml fresh TSB medium and the bacteria cultured until the OD600nm of 1.5 was reached. For confocal microscopy studies, the P. aeruginosa strain ATCC 27853 was used. For alginate measurements, 15 genetically different non-CF (environmental) strains of P. aeruginosa as well as PAO1 were analyzed, and for growth in ASL, PAO1 and P. aeruginosa ATCC 700829 were tested. PAO1 grown in TSB was used for O2 measurements.
Microscopy of lung sections.
Immediately after resection, lung tissues were cut into 0.5-cm3 cubes and fixed in 2.5% glutaraldehyde, 10% formaldehyde, or shock-frozen in liquid nitrogen. For immunofluorescence, thin sections (5–10 μm) were prepared from shock-frozen lung tissues and P. aeruginosa identified in bronchi/bronchioli with polyclonal rabbit IgG specific for whole P. aeruginosa cells; then incubation occurred with indocarbocyanin-conjugated (Cy3-conjugated) goat anti-rabbit IgG (Dianova, Hamburg, Germany), diluted 1:500. Eight sections from each of nine separate CF lung samples (72 sections total) were analyzed for P. aeruginosa location, using the KS300 Imaging System (Kontron Electronic GmbH, Eching, Germany). For transmission electron microscopy (TEM), segmental bronchi (∼6.5-mm sections) from nine CF lungs were postfixed in OSO4, thin sections cut, and uracyl acetate/lead citrate stained. For scanning electron micrographs, specimens were processed as described previously (9). Squares (406) from 14 bronchi from two CF lungs were analyzed for binding of P. aeruginosa to the epithelium.
Adhesion of P. aeruginosa to mucus adherent to primary nasal epithelial spheroids.
The spheroid cell culture system was used as described previously (9). To collect secreted mucus, spheroids were incubated in DMEM/Ham’s F12 medium (Life Technologies Inc., Heidelberg, Germany) depleted of antibiotics and antimycotics for 5 days, supernatant collected by centrifugation (225 g), and stored at –20°C until use.
Spheroids (8 weeks; four CF and four normal [NL]), suspended in DMEM/Ham’s F12 medium, were incubated with P. aeruginosa at a cell/bacteria ratio of 1:100 for 2 hours/37°C/5% CO2. In some experiments, mucus was removed from spheroids by prewashing with PBS. After incubation with P. aeruginosa, spheroids were washed using a cell strainer (Becton Dickinson, Heidelberg, Germany). Twenty to 30 spheroids per individual were analyzed for adherence of P. aeruginosa by scanning electron microscopy (9).
P. aeruginosa was incubated with spheroid supernatants containing mucus for 2 hours at 37°C/5% CO2. After washing, bacteria were fixed on coverslips, incubated with a mAb to human mucins, washed, incubated with a Cy3-conjugated goat anti-mouse IgG (DAKO Corp., Hamburg, Germany) for 40 minutes at 23°C, washed with water, and embedded in Permafluor (Sigma Chemical Co., St. Louis, Missouri, USA).
Fiberoptic bronchoscopy.
Fiberoptic bronchoscopy was performed as described previously (2) with minor modifications. For in vivo pO2 measurements, a computerized Clark type oxygen probe (length: 65 cm; outer diameter: 2 mm; inner diameter: 0.4 mm; Licox pO2; GMS, Kiel, Germany) was fixed to the tip of the bronchoscope and guided under video control into right upper lobes obstructed with mucopurulent material.
Planar, primary bronchial culture system.
Human airway epithelial cells were obtained from freshly excised bronchi by protease digestion (10), seeded directly on 12-mm Transwell Col membranes (Corning-Costar Corp., Cambridge, Massachusetts, USA) in modified bronchial epithelial growth medium under air-liquid interface conditions and studied when fully differentiated (2–5 weeks; transepithelial resistance of ≥ 350 Ω cm2).
Measurement of ASL pO2–planar bronchial cultures.
O2 microelectrodes were purchased from Diamond General Development Corp. (Ann Arbor, Michigan, USA). The O2 microelectrode and 3 M KCl reference electrode were advanced into ASL with micromanipulators as described previously (11).
Confocal microscopy measurements of ASL/P. aeruginosa.
PBS (30 μl) containing 2 mg/ml Texas Red-dextran (10 kDa; Molecular Probes Inc., Eugene, Oregon, USA) was added to CF cultures 2–48 hours before the addition of bacteria or fluorescent beads (1 μm; Molecular Probes Inc.) as described previously (12). For all studies, perfluorocarbon (FC-77, 3M Co., St. Paul, Minnesota, USA) was added to the mucus surface to prevent ASL evaporation.
P. aeruginosa bacteria were suspended in 3 ml PBS (OD470 of 0.15 [∼107 CFU/ml]) and incubated with 5 μM SYTO 13 (Molecular Probes Inc.) for 1 hour at 37°C. The bacterial suspension was washed once in PBS, centrifuged, and the pellet resuspended in PBS (100 μl).
Bacterial growth and production of alginate by P. aeruginosa in aerobic and anaerobic culture conditions.
To determine whether P. aeruginosa is able to grow in freshly harvested ASL from CF and NL well-differentiated cultures (11) under aerobic and anaerobic (anaerobic chamber from Coy Laboratory Products, Gross Lake, Michigan, USA) conditions, a small number of bacteria (∼100–200 CFU/0.5 μl) of PAO1 or the environmental P. aeruginosa strain (ATCC 700829) was added to 30 μl of ASL in parallel in two titer plates. For these experiments, the bacteria were grown on sheep blood agar overnight, suspended in PBS, with this suspension adjusted to an OD470nm of 0.15, diluted 1:100 in PBS, and starved for 2 hours before addition to ASL. Titer plates were incubated aerobically and anaerobically for 72 hours at 37°C. To determine the number of bacteria in ASL, samples were serially diluted and plated onto agar.
We next measured the alginate mass/bacterial protein mass under aerobic and anaerobic conditions, using anaerobic jars and Anaerocult A (Merck KGaA, Darmstadt, Germany), with strain PAO1 and 15 environmental P. aeruginosa strains grown on Pseudomonas isolation agar (PIA). After 4 days of growth, the bacteria were rinsed with water from the plates and the alginate was measured by the carbazole assay (13). Uronic acids were quantified using a standard curve of alginate purified from Macrocystis pyrifera (Sigma Chemical Co.), followed by the BCA protein assay to estimate bacterial protein mass (Pierce Chemical Co., Rockford, Illinois, USA). In parallel, we visualized P. aeruginosa alginate by immunostaining PAO1, grown on Columbia sheep blood agar and fixed on slides, with rabbit antiserum specific for P. aeruginosa alginate followed by Cy3-labeled goat anti-rabbit IgG (Dianova).
Finally, we examined the role of nitrate as a terminal electron acceptor in alginate production under aerobic versus anaerobic conditions. PAO1 was grown on PIA agar plates (63 μM nitrate without added nitrate) to which a range of KNO3 was added (10 μM–100 mM), and after 4 days of growth, alginate and bacterial protein was quantitated as above.
Measurements of ASL total nitrate concentration.
Total nitrate (nitrite/nitrate) concentrations in CF and NL ASL (each CF/NL sample was obtained from pooled ASL collections from cultures derived from ten or more different subjects) were measured in 10 μl aliquots using a Nitric Oxide Analyzer (Sievers Model 280b, Ionics Instrument Business Group, Boulder, Colorado, USA).
Bacteria and in vitro measurements of pO2.
Using the Licox oxygen probe, pO2 was measured at 37°C in suspensions of PAO1 grown aerobically in TSB (Oxoid Ltd.). The pO2 was also measured in heat-inactivated washed bacterial cultures at 108 CFU/ml.
Statistics.
Unless otherwise stated, all data are presented as mean ± SEM. ANOVA (followed by the Tukey test) was used as appropriate. In the case of nonhomogeneity of variance, ANOVA followed by either Dunn’s multiple comparison test, the Mann-Whitney U test, or the Wilcoxon signed rank test were used.
Results
P. aeruginosa is intraluminally located in CF airways.
Analyses of CF lungs revealed evidence for growth of P. aeruginosa predominantly as spherical intraluminal colonies (Figure 1) (14). We have elected to refer to these spherical colonies as “macrocolonies,” because many are visible (>100 μm in diameter) to the naked eye. We used three separate techniques to test whether macrocolonies were localized to intraluminal mucus/mucopurulent material versus epithelial cell surfaces in CF lungs. First, immunolocalization in thin sections from nine different CF lungs revealed most bacteria (94.5%) were localized within the airway lumen 5–17 μm distant from the epithelial cell surface and the remainder in the zone 2–5 μm from the epithelial surface (Figure 1c). None were identified in contact with epithelial cells. Second, no P. aeruginosa bacteria were observed attached to airway epithelia in TEMs of bronchi from nine CF patients, containing a total length of 300 mm of bronchial surfaces. Third, scanning electron microscopy detected no bacteria on bronchial epithelia from two patients (total surface area examined: 116.1 mm2).
Figure 1.

P. aeruginosa is localized in intraluminal material of freshly excised CF airways and binds to mucus. (a) Thin section of an obstructed CF bronchus, stained with hematoxalin/eosin. Note the absence of P. aeruginosa on epithelial surface (black arrow) and presence of P. aeruginosa macrocolonies within intraluminal material (white arrows). Blue gap is an artifact due to fixation. (b) P. aeruginosa within macrocolonies in a lung section, stained with rabbit Ab’s against P. aeruginosa. Bars: a, 100 μm; b, 10 μm. (c) Percentage of bacteria detected at a distance of 2-5 μm or 5-17 μm from the epithelial surface of lungs from nine CF patients. Shrinkage artifacts were subtracted from calculated distances. (d) Scanning electron micrograph of mucus-coated spheroid derived from CF respiratory epithelium. P. aeruginosa (white arrow) were enmeshed in mucus (black arrows) following a 2-hour incubation. (e) Immunofluorescent staining of mucins (anti-mucin Ab) bound to P. aeruginosa strain PAO1 in vitro. (f) Spheroid with adherent mucus removed by prewash, then incubated with P. aeruginosa for 2 hours. Note the absence of bacteria on ciliated epithelial cell surfaces. Bars: d, 0.6 μm; e, 4 μm; f, 2.5 μm. Quantitative comparisons of PAO1 binding revealed higher binding to mucus-coated NESfrom normal subjects (21.3 ± 10.6 bacteria/NES) versus non-mucus-coated (washed) NES (7.1 ± 0.1 bacteria/NES) (n = 6; 3 normal subjects; P < 0.05). Importantly, these values were not different for CF NESs (26.4 ± 4.1 bacteria/NES for mucus-coated NESs; 7.7 ± 3.9 bacteria/NES for washed NESs).
P. aeruginosa binding to mucus versus airway epithelial cell membranes in vitro.
We also tested the hypothesis that P. aeruginosa binds to mucus rather than airway epithelial cells in vitro. Nasal epithelial spheroids (NESs) spontaneously produce mucin, a fraction of which adheres to ciliated cells (9). Incubation of P. aeruginosa PAO1 with NESs revealed that the bacteria were enveloped by the mucus attached to NESs (Figure 1d). Mucin binding was also demonstrated by incubating P. aeruginosa with mucins secreted by NESs (Figure 1e). In contrast, washing NESs to remove adherent mucins greatly reduced P. aeruginosa binding (Figure 1f).
O2 is depleted within Pseudomonas-infected intraluminal mucopurulent masses in vivo.
The pO2 in CF mucopurulent masses in vivo was measured by inserting an O2 electrode directly into the right upper lobar bronchi of chronically infected CF patients (Figure 2a). When the probe was in the bronchial lumen, the pO2 reached approximately 180 mmHg, a value consistent with the supplemental O2 administered during bronchoscopy. Upon probe insertion into the mucopurulent material obstructing the lobar bronchus, the pO2 declined rapidly to a mean value of 2.5 mmHg (Figure 2b).
Figure 2.

Oxygen partial pressure (pO2) CF airways in vivo and in thick films of ASL on human airway epithelial cultures. (a) pO2 in CF airways. First 30 minutes represents measurement in a nonobstructed region of the airway lumen. The arrow indicates insertion of oxygen probe into a mucopurulent mass. The pO2 returned to basal values after probe retraction from the adherent mass into the nonobstructed airway region. (b) pO2 in nonobstructed CF airway lumens (L) and CF mucopurulent masses (M) in vivo. n = 3 CF subjects; *P = 0.001. (c) Plots of pO2 gradients under thick film conditions at 37°C in NL (squares; eight cultures/five subjects) and CF cultures (circles; six cultures/four subjects). (d) pO2 gradients under thick film conditions measured at 4°C in NL (squares; five cultures/three subjects) and CF cultures (circles; five cultures/three subjects). (e) pO2 gradients in CF mucus that had accumulated for 48 hours on CF culture surfaces and had become stationary due to volume hyperabsorption (inverted triangles). Mucus transport was restored in these cultures by addition of 30 μl PBS, and pO2 gradients remeasured 1–2 hours later (triangles; six cultures; three subjects each). (f) Comparison of pO2 gradients in NL (squares; nine cultures/six subjects) and PCD (diamonds; five cultures/two subjects) cultures under thick film conditions. Data are shown as mean ± SEM. *Significantly different (P < 0.05) from pO2 at the air-liquid interface (0 μm). †Significant difference (P < 0.05) between NL and CF.
In vitro analyses of the genesis of O2 gradients in uninfected ASLs.
The diffusion of O2 through liquids is slow compared with air (15) so that the hypoxia measured within the mucopurulent luminal masses could reflect, in part, restricted O2 diffusion through thickened intraluminal liquids. Although bacteria or neutrophils likely consume O2 and contribute to the low pO2 measured in mucopurulent lumenal masses in vivo (see below), it is possible that the O2 consumption of the underlying CF epithelium uniquely contributes to mucus O2 gradients before infection.
To test the hypothesis that airway epithelial O2 consumption generates O2 gradients in liquid films that mimic in height mucus accumulated on CF airway surfaces (16), we measured O2 gradients in NL and CF airway epithelia covered by an approximately 800-μm thick ASL (PBS). NL airway epithelia generated measurable O2 gradients at 37°C in this layer (Figure 2c). However, the pO2 gradient was significantly steeper in CF cultures (Figure 2c). Both NL and CF ASL O2 gradients were abolished at 4°C, suggesting that the gradients indeed reflected epithelial O2 consumption (Figure 2d).
Next, we asked whether the presence of mucins within ASL and mucus transport were important determinants of O2 gradients under these thick film conditions. No differences in O2 gradients were observed in CF cultures with or without rotational mucus transport (Figure 2e). Thus, we conclude that neither the presence of mucus, nor mixing, which occurs as a consequence of mucus transport in situ (17), are important contributors to O2 gradients measured within ASL. Rather, the gradient reflects ASL depth and rate of epithelial O2 consumption.
Do CF airway epithelia generate disease-specific steeper O2 gradients within ASL?
We measured the O2 gradients in cultures derived from patients with primary ciliary dyskinesia (PCD), a genetic disease of ciliary motility characterized by chronic airways infection (18). The pO2 gradients in PCD ASL resembled that of normal cultures and were shallower than CF ASL gradients (compare Figure 2, f and c). Thus, it appears that the ability to generate steep O2 gradients within ASL reflected a unique feature of CF airway epithelia.
Will bacteria deposited on mucus surfaces penetrate to hypoxic zones in mucus layers?
If bacteria contained within inhaled droplet aerosols deposit and remain on the surface of the mucus layer, then bacteria would be persistently exposed to normoxic environments. Conversely, if inhaled bacteria move (“swim”) into the mucus layer, they may face low pO2. Two sets of experiments were designed to distinguish between these possibilities.
First, we examined the behavior of bacteria contained in small volumes (25 nl), designed to mimic aerosol droplets, deposited on the surface of CF airway epithelial cultures that exhibited rotational mucus transport. At the earliest time point measurable (3 minutes), motile P. aeruginosa penetrated into the mucus layer (Figure 3a). We next asked whether bacterial penetration into mucus reflected bacterial motility or mucus mixing in the vertical axis during rotational surface (horizontal) mucus transport (17). Fluorescently labeled beads deposited on the airway surface exhibited similar kinetics of penetration into the mucus layer, suggesting turbulent flow within the mucus layer accounted for penetration to hypoxic zones (Figure 3b).
Figure 3.
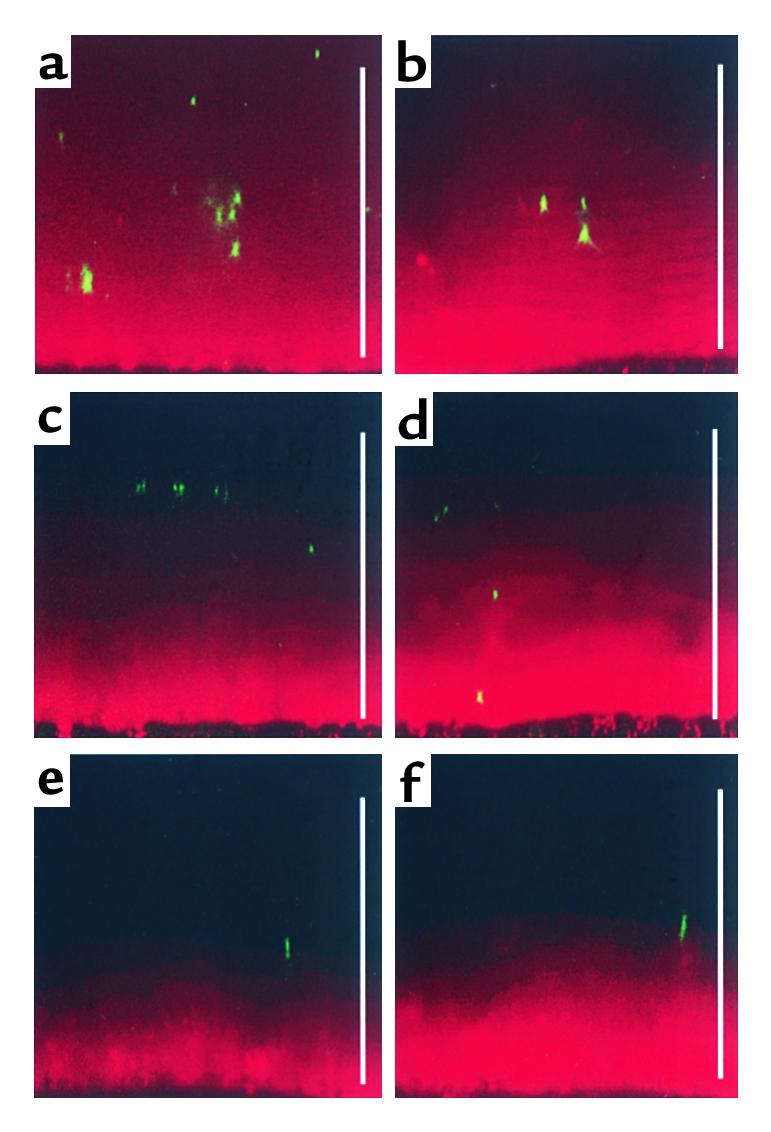
Localization of P. aeruginosa and beads in transported and stationary ASL (mucus) produced by planar CF cultures. Representative confocal images of ASL (red) fluorescent P. aeruginosa (green) or green fluorescent beads. P. aeruginosa or beads were added to the air-liquid interface in 25-nl aliquots by a microsyringe mounted in a hydraulic micromanipulator. (a) X-Z confocal image of P. aeruginosa 3 minutes after addition to the surface of ASL (mucus) exhibiting rotational transport. (b) X-Z confocal image of beads 3 minutes after addition to the surface of mucus exhibiting rotational transport. Note that due to the rapid “tumbling” movement of the mucus it was not possible to obtain early time-point images of P. aeruginosa or beads at the air-liquid interface. P. aeruginosa 3 minutes (c) and 15 minutes (d) after addition to stationary mucus. Beads at 3 minutes (e) and 15 minutes later (f) after addition to stationary mucus. Scale bars, 100 μm.
Second, we tested whether motile P. aeruginosa could penetrate mucus masses adherent to CF airway surfaces. Within 15 minutes, P. aeruginosa had penetrated deep into the mucus (compare Figure 3, c with d). In contrast, fluorescent beads remained on the surface of the mucus plaque (compare Figure 3, e with f), suggesting that bacterial motility was required for P. aeruginosa penetration into hypoxic zones within stationary mucus masses.
Response of P. aeruginosa to a hypoxic environment.
P. aeruginosa is an aerobic bacterium that will grow under anaerobic conditions if sufficient terminal electron acceptors are provided (19–21). Because it is not yet known what bacterial culture media best mimics human ASL (mucus), we tested for Pseudomonas growth under aerobic versus anaerobic conditions, using ASL harvested from CF and NL cultures. P. aeruginosa grew equally well in aerobic and anaerobic conditions (Figure 4a).
Figure 4.

Growth and alginate production of P. aeruginosa under aerobic versus anaerobic conditions. (a) Growth of P. aeruginosa in NL or CF ASL under aerobic or anaerobic conditions. Two strains, PAO1 (black bars) and ATCC 700829 (gray bars), were inoculated (∼100–200 bacteria, dashed line) in 30 μl NL or CF ASL and number of bacteria quantitated 72 hours later. The results presented are from a single representative experiment of three performed. The differences in the CFU/ml in the three experiments were less than 0.3 log 10. (b) Immunofluorescence detection of alginate production by PAO1 after aerobic (8 hours; left) or anaerobic (12 hours; right) conditions (magnification, ×1,000; bars, 10 μm). (c) Alginate production of PAO1 by the carbazole assay after growth under anaerobic (black bar) or aerobic (white bar) conditions for 4 days without added nitrate. *P < 0.05. (d) Alginate production per microgram bacterial protein mass of PAO1 as a function of the added NO3– to PIA under aerobic (white bars) and anaerobic (black bars) conditions. (e) pO2 (filled squares) in an aerobically growing suspension of P. aeruginosa (open triangles) as a function of time (hours). (f) Mathematical analysis of depths from air-mucus interface at which pO2 becomes zero for simulated mucus masses/plaques containing different concentrations of P. aeruginosa bacteria (colony-forming units per milliliter).
To test whether growth of Pseudomonas under anaerobic conditions in ASL was supported by NO3– as a terminal electron acceptor, total nitrate concentration was measured and found to be not different in uninfected ASL from NL (20 μM) and CF (26 μM) cultures. These ASL total nitrate concentration values are substantially lower than those reported for airway secretions collected in vivo. For example, tracheal secretions from control subjects have been reported to contain 144–421 μM total nitrate (22, 23). The higher levels from tracheal secretions could reflect the fact that upper airways produce more NO than the lower airway regions (24, 25) that are representative in our cultures (third to sixth generation bronchi). Importantly, as we found in ASL from NL and CF cultures, no differences in tracheal secretion total nitrate concentrations were found between “stable” CF patients (range 387–421 μM) and controls (22, 23).
We next asked whether the stress of anaerobic environments could induce P. aeruginosa to acquire phenotypic features that allows it to evade host defenses. Therefore, we measured P. aeruginosa production of alginate, an exopolysaccharide involved in P. aeruginosa biofilm formation, under anaerobic versus aerobic conditions on agar plates (Columbia sheep blood agar, 37 μM total nitrate concentration, and PIA, 63 μM total nitrate concentration) that contained total nitrates in concentrations similar to that in ASL. Both immunofluorescence detection of alginate associated with the bacterial surface (Figure 4b; note thicker alginate coat in right panel) and quantitative measurement of alginate/bacterial protein mass (Figure 4c) demonstrated increased alginate production when PAO1 was grown under anaerobic conditions. A thicker alginate coat (∼50%) was also observed for PAO1 grown in ASL under anaerobic versus aerobic conditions.
To test whether the behavior of PAO1 mimicked that of environmental strains that may infect CF mucus early in the course of the disease, alginate production by 15 nonmucoid P. aeruginosa environmental strains, genetically different by pulsed field gel electrophoretic analysis, was compared during growth in aerobic versus anaerobic environments. These strains routinely produced more alginate under anaerobic (0.191 ± 0.037 μg alginate per microgram of bacterial protein) versus aerobic (0.022 ± 0.004 μg alginate per microgram of bacterial protein) growth conditions.
We next tested whether alginate production could, in part, reflect “stress” of an anaerobic environment with limiting concentrations of [NO3–] as a terminal electron acceptor. As shown in Figure 4d, the ratio of alginate to bacterial protein mass was highest at lower nitrate concentrations, including the 63 μM nitrate value of PIA (no added nitrate) that is most similar to values in ASL.
Finally, we asked whether the introduction of bacteria as O2-consuming elements into mucus contributed to the magnitude of the O2 gradients observed in vivo (Figure 2). O2 tensions were reduced when P. aeruginosa growing in an open glass tube reached densities of approximately 5 × 10⁶ to 5 × 10⁷ CFU/ml (Figure 4e). At approximately 3 × 10⁷ CFU/ml, virtually all O2 was consumed. Modeling of bacterial O2 consumption (Figure 4f) showed that anaerobic conditions are generated at very shallow depths (∼3 μm) in infected mucus masses when bacterial counts exceed 106 CFU/ml. Thus, the cell-specific O2 gradients within uninfected mucus accumulating on the CF airway epithelial surfaces will be exacerbated by the introduction of P. aeruginosa into mucus.
Discussion
Our studies initially focused on the pathogenesis of established CF airways infection and, taking clues from these studies, explored whether these variables could uniquely contribute to the early pathogenesis of P. aeruginosa infection in CF airways.
Morphometric analyses of freshly excised lungs by three techniques demonstrated that P. aeruginosa grows as macrocolonies in the airway intraluminal rather than the epithelial surface compartment (Figure 1, a–c). These findings contradict recent hypotheses emanating from in vitro model systems that focus on high-salt/defensin inactivation (26) or luminal epithelial cell binding (4), which predict bacterial infection of CF airway epithelial cells themselves (5, 6). However, our data are consistent with those from animal models that have demonstrated the adherence of P. aeruginosa to respiratory mucus (27–29), and three previous qualitative studies of CF postmortem lungs that identified P. aeruginosa in airway lumens rather than on airway epithelial cells (30–32). Furthermore, they are also consistent with our studies of NSEs that revealed P. aeruginosa preferentially bound to mucus rather than epithelial cell surfaces (Figure 1, d–f). A key extension of the in vivo characterization of CF airways infection is that P. aeruginosa occupies an intraluminal niche that is markedly hypoxic (Figure 2, a–b).
If the CF airways disease reflects infection of mucus, how is this process initiated and perpetuated? A sequence consistent with several aspects of the “low volume/reduced mucus clearance” hypothesis (10, 33) for CF pathogenesis is outlined in Figure 5. First, as compared with NL airway epithelial function (compare Figure 5a), data have been reported that CF airway epithelia excessively absorb Na+ and Cl– (and water) from the lumen, deplete the periciliary liquid layer (PCL), and slow/abolish mucus clearance (Figure 5b) (10, 34, 35). Accelerated Na+ absorption, which reflects the absence of CFTR’s normal inhibitory activity on ENaC (36), is fueled by an increased turnover rate of ATP-consuming Na+-K+-ATPase pumps (37, 38) leading to two- to threefold increases in CF airway epithelial O2 consumption (39).
Figure 5.
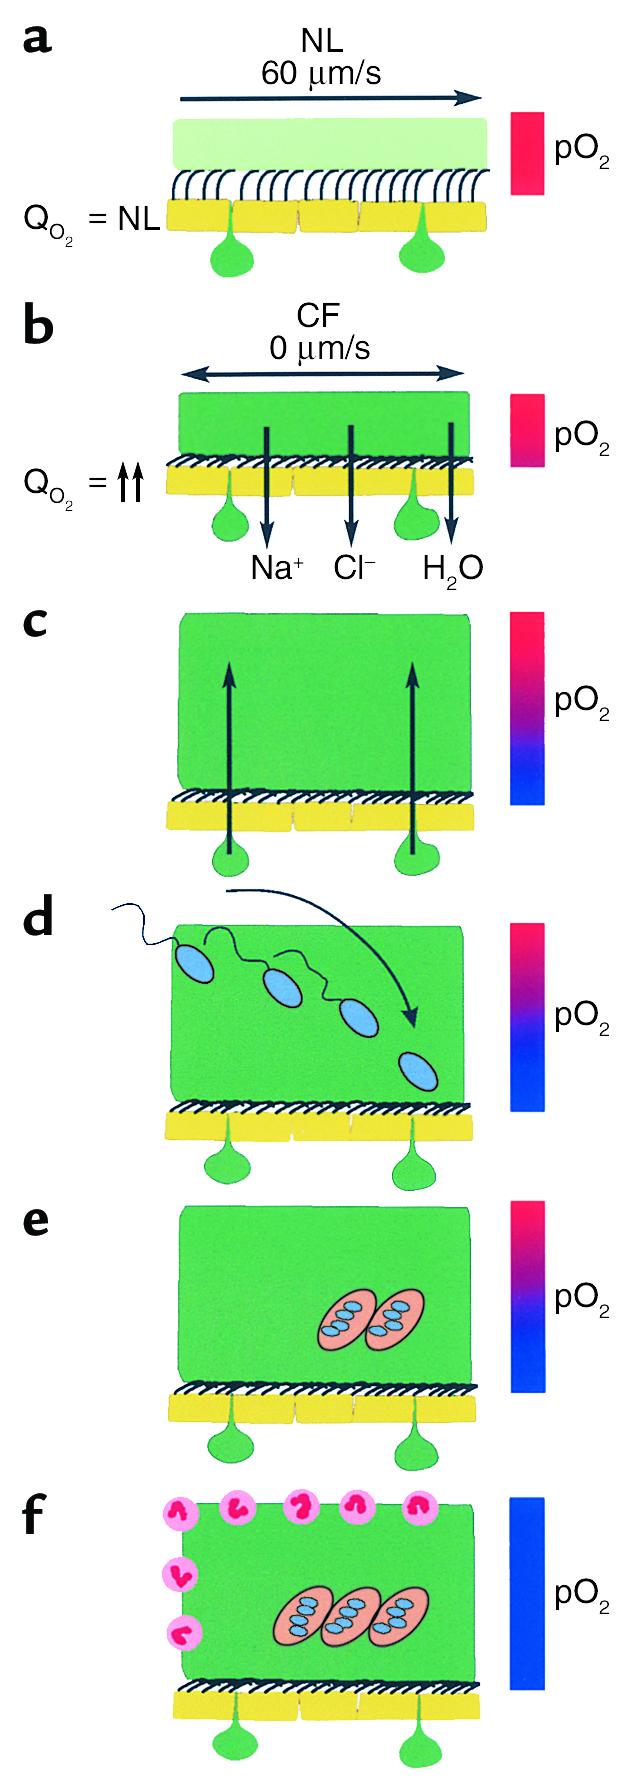
Schematic model of the pathogenic events hypothesized to lead to chronic P. aeruginosa infection in airways of CF patients. (a) On normal airway epithelia, a thin mucus layer (light green) resides atop the PCL (clear). The presence of the low-viscosity PCL facilitates efficient mucociliary clearance (denoted by vector). A normal rate of epithelial O2 consumption (QO2; left) produces no O2 gradients within this thin ASL (denoted by red bar). (b–f) CF airway epithelia. (b) Excessive CF volume depletion (denoted by vertical arrows) removes the PCL, mucus becomes adherent to epithelial surfaces, and mucus transport slows/stops (bidirectional vector). The raised O2 consumption (left) associated with accelerated CF ion transport does not generate gradients in thin films of ASL. (c) Persistent mucus hypersecretion (denoted as mucus secretory gland/goblet cell units; dark green) with time increases the height of luminal mucus masses/plugs. The raised CF epithelial QO2 generates steep hypoxic gradients (blue color in bar) in thickened mucus masses. (d) P. aeruginosa bacteria deposited on mucus surfaces penetrate actively and/or passively (due to mucus turbulence) into hypoxic zones within the mucus masses. (e) P. aeruginosa adapts to hypoxic niches within mucus masses with increased alginate formation and the creation of macrocolonies. (f) Macrocolonies resist secondary defenses, including neutrophils, setting the stage for chronic infection. The presence of increased macrocolony density and, to a lesser extent neutrophils, render the now mucopurulent mass hypoxic (blue bar).
Second, persistent mucin secretion into stationary mucus generates plaques/plugs (16) (Figure 5c). The combination of thickened mucus and raised O2 consumption by CF epithelia generated steep O2 gradients within adherent mucus (Figure 2c). Importantly, the steep pO2 gradient in ASL/mucus was specific for CF epithelia because it was not reproduced in cultures from another genetic airways disease with an infectious phenotype, PCD (Figure 2f).
Third, bacteria deposited on thickened mucus can penetrate into hypoxic zones (Figure 5d). When the normal rotational mucus transport ceased due to excessive volume absorption, the vertical “currents” within transported mucus were abolished, but motile P. aeruginosa still penetrated thickened mucus (Figure 3, c and d). Note that environmental P. aeruginosa strains such as those that characterize early infection are motile and would likely penetrate mucus readily.
Fourth, P. aeruginosa can grow in hypoxic/anaerobic CF mucus (Figure 4a). In part, growth under anaerobic conditions may be supported by the terminal electron acceptor, nitrate (∼20 μM), contained in ASL. Furthermore, we show that increased alginate production was a characteristic feature of PAO1 strains in response to hypoxia, particularly with growth in low concentrations of nitrate that mimic ASL (Figure 4, b–d), and this characteristic is also a feature of environmental P. aeruginosa strains. We speculate that the increased alginate formation may represent a stress response to hypoxia that is part of the process that forms biofilmlike macrocolonies, the predominant phenotype of P. aeruginosa in CF airways (3). Interestingly, Staphylococcus aureus also responds to the hypoxic environment of CF mucus with a switch from nonmucoid to a mucoid phenotype (40, 41).
Finally, the capacity of P. aeruginosa to proliferate in hypoxic mucus will generate fully hypoxic (anaerobic) conditions in patients with persistent CF airways infection (Figure 1, Figure 4, e and f, and Figure 5e). Hassett et al. reported that P. aeruginosa alginate production was maintained by anaerobic conditions (21). The reduced O2 tension in the mucopurulent intraluminal contents of CF airways may, therefore, be one variable contributing to the persistence of P. aeruginosa macrocolonies in CF airways. The consequences of the macrocolony growth state have been explored in detail and include resistance to antibiotics (42) and host phagocyte killing (Figure 5f) and (42, 43), all of which contribute to the persistence of P. aeruginosa infection and the chronic destructive airways disease characteristics of CF.
In summary, our data demonstrate that the P. aeruginosa infection of CF airways occurs within the luminal (mucus) rather than the epithelial cell surface compartment. Thus, we speculate that mucus clearance is a key feature of innate lung defense (44), and a fundamental defect leading to chronic CF lung infections is the failure to effectively clear mucus that contains bound bacteria from the lung (10). Hypoxic gradients exist within poorly cleared/adherent mucus, consequent to CF-specific increases in epithelial O2 consumption, and inhaled P. aeruginosa respond to hypoxic mucus with alginate production and macrocolony formation, which allows them to evade host defenses and produce a chronic destructive lung disease. These data lead us to conclude that therapeutic strategies to treat CF lung disease should include novel drugs designed to clear the lung of retained mucus plaques/plugs, which initiate and perpetuate CF lung disease, and antibiotics that effectively treat P. aeruginosa growing under hypoxic/anaerobic conditions.
Acknowledgments
The authors would like to thank Carol Basbaum for a gift of an mAb against human tracheobronchial mucins, Gerald Pier for a gift of rabbit antiserum specific for P. aeruginosa alginate, Hans-Peter Zenner and Gerd Münker for nasal polyp material, Heinz Schwarz for TEM, and Diana Walstad, Kim Burns, and Tracy Bartolotta for technical assistance. We also thank Marie Becker for harvesting ASL and Milan Hazucha for nitrate measurements. This study was partially supported by Förderverein für mukoviszidosekranke Kinder, Jugendliche und Erwachsene der Region Ulm e.V., Deutsche Gesellschaft zur Bekämpfung der Mukovisziodse e.V., and the CF-Selbsthilfe Duisburg e.V., Germany.
Footnotes
Dieter Worlitzsch, Robert Tarran, and Martina Ulrich contributed equally to this work.
Richard C. Boucher and Gerd Döring contributed equally to this work as senior authors.
References
- 1.Davis PB, Drumm M, Konstan MW. Cystic fibrosis. Am J Respir Crit Care Med. 1996;154:1229–1256. doi: 10.1164/ajrccm.154.5.8912731. [DOI] [PubMed] [Google Scholar]
- 2.Meyer KC, Zimmerman J. Neutrophil mediators, Pseudomonas, and pulmonary dysfunction in cystic fibrosis. J Lab Clin Med. 1993;121:654–661. [PubMed] [Google Scholar]
- 3.Doering, G., Knight, R., and Bellon, G. 2000. Immunology of cystic fibrosis. In Cystic fibrosis. M.E. Hodson and D.M. Geddes, editors. Arnold Publishers. London, United Kingdom. 109–140.
- 4.Saiman L, Prince A. Pseudomonas aeruginosapili bind to asialoGM1 which is increased on the surface of cystic fibrosis epithelial cells. J Clin Invest. 1993;92:1875–1880. doi: 10.1172/JCI116779. [DOI] [PMC free article] [PubMed] [Google Scholar]
- 5.de Bentzmann S, Plotkowski C, Puchelle E. Receptors in the Pseudomonas aeruginosaadherence to injured and repairing airway epithelium. Am J Respir Crit Care Med. 1996;154:S155–S162. doi: 10.1164/ajrccm/154.4_Pt_2.S155. [DOI] [PubMed] [Google Scholar]
- 6.Pier GB, et al. Role of mutant CFTR in hypersusceptibility of cystic fibrosis patients to lung infections. Science. 1996;271:64–67. doi: 10.1126/science.271.5245.64. [DOI] [PMC free article] [PubMed] [Google Scholar]
- 7.Welsh MJ, Smith AE. Cystic fibrosis. Sci Am. 1995;273:52–59. doi: 10.1038/scientificamerican1295-52. [DOI] [PubMed] [Google Scholar]
- 8.Holloway BW, Krishnapillai V, Morgan AF. Chromosomal genetics of Pseudomonas. Microbiol Rev. 1979;43:73–102. doi: 10.1128/mr.43.1.73-102.1979. [DOI] [PMC free article] [PubMed] [Google Scholar]
- 9.Ulrich M, et al. Localization of Staphylococcus aureus in infected airways of patients with cystic fibrosis and in a cell culture model of S. aureusadherence. Am J Respir Cell Mol Biol. 1998;19:83–91. doi: 10.1165/ajrcmb.19.1.3137. [DOI] [PubMed] [Google Scholar]
- 10.Matsui H, et al. Evidence for periciliary liquid layer depletion, not abnormal ion composition, in the pathogenesis of cystic fibrosis airways disease. Cell. 1998;95:1005–1015. doi: 10.1016/s0092-8674(00)81724-9. [DOI] [PubMed] [Google Scholar]
- 11.Tarran R, Grubb BR, Gatzy JT, Davis CW, Boucher RC. The relative roles of passive surface forces and active ion transport in the modulation of airway surface liquid volume and composition. J Gen Physiol. 2001;118:223–236. doi: 10.1085/jgp.118.2.223. [DOI] [PMC free article] [PubMed] [Google Scholar]
- 12.Tarran, R., and Boucher, R.C. 2002. Thin-film measurements of airway surface liquid volume/composition and mucus transport rates in vitro. In Cystic fibrosis methods and protocols. W.R. Skach, editor. Humana Press. Totowa, New Jersey, USA. In press. [DOI] [PubMed]
- 13.May TB, Chakrabarty AM. Isolation and assay of Pseudomonas aeruginosaalginate. Methods Enzymol. 1994;235:295–304. doi: 10.1016/0076-6879(94)35148-1. [DOI] [PubMed] [Google Scholar]
- 14.Lam J, Chan R, Lam K, Costerton JW. Production of mucoid microcolonies by Pseudomonas aeruginosawithin infected lungs in cystic fibrosis. Infect Immun. 1980;28:546–556. doi: 10.1128/iai.28.2.546-556.1980. [DOI] [PMC free article] [PubMed] [Google Scholar]
- 15.Logan, S.R. 1998. Physical chemistry for the biomedical sciences. Taylor & Francis. London, United Kingdom. 251 pp.
- 16.Zuelzer WW, Newton WA., Jr The pathogenesis of fibrocystic disease of the pancreas. A study of 36 cases with special reference to the pulmonary lesions. Pediatrics. 1949;4:53–69. [PubMed] [Google Scholar]
- 17.Matsui H, Randell SH, Peretti SW, Davis CW, Boucher RC. Coordinated clearance of periciliary liquid and mucus from airway surfaces. J Clin Invest. 1998;102:1125–1131. doi: 10.1172/JCI2687. [DOI] [PMC free article] [PubMed] [Google Scholar]
- 18.Schidlow DV. Primary ciliary dyskinesia (the immotile cilia syndrome) Ann Allergy. 1994;73:457–468. doi: 10.1016/b978-0-323-01909-5.50015-3. [DOI] [PubMed] [Google Scholar]
- 19.Bazylinski DA, Soohoo CK, Hollocher TC. Growth of Pseudomonas aeruginosaon nitrous oxide. Appl Environ Microbiol. 1986;51:1239–1246. doi: 10.1128/aem.51.6.1239-1246.1986. [DOI] [PMC free article] [PubMed] [Google Scholar]
- 20.Carlson CA, Ingraham JL. Comparison of denitrification by Pseudomonas stutzeri, Pseudomonas aeruginosa, and Paracoccus denitrificans. Appl Environ Microbiol. 1983;45:1247–1253. doi: 10.1128/aem.45.4.1247-1253.1983. [DOI] [PMC free article] [PubMed] [Google Scholar]
- 21.Hassett DJ. Anaerobic production of alginate by Pseudomonas aeruginosa: alginate restricts diffusion of oxygen. J Bacteriol. 1996;178:7322–7325. doi: 10.1128/jb.178.24.7322-7325.1996. [DOI] [PMC free article] [PubMed] [Google Scholar]
- 22.Linnane SJ, et al. Total sputum nitrate plus nitrite is raised during acute pulmonary infection in cystic fibrosis. Am J Respir Crit Care Med. 1998;158:207–212. doi: 10.1164/ajrccm.158.1.9707096. [DOI] [PubMed] [Google Scholar]
- 23.Grasemann H, et al. Nitric oxide metabolites in cystic fibrosis lung disease. Arch Dis Child. 1998;78:49–53. doi: 10.1136/adc.78.1.49. [DOI] [PMC free article] [PubMed] [Google Scholar]
- 24.Kimberly B, Nejadnik B, Giraud GD, Holden WE. Nasal contribution to exhaled nitric oxide at rest and during breathholding in humans. Am J Respir Crit Care Med. 1996;153:829–836. doi: 10.1164/ajrccm.153.2.8564139. [DOI] [PubMed] [Google Scholar]
- 25.Lundberg JON, et al. Primarily nasal origin of exhaled nitric oxide and absence in Kartagener’s syndrome. Eur Respir J. 1994;7:1501–1504. doi: 10.1183/09031936.94.07081501. [DOI] [PubMed] [Google Scholar]
- 26.Smith JJ, Travis SM, Greenberg EP, Welsh MJ. Cystic fibrosis airway epithelia fail to kill bacteria because of abnormal airway surface fluid. Cell. 1996;85:229–236. doi: 10.1016/s0092-8674(00)81099-5. [DOI] [PubMed] [Google Scholar]
- 27.Marcus H, Baker NR. Quantitation of adherence of mucoid and nonmucoid Pseudomonas aeruginosato hamster tracheal epithelium. Infect Immun. 1985;47:723–729. doi: 10.1128/iai.47.3.723-729.1985. [DOI] [PMC free article] [PubMed] [Google Scholar]
- 28.Niederman MS, et al. Comparison of bacterial adherence to ciliated and squamous epithelial cells obtained from the human respiratory tract. Am Rev Respir Dis. 1983;127:85–90. doi: 10.1164/arrd.1983.127.1.85. [DOI] [PubMed] [Google Scholar]
- 29.Ramphal R, Pyle M. Evidence for mucins and sialic acid as receptors for Pseudomonas aeruginosain the lower respiratory tract. Infect Immun. 1983;41:339–344. doi: 10.1128/iai.41.1.339-344.1983. [DOI] [PMC free article] [PubMed] [Google Scholar]
- 30.Jeffery PK, Brain AP. Surface morphology of human airway mucosa: normal, carcinoma, or cystic fibrosis. Scanning Microsc. 1988;2:553–560. [PubMed] [Google Scholar]
- 31.Simel DL, et al. Scanning electron microscopic study of the airways in normal children and in patients with cystic fibrosis and other lung diseases. Pediatr Pathol. 1984;2:47–64. doi: 10.3109/15513818409041187. [DOI] [PubMed] [Google Scholar]
- 32.Baltimore RS, Christie CD, Smith GJ. Immunohistopathologic localization of Pseudomonas aeruginosain lungs from patients with cystic fibrosis. Implications for the pathogenesis of progressive lung deterioration. Am Rev Respir Dis. 1989;140:1650–1661. doi: 10.1164/ajrccm/140.6.1650. [DOI] [PubMed] [Google Scholar]
- 33.Tarran R, et al. The CF salt controversy: in vivo observations and therapeutic approaches. Mol Cell. 2001;8:149–158. doi: 10.1016/s1097-2765(01)00286-6. [DOI] [PubMed] [Google Scholar]
- 34.Boucher RC, Stutts MJ, Knowles MR, Cantley L, Gatzy JT. Na+transport in cystic fibrosis respiratory epithelia. Abnormal basal rate and response to adenylate cyclase activation. J Clin Invest. 1986;78:1245–1252. doi: 10.1172/JCI112708. [DOI] [PMC free article] [PubMed] [Google Scholar]
- 35.Jiang C, Finkbeiner WE, Widdicombe JH, McCray PB, Jr, Miller SS. Altered fluid transport across airway epithelium in cystic fibrosis. Science. 1993;262:424–427. doi: 10.1126/science.8211164. [DOI] [PubMed] [Google Scholar]
- 36.Stutts MJ, et al. CFTR as a cAMP-dependent regulator of sodium channels. Science. 1995;269:847–850. doi: 10.1126/science.7543698. [DOI] [PubMed] [Google Scholar]
- 37.Stutts MJ, Knowles MR, Gatzy JT, Boucher RC. Oxygen consumption and ouabain binding sites in cystic fibrosis nasal epithelium. Pediatr Res. 1986;20:1316–1320. doi: 10.1203/00006450-198612000-00026. [DOI] [PubMed] [Google Scholar]
- 38.Peckham D, Holland E, Range S, Knox AJ. Na+/K+ATPase in lower airway epithelium from cystic fibrosis and non-cystic-fibrosis lung. Biochem Biophys Res Commun. 1997;232:464–468. doi: 10.1006/bbrc.1997.6200. [DOI] [PubMed] [Google Scholar]
- 39.Stutts MJ, Knowles MR, Gatzy JT, Boucher RC. Oxygen consumption (QO2) and ouabain binding in cystic fibrosis (CF) and normal nasal epithelium. Fed Proc. 1985;44:640. doi: 10.1203/00006450-198612000-00026. (Abstr.) [DOI] [PubMed] [Google Scholar]
- 40.Cramton SE, Ulrich M, Gotz F, Doring G. Anaerobic conditions induce expression of polysaccharide intercellular adhesin in Staphylococcus aureus and Staphylococcus epidermidis. Infect Immun. 2001;69:4079–4085. doi: 10.1128/IAI.69.6.4079-4085.2001. [DOI] [PMC free article] [PubMed] [Google Scholar]
- 41.McKenney D, et al. Broadly protective vaccine for Staphylococcus aureus based on an in vivo-expressed antigen. Science. 1999;284:1523–1527. doi: 10.1126/science.284.5419.1523. [DOI] [PubMed] [Google Scholar]
- 42.Park MK, Myers RA, Marzella L. Oxygen tensions and infections: modulation of microbial growth, activity of antimicrobial agents, and immunologic responses. Clin Infect Dis. 1992;14:720–740. doi: 10.1093/clinids/14.3.720. [DOI] [PubMed] [Google Scholar]
- 43.Hohn DC, MacKay RD, Halliday B, Hunt TK. Effect of O2tension on microbicidal function of leukocytes in wounds and in vitro. Surg Forum. 1976;27:18–20. [PubMed] [Google Scholar]
- 44.Knowles, M.R., and Boucher, R.C. 2002. Mucus clearance as a primary innate defense mechanism for mammalian airways. J. Clin. Invest. In press. [DOI] [PMC free article] [PubMed]