

Abstract
Localized 13C NMR spectroscopy provides a new investigative tool for studying cerebral metabolism. The application of 13C NMR spectroscopy to living intact humans and animals presents the investigator with a number of unique challenges. This review provides in the first part a tutorial insight into the ingredients required for achieving a successful implementation of localized 13C NMR spectroscopy. The difficulties in establishing 13C NMR are the need for decoupling of the one-bond 13C–1H heteronuclear J coupling, the large chemical shift range, the low sensitivity and the need for localization of the signals. The methodological consequences of these technical problems are discussed, particularly with respect to (a) RF front-end considerations, (b) localization methods, (c) the low sensitivity, and (d) quantification methods. Lastly, some achievements of in vivo localized 13C NMR spectroscopy of the brain are reviewed, such as: (a) the measurement of brain glutamine synthesis and the feasibility of quantifying glutamatergic action in the brain; (b) the demonstration of significant anaplerotic fluxes in the brain; (c) the demonstration of a highly regulated malate-aspartate shuttle in brain energy metabolism and isotope flux; (d) quantification of neuronal and glial energy metabolism; and (e) brain glycogen metabolism in hypoglycemia in rats and humans. We conclude that the unique and novel insights provided by 13C NMR spectroscopy have opened many new research areas that are likely to improve the understanding of brain carbohydrate metabolism in health and disease.
Keywords: brain glycogen, glucose, neurotransmission, anaplerosis, hypoglycemia, 13C NMR, localization
Abbreviations used: NMR pulse sequence and acronyms; BIR, B1-insensitive rotation; DEPT, distortionless enhancement by polarization transfer; FASTMAP, fast, automatic shimming technique using mapping along projections; INEPT, insensitive nuclei enhanced by polarization transfer; ISIS, image-selected in vivo spectroscopy; SINEPT, simplified insensitive nuclei enhanced by polarization transfer; Abbreviations for metabolic fluxes; CMRglc; cerebral metabolic rate of glucose; VPDH, neuronal Krebs cycle rate; VPC, pyruvate carboxylase flux; Vx, exchange rate between cytosolic amino acids and mitochondrial Krebs cycle intermediates; Vsyn, Gln synthetase flux; VNTapp, apparent rate of glutamate neurotransmission; Abbreviations for metabolites; Asp, aspartate; Glc, glucose; Glc-6-P, glucose-6-phosphate; Gln, glutamine; Glu, glutamate; Glyc, glycogen; Lac, lactate; OAA, oxaloacetate; OG, 2-oxoglutarate; Pyr, pyruvate
INTRODUCTION
Direct detection of 13C label provides a wealth of highly specific information on metabolites and metabolic rates,1–7 such as the measurement of resolved carbon resonances of Glu and Gln in the brain,8,9 and the reliable measurement of tissue glycogen10–18 and tissue glucose content.19–24 Most of these studies have involved the administration of a 13C-enriched precursor. When the enriched 13C label is transferred to molecules in the metabolic pathway, sensitivity can not only be increased, but important information on metabolic pathways can also be obtained. For example, recent studies showed that the information content of 13C NMR spectroscopy can be amplified considerably, such as the resolved observation of GABA labeling in the human brain, as well as the first detection of lactate labeling in normal human brain.8 In addition to its importance in assessing metabolism in intact brain, 13C NMR spectroscopy has become an important and useful tool in assessing compartmentation of metabolism in brain cells using extracts.25,26
In addition to its low sensitivity, 13C NMR spectroscopy is methodologically more challenging than 1H or even 31P NMR spectroscopy. However, 13C NMR provides its own unique insight and advantages over 1H NMR spectroscopy. The uniqueness of 13C NMR stems mainly from its increased chemical shift dispersion, which can, for example, be used in two-dimensional NMR to increase spectral resolution following specific labeling of the protein.27 As shall be elaborated further below, 13C NMR spectroscopy in living tissue provides a unique window on in vivo metabolism as it occurs. In the context of this review, we will consider mainly in vivo 13C NMR spectroscopy of the intact brain, which places specific requirements on the methodology. In contrast, the important research done using 13C NMR spectroscopy of cell cultures and suspensions 28–30 requires methodology that is equivalent to that of in vitro work of body fluids and tissue extracts 31–34 and to some extent isolated organs,35 since these studies are often performed in high-resolution spectrometers with a test-tube-type setup, and usually localization is confined to everything that is detected by the RF coil. Most in vivo 13C NMR spectroscopy studies of intact organs have been performed using the surface coil as the only means to ‘localize’ the signals.6,22,36–40 In contrast to the aforementioned cell culture and suspension studies and related important work, in vivo 13C NMR spectroscopy of intact organs faces a number of problems that make its application more challenging. Complete three-dimensional localization seems necessary in the brain to eliminate the intense triacylglycerol resonances from the scalp and other signals outside the brain, which adds to the challenges of in vivo 13C NMR. Localized 13C NMR spectroscopy thus is a novel investigative modality, the methodological requirements for which are the focus of the first part of this review.
LOCALIZED IN VIVO 13C NMR SPECTROSCOPY OF THE BRAIN. A BRIEF HISTORY IN TIME
Localized in vivo 13C NMR spectroscopy has undergone an impressive development in the past decade. A number of historical developments leading to the metamorphosis of this remarkable metabolic tool can be discerned. The goal of this section is to provide a historical perspective of the achievements of localized 13C NMR spectroscopy. The first application of 13C NMR spectroscopy to a living system was the metabolism of E. coli.28 The first in vivo application of 13C NMR to the head was reported in 198637 and this early paper was admittedly struggling with many technical problems. Most notably were the limitations in localized shimming, which prohibited the separation of the glutamine from the glutamate resonances in vivo. In 1991–1992, it was shown for the first time that sufficient 13C-labeled glucose can be administered to humans to detect resonances from glutamate and glucose.20,41,42 In retrospect, it is clear from the detection of intense lipid signals in these and other early in vivo spectra obtained from the head, that signals from outside the brain were dominant.37,38,42,43 With the introduction of full three-dimensional localization to 13C NMR spectroscopy of the brain,20,44 it rapidly became clear in 1991–1992 that the concentration of mobile lipids is generally too low to be detected in vivo in the normal brain (although this can be done in extracts45). Therefore, the lipid resonances seen in 13C NMR spectra of the head must be attributed to extracerebral fat tissue, such as subcutaneous fat. The use of automated, localized shimming (i.e. in vivo optimization of the main static magnetic field, B0, such that it becomes largely independent of the spatial coordinates46) of all first- and second-order terms using FASTMAP dramatically improved sensitivity by narrowing linewidths in 13C NMR spectra.47 These two methodological advances contributed to the then rather surprising observation that natural abundance signals from brain metabolites such as those from myo-inositol can be detected in vivo44 and the discovery that labeling of glutamine can be detected in the brain in vivo.47,48 The measurement of glutamine and glutamate turnover has been recognized as a window to study cerebral metabolic compartmentation.49–53 A few years later it was demonstrated that the high demands of 1H decoupling are not detrimental for the application of 13C NMR spectroscopy at higher fields54 when using a novel RF coil design (see below for further discussion). At about the same time, it was also shown that three-dimensional localization based on the 1H magnetization can be achieved in the brain in vivo.55 Another, more recent development of in vivo 13C NMR spectroscopy was the demonstration that localized 13C NMR detection of glycogen can be achieved,56 despite the relatively short relaxation times of the glycogen 13C resonances. This advance led to the first non-invasive detection of brain glycogen metabolism in the rat17 and signals from glycogen were recently quantified in the human brain as well,18 thereby opening a whole new field for investigating brain metabolism. These advances in NMR methodology and technology have led to further insights into brain metabolism and placed the 13C NMR method into the neuroscience theater to provide a unique in vivo window on the brain. 13C NMR spectroscopy holds promise to study a number of neuro-chemical events that are otherwise inaccessible by non-invasive means.
RELATIONSHIP TO OTHER NON-INVASIVE MODALITIES. WHAT MAKES IN VIVO 13C NMR UNIQUE
The administration of a tracer, whether stable or radioactive, and the ability to follow its metabolism in the brain provides neuroscientists with tools to study in vivo metabolism non-invasively. When using radiotracers, label in different metabolic pools cannot be distinguished, which has led to the use of non-metabolizable analogs, such as deoxy-glucose.
On the other hand, tracer studies can be performed using stable isotopes. The metabolism of stable isotopes can be followed non-invasively using NMR, although administration of the ‘tracer’ requires a higher isotopic enrichment, for 13C, typically above 50% in the precursor pool. Because NMR spectroscopy can be used to detect label in different molecules and different chemical positions, it offers the attractive possibility of following metabolism of the precursor, labeled at one or more specific positions. For example, glucose can be labeled with 13C at the C1 position and flow of the label into metabolic pools further downstream can be followed non-invasively. Applications are predominantly focused on nuclei where a stable isotope is present at low natural abundance, examples include 2H, 15N, 19F and 13C. The direct detection of the latter shall be dealt with in this review.
The dominant method to measure cerebral glucose consumption is by measuring the activity accumulated in the phosphorylation product of a glucose analog, e.g. the widely used autoradiography of deoxyglucose,57 or the non-invasive fluoro-deoxy-glucose positron emission tomography.58 In deriving the glucose metabolic rate from the uptake of a glucose analog, the kinetics of glucose transport is important and have been assessed in several studies.59–61 In vivo NMR spectroscopy has the capability of providing a direct, localized measurement of brain glucose content non-invasively.20,21,24
Of course, sensitivity for NMR is low compared with some radioactivity-based methods, and the relative sensitivity of 13C NMR is even lower. Nonetheless, despite the sensitivity disadvantage, as shall be discussed in the second half of this review, 13C NMR spectroscopy can provide unique insights into brain metabolism, albeit at a low spatial resolution. Many consider a low sensitivity and thus low spatial resolution a significant disadvantage. However, it is our belief that there are a significant number of biomedical problems/questions that can be uniquely addressed using in vivo 13C NMR spectroscopy.
Ideally, an investigative method applied to biomedical problems is fully developed and ‘mature’. Unfortunately, the development of 13C NMR spectroscopy in vivo has been limited to a handful of sites worldwide8,43,51,62 and largely requires further development, as biomedical problems in general and neurochemical questions in particular develop. When considering these constraints on the application of this method, it is clear that methodological advances are probably required and expected when addressing important biomedical questions with 13C NMR spectroscopy.
TECHNICAL ISSUES. THE CRUX OF IN VIVO 13C NMR SPECTROSCOPY
The application of 13C NMR spectroscopy to the brain in vivo faces some challenges on the technical level that are unique to the 13C nucleus. The reasons for 13C NMR spectroscopy to be such a challenging modality stem mainly from three roots:
low inherent sensitivity and low natural abundance;
exogenous administration of expensive 13C labeled precursors;
technically challenging methodology.
The first reason why 13C NMR spectroscopy is so challenging lies in its relatively low sensitivity compared with two other major nuclei used for in vivo NMR spectroscopy, namely 1H and 31P. Although the inherent sensitivity is comparable to that of, for example, 23Na [gyromagnetic ratio γ(23Na) = 1.05γ (13C)], the problem of relative sensitivity is compounded by the fact that the 13C isotope has a natural abundance on the order of 1%. Hence in many cases, administration of exogenous 13C-enriched precursors is not only mandatory but also desired to obtain metabolic information. The administration of labeled precursors adds to the barrier, making a broad application of this method more difficult compared with 1H or 31P NMR spectroscopy, as it increases the cost and experimental complexity. Even if the problem of low sensitivity can be alleviated somewhat by the administration of 13C-enriched substrate, considerable technical difficulties remain, rooted in the desire to improve the sensitivity. For instance, 1H decoupling and accurate localization of the 13C NMR signals are necessary in vivo. This section deals with the last of the aforementioned three challenges, first by examining the reverberations of the requirement to decouple the spectrum during acquisition, second by discussing the localization requirements, and lastly by reviewing issues related to sensitivity and quantification.
RADIOFREQUENCY. THE LEGACY OF DECOUPLING
Optimization of sensitivity is critical for successful in vivo 13C NMR spectroscopy. To maximize the signal-to-noise ratio and spectral resolution in 13C NMR spectra, 1H decoupling is generally applied during data acquisition, resulting in a simplified spectral pattern. The application of rather intense RF power during acquisition requires that the RF coil be capable of receiving the 13C NMR signal while transmitting 1H RF power. This places several requirements on the RF console, RF coils and RF filters, all of which shall be discussed below.
RF coil design
The need for decoupling results in two requirements for RF coils: first, the 13C coil (operating at a frequency with a wavelength approximately four times that of the 1H frequency) should not interfere with the RF profile of the 1H coils. Second, the two RF circuits should be sufficiently isolated electrically. While it is in principle possible that surface coils with a resonance mode at the 1H as well as at the 13C frequency can be designed, these designs typically result in a reduced RF efficiency at least at one of the two frequencies, if not both. This may have not been given much attention, since the performance of the 1H circuit does not affect the sensitivity or the direct-detected 13C NMR experiment per se. However, a less than optimal 1H coil design can result in vastly increased RF power deposition and increased local specific absorption rates (SAR).
Sensitivity requirements for 13C NMR have almost invariably led to the use of surface coils for detection.36,63–65 The sensitivity of the experiment can be further optimized with B1-insensitive pulses44,65–67 to alleviate the drawbacks of an inhomogenous RF field for excitation. This discussion, therefore, will be focused on the use of surface coils for 13C NMR spectroscopy.
Typically, surface coils consist of an inductor combined with lumped capacitors. It is important to recognize the fact that, at higher magnetic fields, the impedance of the capacitor (1/iωC) is decreased at the 1H frequency and approaches zero, which results in the RF of the 1H coil being effectively blocked due to induced currents. The increased flux blockage at higher field was especially a problem for concentric 13C and 1H coils, previously used at lower fields.20,44 To overcome this problem, the 13C coil can be geometrically decoupled from the 1H coil. Until 1996, several RF coil designs used a linearly polarized, figure-8-type geometry (‘butterfly design’) for the 1H decoupling coil, where the proton decoupling RF field, B2, is parallel to the 13C coil plane. An inherent shortcoming in all figure-8-type coil designs was the rapidly decreasing B2 along the 13C coil axis, which required excessive 1H RF power to decouple the entire volume of the 13C coil and thus led to excessive local SAR values close to the crossing point of the coil loops. At the time, it was considered impossible to perform broadband decoupled 13C NMR spectroscopy, especially at high fields such as 4 T.
Recognizing that it was highly desirable to use a quadrature decoupling coil that can reduce the RF power requirements up to two-fold, it was demonstrated that two surface coils can be used to generate a circularly polarized RF field for 1H decoupling and imaging.54 The resulting coil design (Fig. 1) was a combination of three basic transmit/receive coils; one was a linearly polarized 13C coil that minimally affects the B2 field distribution of the quadrature 1H RF field generated by the other two RF coils. The end result of this design was that it allowed efficient low-power decoupling at 4 and 9.4 T with negligible performance loss on either channel.54
Figure 1.
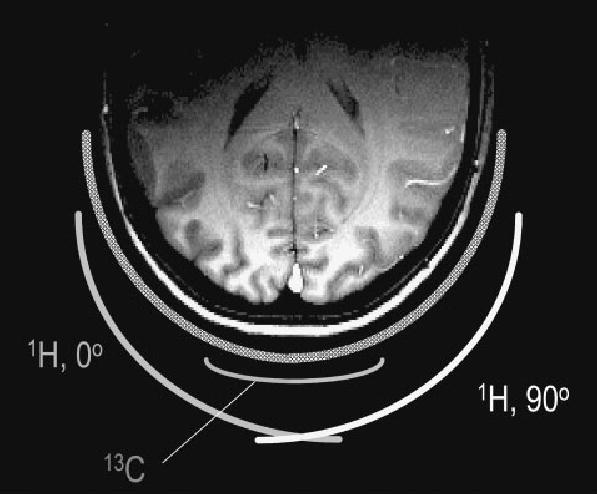
Cross-sectional view of a half-volume 13C–1H coil. From Adriany and Gruetter.54 The 1H coil consists of two surface coil loops with distributed capacitance. The geometric arrangement of the two coils in conjunction with a quadrature hybrid generates a circularly polarized RF field over the field of view of the smaller 13C surface coil, which is placed above the intersection of the two 1H coils. The 13C coil overlaps partially with each of the 1H coils, thereby minimizing the voltage induced by the 1H coil in the 13C coil. The T1-weighted MDEFT image180 of a human head is shown to illustrate the excellent quality and relative homogeneity of the resulting 1H RF field
Such a half-volume quadrature 1H decouple coil design was found to be more efficient in terms of local SAR than previous coil designs for three reasons: first, the quadrature polarized coil has two-fold reduced power requirements for a given γB1 than a linearly polarized coil. Second, to achieve an optimal quadrature field in the 13C coil sensitive volume, the two 1H coil loops were placed as perpendicular as possible (Fig. 1). The increased distance between the wires and the tissue reduced the potential for so-called ‘hot spots’ of power deposition. Third, the resulting 1H RF field had a very modest decrease along the y-axis. This novel coil design enabled broadband decoupling with 30 W peak power using WALTZ-16 at 4 T.54 With typical duty cycles of 10% in vivo, this led to many applications being possible within FDA guidelines at 4 T. Not surprisingly, this coil design has been successfully adapted to 13C NMR spectroscopy of the human brain with corresponding decreases in power deposition over previous designs at 1.568 and 2.1 T69 and has been used in many other studies.70,71 The same coil design principle has been used for indirect detection of 13C label in humans,62,70,72 where the larger 13C coils used for decoupling were driven in quadrature. The same coil design was used in in vivo studies of the rodent brain at 9.4 T,17,56,73 for inverse detection in the rat brain at 9.4 T,74 and with a larger 13C quadrature coil more recently also at 7 T in the rat.75
Double-tuned volume coils have the advantage of providing coverage for the whole head and relatively uniform RF fields. Demands on RF power, filter performance and electrical isolation may critically increase when using volume coils due to the higher RF power required to generate a given γB1 RF field. To avoid substantial coil flux coupling, the coils or the coil fields can be arranged in an orthogonal fashion.76 Volume coils typically have a reduced sensitivity. These requirements can be substantially alleviated by using, for example, the TEM (transverse electromagnetic) resonator design, which allows the generation of quadrature polarized RF fields at both frequencies with minimal performance losses on either circuit.77 Such coils have been used with great success in 1H-detected 13C labeling studies of the human brain.78,79
Console and RF filters
In addition to increased demands on an efficient RF coil design, the inherent requirement to apply RF at the 1H and at the 13C frequencies demands that the spectrometer should be equipped with at least one additional broadband RF channel. This is a requirement that may not be easily compatible with the design of MRI systems for diagnostic purposes and hence may pose a direct tangible barrier for clinical research applications using 13C NMR spectroscopy.
Having the spectrometer capable of performing two-channel broadband NMR spectroscopy does not guarantee a successful application of 13C NMR spectroscopy. Even when using a good RF coil design, RF coils rarely provide sufficient isolation between the observe and the decouple RF channel to allow 1H decoupling during signal detection. Therefore, additional isolation is required, which can be achieved by the use of RF filters. Two characteristics of RF filters must be considered, namely the need to effectively filter unwanted frequency bands, as well as the applicable RF power. In this context it is important to recognize that some filters contain iron cores, which are ferromagnetic and thus not useful close to the magnet. In terms of RF power requirements, it is important to state the required peak RF power under which the filter must perform and the allowable continuous wave power the filter must withstand. The recommendation is to overdesign the peak RF power a filter can handle to avoid the potential for filter breakdown.
Placement of the RF filter is equally important and in many cases site-specific (Fig. 2). For instance, it may be advantageous to place a bandpass filter at the input of the RF amplifier to eliminate potential broadband noise emanating from the modulator. In addition, it is typically necessary to place bandpass filters at the output of the RF amplifier, preferably after the RF has been passed into the Faraday shield. Bandpass filters typically have a higher insertion loss (1–2 dB) than low- or highpass filters and thus can in principle be used for the decouple channel, provided the RF power available is not limiting. On the detection side, however, it is desirable to minimize insertion losses, which can be achieved using low-pass filters in the 13C channel. When using volume coils for either channel demands on RF power, the requirements on filter performance and electrical isolation may critically increase.
Figure 2.
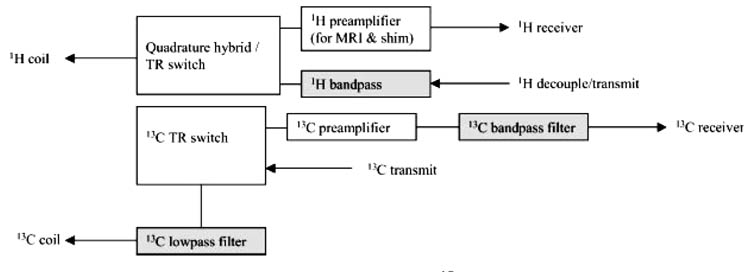
Placement of RF filters for direct-detected 13C NMR spectroscopy, adapted from Adriany and Gruetter.54 The filters are designed to minimize 1H RF breakthrough at the 13C (observe) channel. The 13C bandpass filter after the 13C pre-amplifier effectively renders the pre-amplifier narrow banded
Decoupling
Many 13C nuclei are directly bonded to protons. The resulting magnetic coupling between the 13C nucleus and 1H nucleus results in a splitting of the 13C resonance into multiplets separated by JCH Hz. The process of decoupling collapses the multiplets due to heteronuclear coupling into singlets, thereby simplifying the spectra and effectively increasing the sensitivity. Most 13C NMR applications have relied on WALTZ decoupling of the protons.80 Recently, it has been demonstrated that using frequency-swept RF pulses as the basic building block, such as the hyperbolic secant pulse,81 dramatically increase the decoupling bandwidth. These decoupling methods feature only modest increases in peak RF power demand,82–84 while maintaining a favorable ratio of cycling sideband intensity to center peak intensity.84 We recently demonstrated that broadband adiabatic 13C decoupling was achieved at 9.4 T using such cycles at a moderate peak γB1/2πof ~ 1 kHz.74
Specific absorption rates (SAR). RF power is important
One potential risk to the MR examination is the fact that the RF power absorbed by the tissue is converted to heat, which can potentially lead to excessive heating of the body and local tissue, resulting in damage. It is therefore important to limit the RF power administered to the brain, especially for human studies.
To minimize the SAR requires that the pulse sequences and decoupling power are adjusted to operate at the minimum power threshold at which sequence performance is still acceptable. When using surface coils, optimization of RF power is most reliably achieved with an external reference sphere filled with a suitable 13C-labeled compound, such as formic acid, placed at the coil center. Such an external standard for RF power adjustment can also be an integral part of the external quantification procedure (see below). Highly efficient and accurate methods for adjusting the decoupling power have been described.85,86
When measuring RF power it is of course important to recognize that RF power lost in the cables, T/R switches and filters will not reach the subject. Hence these factors should be considered when calibrating the SAR monitor. A practical approach is to measure the RF power at the coil port with the spectrometer configuration set to what will be used in the experiments. Additional factors that will reduce the amount of RF power delivered to the subject are: (i) the coil efficiency (which can be measured by comparing the loaded vs the unloaded coil Q factor); (ii) the power reflected by the RF coil (caused by, for example, amplified RF noise transmitted outside the bandwidth of the RF coil, acting as a bandpass filter); and (iii) radiation losses, which are increasingly important with increased RF frequency, i.e. B0. In general the majority of the SAR is generated by the decoupling.
The Center for Devices and Radiological Health of the United States Food and Drug Administration has stated that studies exceeding SAR of 4 W/kg averaged over 15 min over the entire body or 3 W/kg averaged over the head averaged over 10 min or 8 W/kg in any gram of the head must be considered studies of significant risk (www.fda.gov/cdrh/ode/guidance/793.html).
The first criterion for significant risk is rarely exceeded in human studies using head volume coils or surface coils and thus is less important. The second criterion is also rarely exceeded in studies using surface coils, leaving the last criterion as the most difficult to comply with.
LOCALIZATION. THE CHEMICAL SHIFT DISPLACEMENT ARTIFACT
The full chemical shift range of most biologically interesting 13C resonances is approximately 160–200 ppm wide. Even when considering the four-fold lower gyromagnetic ratio than 1H, this is a range that (in Hz) exceeds the range for 1H resonances of main biological interest (7 ppm) by at least a factor of six. Thus, chemical shift displacement error problems are important factors to consider when wishing to localize 13C NMR signals.
Is it necessary to localize NMR signals? For most applications in the brain, the answer to this question must be emphatically yes. In 1H NMR spectroscopy, water suppression and the intense lipid signal from subcutaneous fat cause dangerous artifacts that are likely to obscure and degrade the signal from the brain. In 31P NMR spectroscopy, for example, it is well known that ATP and PCr concentrations in extracerebral muscle (such as the signals from the temporalis muscle) are vastly different than those in the brain and thus can lead to inaccurate interpretation. In 13C NMR spectroscopy, water suppression is obviously not an issue and for some resonances the lipid signals may not be a significant problem. Non-localized 13C NMR has found important applications, especially when considering the need for signal (which undoubtedly is reduced when using localization methods) and experimental simplicity.39,87–89 However, for some resonances, such as glucose, lactate, glutamate and especially glycogen, the concentration in extracerebral tissue can be significant.
Therefore, localization is important for 13C NMR spectroscopy of the brain, because the frequently employed technique of subtracting, for example, a pre-infusion natural abundance 13C spectrum has several drawbacks. Among the potential problems of subtracting a pre-infusion spectrum are the reduced sensitivity, increased measuring time, the susceptibility to motion artifacts and small changes in linewidth over the rather long measuring times.
Spatial localization does not depend on chemical shift when using the one-dimensional surface-spoiling gradient63,90 or spectroscopic imaging,91,92 which is an elegant technique to solve the chemical shift displacement problem when many transients can be acquired.93 The low spatial resolution may require dedicated solutions to minimize Gibbs ringing from superficial fat signals, and several approaches have been described.94,95
Nevertheless, one of the challenges of localized 13C NMR is the localization error induced with slice selection techniques due to the demanding 13C chemical shift range. In the following, we will concentrate on the various methods for full three-dimensional localization of 13C NMR signals using gradient-based methods.
Direct localization using slice-selection
The use of direct localization of 13C has been discounted on the basis of the large chemical shift requirement leading in general to increased demand on the RF power through the need for an increased RF bandwidth. In some cases, even when the demands on the RF bandwidth can be met, the required gradient strength may very well be limiting, because of the lower gyromagnetic ratio γ. The following example illustrates this case: true localization of the entire 13C chemical shift range including the carboxyl resonances at around 180 ppm and the lactate methyl resonance at 20 ppm requires a range of 160 ppm to be covered, equivalent to a frequency spread of ~1700 Hz/T B0 field. To maintain the chemical shift displacement error below 10% of the voxel dimension, the bandwidth of the RF pulse thus has to be 17000 Hz/T. When localizing a slice of, for example, 4 cm, the gradient strength must be ~4250 Hz/cm, which corresponds to a gradient strength of 40 mT/m per Tesla B0, because the γ of 13C is four-fold smaller than that of 1H. For low magnetic fields such as 1.5 T, a gradient strength of 60 mT/m is required and this is pushing the envelope of what is currently possible, even more so at higher B0.
However, when contemplating the large chemical shift range of 13C, it is worth considering that the chemical shift range that needs to be covered for specific applications may be much smaller. Such reduced chemical shift dispersion is summarized for several metabolites in Table 1. For example, all the inositol resonances are observed within 3 ppm96 and it is obvious that the chemical shift displacement error for myo-inositol is small, even when using direct localization. The first three-dimensional localization of 13C NMR signals was achieved using ISIS localization on the 13C z-magnetization,48 used for the first direct measurement of brain glucose C1 in the human brain.20 In addition, directly localized 13C NMR spectroscopy was used for the first detection of the natural abundance signals of small molecules, as illustrated with myo-inositol.44
Table 1.
Chemical shift ranges for 13C MRS per Tesla (expressed in Hz/T) including the range of the corresponding coupled 1H resonances
| Compound class | Chemical shift range (ppm) | 13C Frequency range (Hz/T) | 1H frequency range (Hz/T) |
|---|---|---|---|
| Glycogen/glucose (all) | 101–61 | 430 | 94 |
| Myo-inositol (all) | 76–72 | 43 | 34 |
| Amino acids (CHn) | 56–22 | 363 | 85 |
| Amino acids (CH) | 56–53 | 32 | 20 |
| Lipids (CHn) | 131–14 | 1248 | 196 |
Polarization transfer
Localization on the 13C magnetization using ISIS must be considered a valid localization method for a restricted spectral region. However, when using the 13C longitudinal magnetization for localization, signal enhancements are commonly achieved using the nuclear Overhauser effect (NOE), which has a theoretical upper limit of a three-fold enhancement of the 13C signals. However, for resonances with sufficiently long T2, such as those of most brain metabolites as judged from their narrow line widths of a few Hz,47 it is feasible to use polarization transfer to recover the maximal sensitivity gain of a fourfold enhancement and to localize on the 1H magnetization, thereby greatly reducing the chemical shift displacement error due to the much smaller chemical shift range (Table 1). Heteronuclear polarization transfer combined with localization on the proton magnetization, as proposed earlier,97 was shown to minimize the chemical shift displacement error in 13C MRS of the human brain to a level beyond concern even at 4 T.55 To minimize the number of pulses needed for generating the in-phase 13C signal enhancement and to minimize phase distortions in the spectrum, distortionless enhanced polarization transfer, DEPT,98 was used. Another alternative was INEPT,69,99 which required more RF pulses compared with DEPT, having more potential for signal loss in inhomogeneous RF fields. Because of the number of RF pulses used, polarization transfer sequences tend to be more sensitive to B2 inhomogeneities such as those present when using surface coils. However, surface coils were used to optimize sensitivity as in almost all 13C studies, and the polarization transfer sequence had to be carefully optimized for the volume of interest, which was shown to be possible when using localized pre-calibrations of decoupler and transmitter RF power.55 As a result, a high sensitivity can nevertheless be achieved, especially when the VOI dimensions are small enough that RF variation across the VOI can be neglected.54,55 While excellent sensitivity was demonstrated with the localized detection of natural abundance myo-inositol, scyllo-inositol, glutamate, taurine, glucose, glutamine and NAA signals,21,54,55,96 further gains were expected when incorporating adiabatic pulses into the pulsed polarization transfer sequence, which was shown to improve reliability and sensitivity.8,100 When performing direct-detected 13C NMR spectroscopy, the 13C coil is typically smaller than the 1H coils and thus the 13C part of the polarization transfer is more prone to signal loss. Replacing the standard 90–τ–180–τ section of the 13C channel in DEPT with a segmented BIR-4101 pulse resulted in greatly minimized effects of RF inhomogeneity on the acquired signal.8,102 Such a sequence is shown in Fig. 3.
Figure 3.
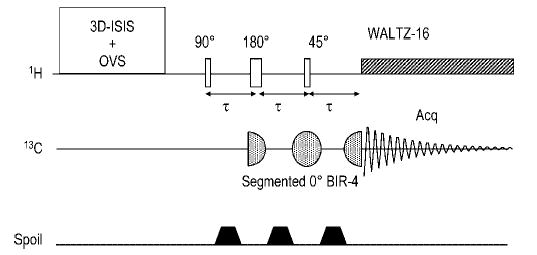
Localization using a semi-adiabatic DEPT sequence including coherence elimination by gradient dephasing. From Henry et al.102 Localization is performed on the 1H z-magnetization using ISIS, complemented with outer volume suppression (OVS). The 1H part of the coherence generation was achieved using standard hard pulses, with the last pulse flip angle set to 45° to allow for the simultaneous detection of all CHn carbons. The two 90°–τ–180°–τ sequence was replaced by a segmented 0° BIR-4 pulse, rendering the performance of the sequence much less susceptible to the spatial variation of the 13C RF field, especially when using surface coils. The spoiling gradient (spoil) dephases unwanted coherences excited by the 1H pulses when they deviate from their nominal flip angles indicated. The delay τ is determined by the heteronuclear J coupling, JCH, which ranges in vivo from 127 to 167 Hz74
The broadband localization achievable with polarization transfer methods has resulted in localization of all amino acid resonances in the human brain [Fig. 4(A)] as well as in efficient broadband localization in the rat brain for the first time [Fig. 4(B)], indicating complete elimination of extracerebral lipid signals.
Figure 4.
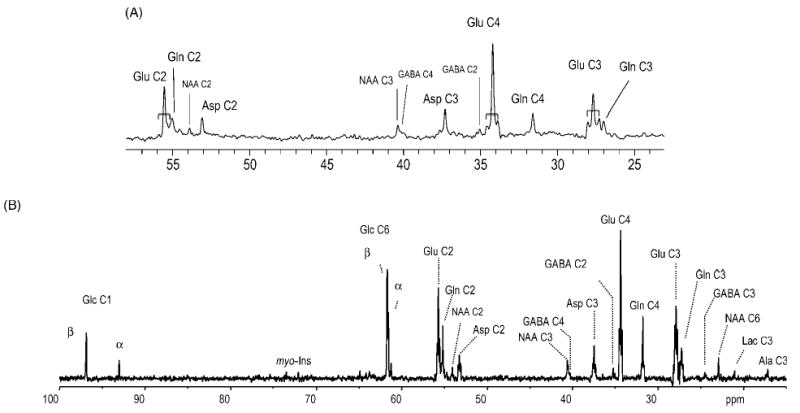
Examples of direct-detected 13C NMR spectroscopy from the brain. (A) 13C NMR detection of label incorporation into mostly cytosolic amino acids at 4 T, from Gruetter et al.9 Shown is a representative spectrum obtained from a 45 ml volume in the human visual cortex during an infusion of 67%-enriched [1-13C]glucose. In addition, resonances resulting from homonuclear 13C–13C coupling were readily detected at the positions of all glutamate resonances (indicated by the brackets). Processing consisted of a mild Lorentz–Gauss apodization (3 Hz) and the spectrum is shown without baseline correction. (B) In vivo 13C NMR spectra from a 400 μl volume in the rat brain, acquired using the modified DEPT sequence depicted in Fig. 3 during an infusion of 70%-enriched [1,6-13C2]glucose, from Henry et al.102 Processing consisted of zero-filling, 2 Hz Lorentzian-to-Gaussian resolution enhancement and fast Fourier transform. No baseline correction was applied. Note the complete absence of the lipid signals over the entire spectral range. Resonance assignments are as follows: Glu C2 at 55.6 ppm; Gln C2 at 55.0 ppm; NAA C2 at 54.0 ppm; Asp C2 at 53.7 ppm; NAA C3 at 40.5 ppm; GABA C4 at 40.45 ppm; Asp C3 at 37.6 ppm; GABA C2 at 35.3 ppm; Glu C4 at 34.2 ppm; Gln C4 at 31.7 ppm; Glu C3 at 28.0 ppm; Gln C3 at 27.7 ppm
Three-dimensional localization of the 13C NMR signals of glycogen
Clearly, the chemical shift displacement error can be minimized by using the 1H z-magnetization for localizing the signals for 13C NMR detection. However, methods such as those discussed in the previous section are not applicable in situations where T2 is very short. Unfortunately, for some compounds such as glycogen, the T1 and T2 are relatively short. This is especially true for T2 that is short relative to the delays required to generate polarization transfer, resulting in substantial signal loss. Therefore, it is impossible to realize the full sensitivity gains of the polarization transfer technique. Nevertheless, it has been pointed out that in muscle the signal gains with a frequency-tailored INEPT sequence are comparable to what can be achieved by proton decoupling and NOE generation (SINEPT).15,103 While the SINEPT technique relies on performing the polarization transfer on-resonance and without refocusing the J evolution, thereby minimizing the T2-losses, the method remains in principle susceptible to changes in T2, which have been reported to occur depending on the glycogen molecule size and temperature.104 Unfortunately, the potential four-fold signal gain is reduced by the short T2 of 1H and 13C signals on the order of 5 ms.15,104,105 Given the uncertainty of potential changes in transverse relaxation times,104 a robust method that is capable of achieving three-dimensional localization of the glycogen signal without transverse coherence generation was considered advantageous.
The method developed for the localized measurement of glycogen relies on outer-volume suppression, achieved with slice-selective inversion recovery nulling of the magnetization in two slices parallel to B0 and perpendicular to the RF coil (Fig. 5) in conjunction with nominal 90° pulses applied along the six slices parallel to the volume-of-interest. In the brain (see below) such localization was crucial to minimize potential contamination of the detected signal with signals from extraneous muscle, especially in the rat. The performance of the sequence was validated from the post-mortem rapid elimination of glucose and glycogen in the brain, which is rapid compared with muscle [Fig. 6(A)], as well as from the elimination of subcutaneous lipid signals, as shown for the human head in Fig. 6(B).
Figure 5.
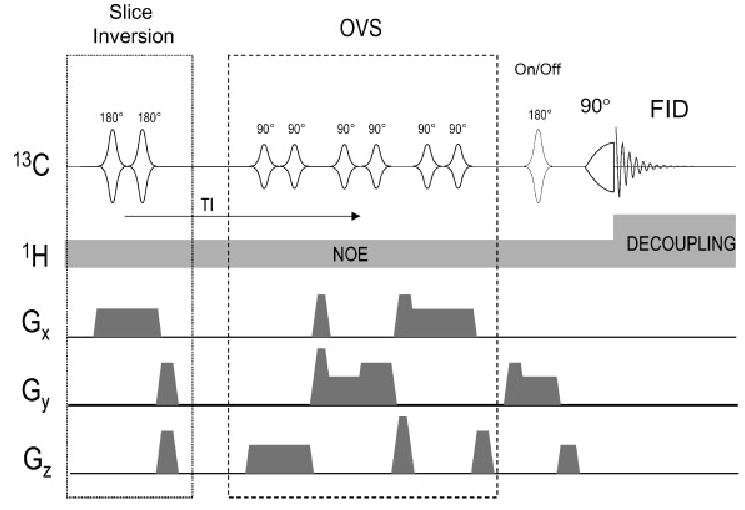
Localization of 13C NMR spectroscopy using OVS only, from Choi et al.56 The localization of the magnetization starts with two adiabatic pulses that invert the z-magnetization in slabs along x adjacent to the voxel. This inverted z-magnetization approaches zero during the delay TI and when it is approximately minimized, a standard OVS sequence along all three dimensions with nominal 90° flip angles applied. Just before the adiabatic excitation pulse, an optional inversion pulse is applied on alternate scans, which together with the concomitant y-gradient and appropriate phase cycling selects a slice along y (parallel to the 13C coil plane) as in one-dimensional ISIS. Reproduced with permission from Mag. Reson. Med. Copyright © 2000 John Wiley & Sons, Ltd.
Figure 6.
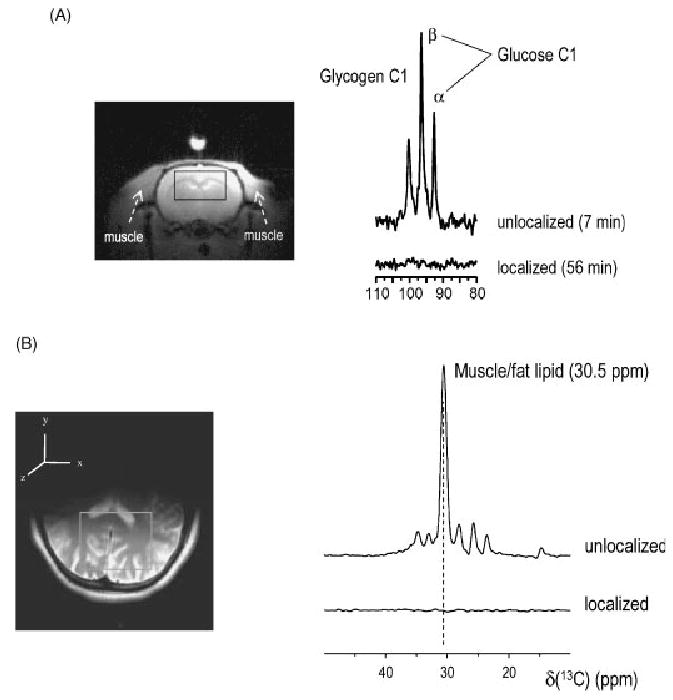
Validation of the localization of 13C NMR signals using OVS (Fig. 5). (A) Twenty minutes after termination by KCl injection, glucose and glycogen resonances from extracerebral tissue are still observed in the post-mortem rat (top), whereas upon application of the three-dimensional localization method these signals were reduced to the noise level (bottom trace). Reproduced with permission from Choi et al.17 (B) In the human brain, where such post-mortem studies are not applicable, the efficiency of the adapted sequence was verified from the more than 100-fold suppression of the superficial lipid signals. From Oz et al.18 Copyright © 2003, with permission from Elsevier
SENSITIVITY. UNEARTHING TINY SIGNALS
Because the detection of 13C label is inherently insensitive, generally every effort is made to improve the sensitivity. In this section, we focus on the sensitivity gains achieved with increased magnetic field B0, direct vs. indirect detection, choice of RF coil and shimming.
Effect of higher magnetic fields, B0
It is well-known that increasing the static field B0 increases the sensitivity of NMR detection.106 The increase in sensitivity for non-loading samples has been reported as being an exponential function of B0, which can be written as
| (1) |
From theoretical considerations, it is clear that the signal S increases with B02, hence β must be 2 or lower, amounting to an upper limit for the gains in sensitivity achievable due to increases in B0 alone. Even when the noise present in the RF coil is the dominant source of noise, its root-mean-square amplitude may increase with frequency (B0) and it is generally accepted that in this case β = 1.75. For in vivo spectroscopy, however, the sample is the most dominant source of noise and thus the noise detection efficiency increases with frequency and thus the sensitivity increase with B0 is closer to linearity with β~1. Because the sample may not be the dominant source of noise, it is plausible that in vivo β may lie somewhere between 1 and 1.75. In practice β is probably closer to the former. In this discussion it was assumed that resonance linewidths and relaxation times are very similar between the different field strengths. An increase in resonance linewidth can offset some of the sensitivity gains, as can an increase in longitudinal relaxation time, although the latter effect influences sensitivity only with the square-root of the T1. Lastly, increased spectral resolution can result in increased sensitivity due to the decreased signal overlap. Spectral overlap may in general not be a problem for direct-detected 13C NMR spectroscopy, but resolution of the spectral region of the C2 of amino acids and the overlap between GABA C2 and glutamate C4 stand to gain from increased spectral resolution. In practice, it is very difficult to determine the precise value of β, but it is possible to state the sensitivity gains achieved over previously published results.
Some studies have suggested that the sensitivity gains at lower frequencies may be supralinear,107 indicating that the RF coil contributes significantly to the noise. In this case, the use of superconducting RF coils may potentially yield additional sensitivity gains,108 as is increasingly being realized for high-resolution NMR of solutions. It is of interest to note that polarization transfer from hyperpolarized compounds has been recently used with specific compounds to image blood flow.109 This points to the potential utility of hyperpolarization for 13C to enhance sensitivity, although how this will be achievable is at present not clear.
Direct vs indirect detection
A study of the sensitivity of 13C NMR spectroscopy in vivo would be incomplete without pointing out the two principal detection methods available, namely direct and indirect detection of 13C label. Direct detection of the 13C signals takes advantage of the large chemical shift dispersion of the 13C nucleus. In addition, the spin systems of the 13C nucleus are simpler, provided 1H decoupling is applied.55 However, the increased specificity of direct detection comes at the price of a substantial loss of sensitivity.72 For example, the signal-to-noise ratio from an equimolar concentration of 13C at a given static field B0 is much lower for 13C than the corresponding 1H signal in vivo. In theory the signal is γ3 stronger for 1H (64-fold, which in the literature is often confused with the gain in sensitivity). However, under conditions of full sample loading (noise ~γ) this is reduced to a γ2 (16-fold) sensitivity gain. Polarization transfer reduces the relative sensitivity gain to γ. In many cases, such as glutamate, glutamine and aspartate, the resonances in the 1H spectrum are coupled to other 1H, resulting in often complex resonances of appreciable width on the order of 20 Hz, as is the case for the γ-proton of glutamate. In contrast, the 13C resonances have linewidths on the order of a few Hz,47 and this can translate into a further reduction of the estimated sensitivity gain of approximately two-fold. In addition, the multiplicity of the CHn groups enhances the sensitivity of 1H detection. Thus the sensitivity gain is estimated at ~2n:1. These estimated sensitivity gains may in some cases be offset by the limited spectral resolution for protons. Given these real advantages in sensitivity, it is attractive to exploit the fact that 1H nuclei in close chemical proximity to a 13C nucleus are coupled through the heteronuclear J coupling. With appropriate ‘spin gymnastics’ this coupling can be exploited to extract the signal from these protons by eliminating the signal from protons that are not coupled to 13C.74,78,110–113 The ensuing ‘13C-edited’ 1H spectrum stands to benefit from the improved sensitivity of the proton. It also stands to suffer from a major shortcoming of 1H NMR spectroscopy, namely the limited spectral dispersion, as the corresponding chemical shifts in biomedical applications reside in a 10-fold reduced bandwidth compared with carbon, and additional efforts such as two-dimensional spectroscopy may be required to achieve adequate spectral resolution.99
The spectral resolution in 1H NMR spectroscopy is especially limiting at low magnetic fields, such as the widely deployed magnetic field of 1.5 T, which does not allow the accurate separation of the resonances of glutamate and glutamine. When increasing the magnetic field some of these limitations can be overcome due to improved spectral dispersion,114 allowing the detection of resolved signals from 13C labeled glutamate and glutamine by 1H NMR spectroscopy.74 Figure 7 shows that in 1H NMR spectra the resolution of a number of resonances is limited even at 9.4 T, when comparing with the resolution in the 13C NMR spectrum [Fig. 4(B)]. A recent study at 7 T recently confirmed that the spectral resolution decreased with lower field in the 1H spectrum compared with direct-detected 13C NMR.75 Nonetheless, the C2 resonances of glutamate and glutamine are not easily separated in the 1H NMR spectra (Fig. 7), whereas at 4 T (Fig. 4),8,9 and to some extent at 1.5 and 2.1 T, the C2 of glutamate and glutamine are readily separated in direct-detected 13C NMR spectra.43,47,69 In addition, direct detection offers the potential to detect 13C–13C couplings (Fig. 4),56,102,115 containing important metabolic information.116,117
Figure 7.
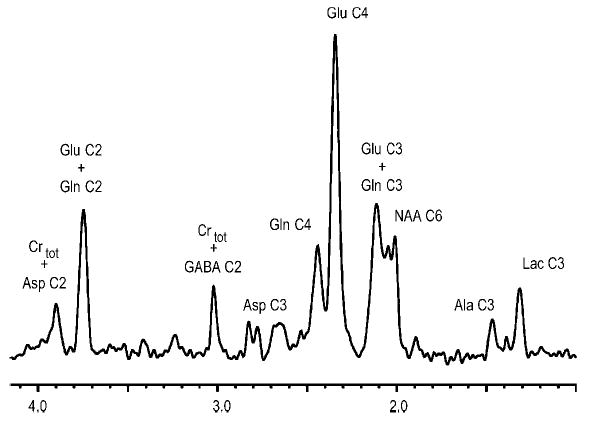
Illustration of the information content achievable in vivo by 1H-detected 13C NMR at 9.4 T. The 1H NMR spectrum was obtained from a 130 μl volume in the rat brain in the first 1 h of glucose infusion showing resonances coupled to 13C only, from Pfeuffer et al.74 The improved sensitivity allowed the detection of label incorporation into alanine C3 (Ala). Natural abundance signal is detected for creatine (Crtot) and NAA. Reprinted from Magn. Reson. Med. Copyright © 1999 John Wiley & Sons, Ltd.
RF coil sensitivity considerations
When using surface coils it is advantageous to use adiabatic RF pulses to overcome the problems arising from inhomogenous RF fields, which have been used in a number of studies for 13C NMR spectroscopy.8,17,18,20,44,65,66,69,102,118 In principle it may be desirable to have a homogenous RF field covering the entire brain, as is being widely used for head imaging on conventional MR scanners. When compared with surface coils, the volume coils require increased RF power since the RF power is distributed into a larger volume.106 Increased RF power implies decreased sensitivity from the reciprocity principle. It is not surprising that volume coils typically are two to three times less sensitive than surface coils with optimized dimensions, even when considering the most efficient coil design. This sensitivity loss can be partially compensated by imaging the 13C label indirectly,79,99,119 which may require simplified models of brain glutamate metabolism (see below).
Shimming
Even though the effect of B0 inhomogeneity on the linewidth of a 13C resonance is reduced four-fold compared with that of 1H, shimming remains an important issue: the low sensitivity of 13C NMR typically precludes the measurement of signals from small volumes, leading to comparatively large volumes. The measurement of substantially larger volumes probably results in the need for adjusting the currents in the second-order shim coils, which can be achieved using quantitative shim methods.47,120,121 The need to adjust second-order shim coils can be appreciated from the fact that the spatial distribution of the B0 field of second-order shim coils results in significant signal intensity being distributed in the wings of the resonance (Fig. 8). Such signal distribution can be easily missed in peak integration or even peak fitting at low signal-to-noise ratios, which are typical for in vivo 13C NMR spectroscopy, or when using even modest resolution enhancement. Shimming with second-order shim coils typically has only a modest effect on the full-width at half-maximum of the resonance. Nonetheless, a significant fraction of the total signal in the wings is shifted under the main resonance, thereby reducing the potential for quantification errors and increasing the sensitivity of the experiment further. These effects are expected to be of increased importance with increased B0. In summary, it will be important to adjust second-order shim coils to harness the full sensitivity gains at higher field.
Figure 8.
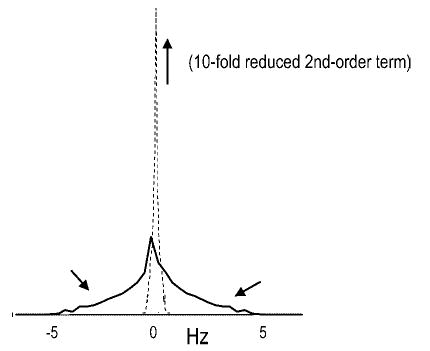
Effect of shimming on lineshape and width. Shown is the effect of a second-order shim coil (yz) on the field distribution in a cubic volume. Upon elimination of this term (by shimming), the intensity in the wings is moved underneath the central peak indicated by the arrows, thereby increasing sensitivity and reducing potential quantification errors
QUANTIFICATION METHODS FOR IN VIVO 13C NMR SPECTROSCOPY
This section focuses on the methods available to calibrate the in vivo signal intensity. How to measure the signal intensity using peak fitting, integration or other computationally even more involved methods is not part of this review. The reader may be interested in a companion article in this issue which considers issues of peak intensity measurement.122
Internal reference methods
Internal reference methods have become the method of choice for quantification of 1H NMR spectroscopy. These methods use either referencing to the signal of a compound measured in the spectrum, such as creatine, or referencing to tissue water. These methods are not easily applicable for 13C NMR spectroscopy. The main reason is that 13C NMR spectra of the brain typically lack a signal from a natural abundance compound that is present in high concentration, although it appears that, especially at high fields and longer acquisition times, the signal of some brain metabolites might be sufficient, this has been used by some investigators. However, these signals are on the order of 0.1–0.2 μmol/g in 13C concentration and the signal-to-noise ratio of such reference measurements is typically low, especially at low fields. Errors in the reference measurement are expected to propagate into the quantification of the 13C label in the 13C NMR spectrum.
External reference methods
Because of the complexity of the 13C NMR measurements and the frequent use of the surface coil as transceiver, the external reference method has become an important tool to quantify 13C label in the brain. The method is based on the idea of repeating the identical NMR experiment (under identical experimental conditions as in vivo) in a phantom containing an aqueous solution of a reference compound (typically identical to that being measured, such as glucose, glycogen, etc.) of known concentration. The principle of the external reference method is illustrated in the scheme in Fig. 9. The RF power is adjusted based on the reference signal provided at the 13C coil (see above) and corrections for the effect of coil loading on the signal and of differential relaxation effects are measured and taken into account in the quantification. A major advantage of this method is that, by repeating the reference experiment under identical conditions (i.e. applying RF at the identical chemical shift with an identical γB1 at the coil center), some imperfections are inherently corrected, such as off-resonance effects in the sequence and effects of inhomogenous B1.
Figure 9.
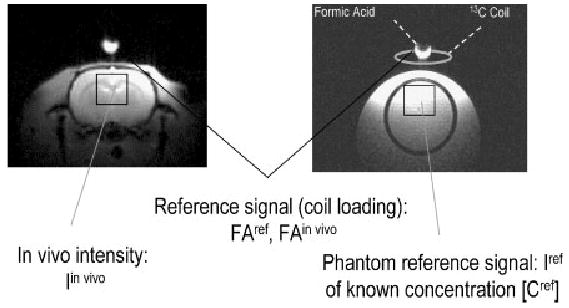
Scheme of the external reference method. The in vivo experiment is scaled by the reference intensity from, for example, 99% 13C-formic acid (FA) placed at the 13C coil center to correct for differences of the effect of sample loading between the in vivo and the reference experiment. The signals are further corrected by the correction factor CF that takes into account the relaxation effects on the signal (T1, T2 and NOE) in vivo, CFin vivo, and in the phantom, CFref, to yield the corrected signal intensity Icorr. From the known concentration in the phantom the in vivo concentration can be determined, as follows:
Quantification of brain metabolites using natural abundance 13C NMR of the brain
Studies using natural abundance 13C NMR certainly are not expected to compete with 1H NMR measurements of the respective compound; however, they prove invaluable in estimating concentrations, which can aid the quantification of the 1H NMR spectrum.88,123 For example, the difficulty in detecting the natural abundance signal of glutathione (GSH) indicates a concentration below 3 μmol/g in agreement with 1H NMR quantification124 and, similarly, the concentrations of taurine, aspartate and GABA are expected to be below 2 μmol/g.
From the sensitivity and the quantification of the localized 13C NMR signals of glucose in the human brain,20 it was suggested that signals from natural abundance myo-inositol should be detectable at 2.1 T. At the time, the only compounds measured by natural abundance 13C NMR were glycogen in muscle 125 and liver,11 creatine in skeletal muscle14 and subcutaneous lipid signals, all of which are present in quantities of tens of μmol/g or above. Indeed, it was shown early on that quantification of natural abundance myo-inositol was possible.44 Improvements in sensitivity and magnetic field strength have permitted the localized quantification of glucose,21 as well as glutamine, glutamate, N-acetyl-aspartate (Fig. 10 ) and elevated scyllo-inositol.96
Figure 10.
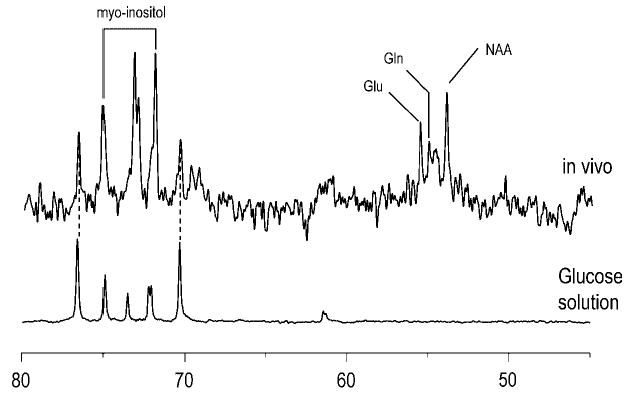
Localized 13C NMR detection of natural abundance resonances in the human brain. The glucose resonances detected during hyperglycemia are indicated by the vertical dashed lines and identified by the comparison with the glucose phantom (bottom trace). In addition to glucose and myo-inositol, resonances from glutamate, glutamine and N-acetyl-aspartate were also discernible. From Gruetter et al.21
APPLICATIONS: FINDINGS FROM LOCALIZED 13C GLUCOSE LABELING STUDIES OF THE BRAIN
The detection of signal from natural abundance compounds in the brain certainly represents a useful complement to in vivo quantification by 1H NMR spectroscopy, albeit of limited practical value. The real power of 13C NMR spectroscopy is more obvious when considering the administration of 13C labeled precursors such as glucose to follow the redistribution of the label in metabolic products of glucose consumption. Localized 13C NMR spectroscopy to date has provided insights into brain metabolism in vivo. In addition to measuring the turnover of glutamate and glutamine, other observations provided by localized 13C NMR spectroscopy include: (i) the demonstration of reversible Michaelis–Menten kinetics of glucose transport in human brain, and that a brain glucose close to zero is the point where cerebral blood flow increases during hypoglycemia; (ii) the measurement of brain glycogen metabolism during hypoglycemia in animals, demonstrating that brain glycogen is a significant source of fuel during hypoglycemia; (iii) the detection of very slow brain glycogen metabolism in the human brain; (iv) the revelation that pyruvate carboxylase flux (anaplerosis) is substantial in the in vivo human brain; (v) the demonstration that glial metabolism is significant at rest and mostly oxidative in vivo; (vi) the measurement of the malate-aspartate shuttle flux as a major controlling step in brain oxidative metabolism and isotope flux; and (vii) the observation that glutamate metabolism is affected by physiological focal stimulation in human brain. In addition to these studies, localized 13C NMR spectroscopy was used to detect in vivo GABA labeling as well as significant lactate metabolism in the resting, healthy brain.8,74
These observations make it clear that localized 13C NMR spectroscopy provides a unique window on in vivo brain metabolism, with a chemical specificity and diversity of potential measurements not possible by other methods. Some of these achievements shall be highlighted below.
GLUCOSE TRANSPORT
In principle, glucose concentrations can be measured using 1H NMR spectroscopy.21,126 However, for a CH group with homonuclear J-coupling, the sensitivity advantage compared to 13C is expected to be only two- to three-fold as discussed above. The proximity of the 1H resonance of glucose H1 to water adds to the difficulty in measuring brain glucose using 1H NMR spectroscopy.127 In cases where metabolism is followed by 13C NMR, it may be advantageous to measure brain glucose content as well. Unless labeled glucose is injected directly into the brain, the administered 13C label must cross the blood–brain barrier before it can be metabolized by the brain cells. Aside from lactate and possibly glycogen,17 brain glucose is the only sizable kinetic pool that is capable of influencing the labeling kinetics of pyruvate and thus ultimately of acetyl-CoA. Therefore, precise knowledge of the size of the brain glucose pool and its physical distribution space is important for the derivation of absolute metabolic fluxes from, e.g. glutamate labeling curves.6,22 It has been shown that steady-state glucose transport kinetics can be derived from the relationship between brain and plasma glucose, which can provide insights into the kinetics of the brain glucose pool.20–22,24
Glucose is the single most important substrate for normal function, and the brain relies on a continuous import of glucose from the blood, which must occur across the blood–brain barrier. Glucose transport rates into the brain are thus indicative of the maximal sustainable rate of glucose consumption, CMRglc.
Traditionally, glucose transport kinetics has been analyzed with a model of brain glucose transport that was based on standard Michaelis–Menten kinetics. However, Michaelis–Menten kinetics is based on the assumption that initial rate of unidirectional product formation is measured, e.g. immediately after substrate and enzyme have been combined. This experimental condition would require the elimination of the brain glucose, which is difficult to achieve without interfering with normal brain function. Hence it is reasonable to expect that reversible Michaelis–Menten kinetics is more appropriate in describing brain glucose transport. Such a model has been proposed,21,128 and it was shown that one implication of the reversible model of brain glucose transport is that the relationship between brain and plasma glucose is linear.21 Many measurements of brain glucose content as a function of plasma glucose have in the meantime corroborated the observation that brain glucose concentrations are a linear function of plasma glucose,24,115,129,130 and such a case is illustrated for two different anesthetic regimes, α-chloralose and pentobarbital in Fig. 11(A). These studies indicated that decreased electrical activity and thus decreased energy metabolism resulted in increased brain glucose concentrations. The increment in brain glucose was consistent with an approximately twofold reduction in brain glucose utilization. The data furthermore indicated that during deep pentobarbital anesthesia (a condition known to cause isoelectricity), the brain glucose concentration was still considerably below that expected when glucose consumption was close to zero [indicated by the dashed line in Fig. 11(A)]. The presence of a sizable concentration gradient between brain and plasma glucose implies that net glucose uptake (i.e. glucose consumption at steady state) was appreciable even under conditions close to isoelectricity.
Figure 11.
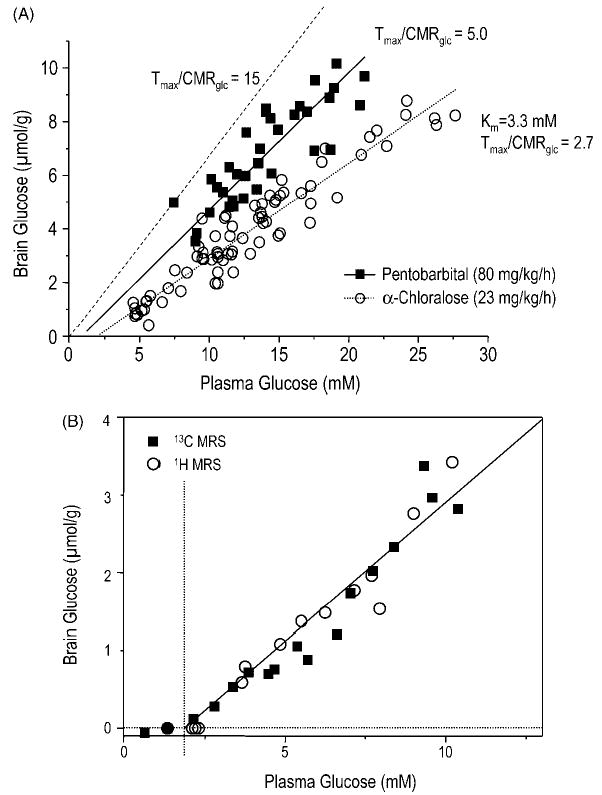
Brain glucose transport kinetics from the measurement of the brain glucose content as a function of plasma glucose concentration. (A) Demonstration of a linear relationship between brain and plasma glucose concentrations, as well as the effect of increased anesthesia (decreased electrical activity) on brain glucose content in vivo. From Choi et al.115 (B) Comparison of 13C NMR quantification with 1H NMR quantification of brain glucose concentrations during hypoglycemia. From Choi et al.24
The importance of measuring the brain glucose concentration can be appreciated from its role in regulating brain glucose metabolism: glucose becomes rate-limiting for metabolism when its concentration approaches that of the Km of the first step in its metabolism, which is phosphorylation by hexokinase. Since the Km of brain hexokinase is very low (~50 μm) and NMR sensitivity in vivo generally is too low to detect such small concentrations of glucose, brain glucose concentrations measured by NMR that are close to zero indicate that metabolism is limited by the glucose available to the brain cell. The general consensus is that brain glucose transport is not rate-limiting for metabolism under normal circumstances. We have recently shown in the conscious human and the α-chloralose-anesthetized rat that the maximal sustainable rate of glucose consumption is approximately 60–90% above the basal rate of glucose metabolism.21,24 This may, however, not be the case under conditions of extreme metabolic activation or during hypoglycemia.
Previously, models of brain glucose transport have been evaluated at normal or hyperglycemic conditions only.21,22,115,129,130 A recent study extended the brain glucose concentrations measurements to hypoglycemia using 13C NMR spectroscopy.24 The concentrations measured by 13C NMR were found to be in excellent agreement with those predicted by the reversible Michaelis–Menten model as well as those measured by 1H NMR spectroscopy [Fig. 11(B)]. Interestingly, when the brain glucose concentration approached zero, CBF was acutely increased 24 and glycogen degradation started,131 all of which points to brain glucose being important in activating cerebral defenses against a deficiency in fuel supply.
Studies have reported that over a 45 min period of forepaw stimulation, oxidative glucose metabolism was increased by more than three-fold.112,132 Such an increase in cerebral glucose metabolism is clearly beyond what transport across the blood–brain barrier can sustain alone and the implication is that other sources of fuel must have been increasingly utilized.
BRAIN GLYCOGEN, THE FORGOTTEN ENERGY STORE
One fuel source that is endogenous to the brain is glycogen, which is present in the brain in measurable quantities and appears to be essential for brain function. However, the brain glycogen concentration is small compared to the basal metabolic rate of the brain, even though brain glycogen is typically present in quantities that exceed those of tissue glucose in the brain. Textbook reasoning has been that brain glycogen is unlikely to play a role as a significant glucose reservoir, as it may be consumed within minutes during, e.g. hypoglycemia. However, during hypoglycemia, glycogen needs to account for only part of the total glucose metabolic rate and hence can survive longer periods of sustained hypoglycemia. Similar to glucose, brain glycogen is rapidly eliminated in post-mortem tissue,17,133,134 therefore, its direct biochemical measurement is difficult. Recent studies suggest that, traditionally, brain glycogen content may have been underestimated.135,136 Localized 13C NMR spectroscopy has the unique capability of following brain glycogen metabolism longitudinally, employing a much smaller number of animals than would be used with biochemical extraction. Our results showed that brain glycogen indeed was only slowly degraded during hypoglycemia. This degradation started when brain glucose approached zero [Fig. 12(A)] and became rate-limiting for metabolism,131,137 as discussed above. Interestingly, at this point cerebral blood flow was also increased abruptly, indicating an attempt by the brain to increase fuel supply for glycolysis, apparently by decreasing the arterio-venous gradient for glucose.24 The rate of brain glycogen degradation during hypoglycemia implied that brain glycogen accounted for the majority of the glucose supply deficit during the hypoglycemic period.131 Together with the apparent stability of glycogen in the non-stimulated brain at eu- or hyperglycemia,17,138 these data suggest that brain glucose plays an important regulatory role in cerebral glycogenolysis. These studies also showed that brain glycogen increased above the basal level and beyond following a single episode of hypoglycemia [Fig. 12(A)]. This rebound or super-compensation of brain glycogen may result in increased neuroprotection. In this context it is interesting to note that glycogen metabolism also seems to be insulin-sensitive in the brain, as in most tissues. Therefore, brain glycogen metabolism is likely to be influenced by factors such as insulin and glucagon that are known to be deranged in diabetes. It has been proposed that brain glycogen metabolism may be a factor involved in the mechanism of the hypoglycemia unawareness syndrome observed clinically in patients with type I diabetes,131,138 perhaps through the enhanced neuroprotective effect of increased brain glycogen.
Figure 12.
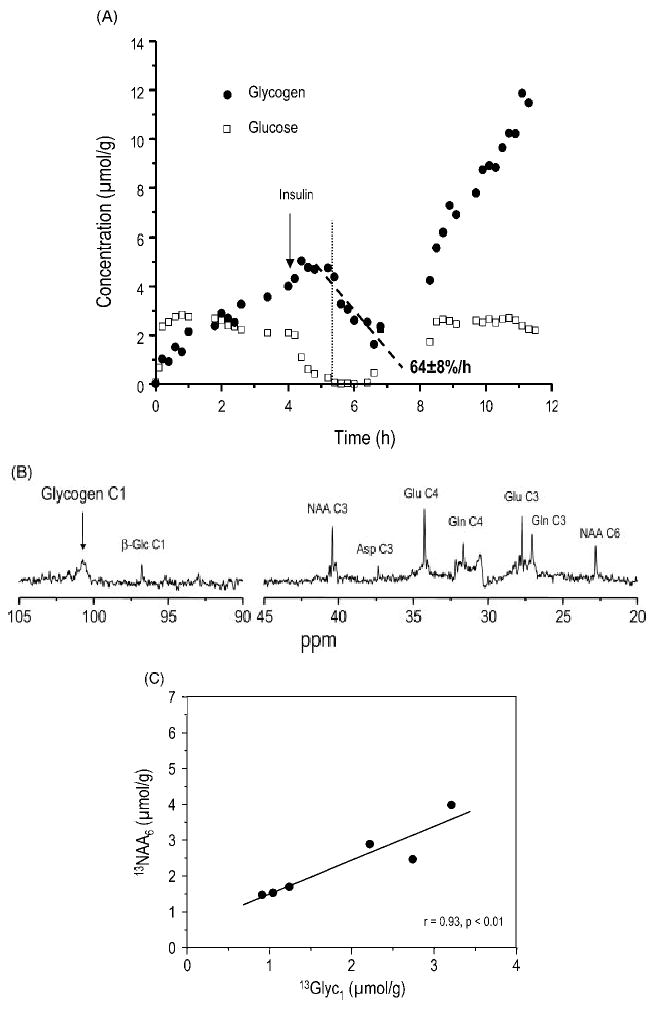
Brain glycogen metabolism in the rat. (A) Time-course of glycogen C1 and glucose C1 before, during and after hypoglycemia, which was induced by administering insulin, starting at the point indicated by the arrow. During hypoglycemia, plasma glucose concentration was below 2 mm for 2 h. The vertical dotted line indicates the start of glycogenolysis during hypoglycemia, which coincided with the time point where brain glucose approached zero. The dashed line highlights the slow rate of glycogenolysis during hypoglycemia, expressed as percentages of the pre-hypoglycemic glycogen C1. From Choi et al.131 Reprinted from J. Neurosci. Res. Copyright © John Wiley & Sons, Ltd. (B) Label incorporation into glycogen and glucose C1, as well as several metabolites was observed in a 13C NMR spectrum acquired from a rat brain after 99% enriched [1-13C] glucose had been administered for over 48 h ad libitum. Processing consisted of 10 Hz line-broadening and zero-filling prior to Fourier transformation. The spectrum is shown without baseline correction. (C) Comparison between label incorporation into brain glycogen C1 and NAA C6 (solid circles) indicating slow turnover of brain glycogen in the awake rat. The solid line indicates the result of linear regression (r = 0.93, p < 0.01, n = 6). From this relationship, total brain glycogen content was estimated at 3.3 μmol glucosyl units/g wet weight. (B) and (C) are from Choi et al.138 Reprinted from Neurochem. Int. Copyright © 2003, with permission from Elsevier
Thus glycogen probably is a viable and important store of glucose equivalents in the brain, whose metabolism is affected by hormones, neurotransmitters and second messengers.139
Studies have suggested that brain glycogen metabolism may be altered during focal activation.140,141 Our studies are consistent with a role for brain glycogen during extreme activation for the following reason: under conditions of extreme local glucose metabolic demand, it is conceivable that the brain glucose concentration could briefly fall into the range of the Km of hexokinase leading to glycogenolysis and subsequent resynthesis at some later time point. In this scenario, glucose must become rate-limiting for metabolism, which can be inferred from a study that reported during electrical stimulation of the forepaw112,132 increases in oxidative glucose consumption that were likely to exceed the sustainable supply in brain glucose transport across the blood–brain barrier.
Anesthesia or depressed electrical activity have been reported to have an effect on brain glycogen concentrations.115,140,142 It has therefore been argued that small changes in brain lactate during stimulation are due to a futile cycling of glucose in and out of glycogen (brain glycogen shunt),143 which would link brain glycogen metabolism to brain activity, even when brain glucose is not rate-limiting for metabolism. However, in the awake rat brain, extremely slow rates of bulk brain glycogen turnover were observed,138 as illustrated in Fig. 12(B) and (C). These observations together with the apparent influence of low brain glucose on glycogenolysis (see above) make this a rather unlikely scenario. Nevertheless, during severe focal activation it is possible that brain glycogen could in part be activated. Changes in labeled glucose incorporation reported previously144 may not reflect the entire glycogen molecule.
Because all previous studies measured brain glycogen metabolism in animals, the question remained as to whether brain glycogen metabolism may be faster in the conscious human brain. Brain glycogen metabolism has never been measured in the human brain and 13C NMR is the only technique that can provide this insight. We have recently adapted the localization method (see above on localization methods and Fig. 5) for measuring brain glycogen in humans and demonstrated that a reproducible measurement of the brain glycogen signal was indeed possible in the human brain18 [Fig. 13(A)]. These initial results furthermore demonstrated that brain glycogen metabolism was extremely slow in subjects measured in the awake, resting condition [Fig. 13(B)]. This observation was in excellent agreement with previous studies showing that, under the conditions of this study (plasma glucose at euglycemia or higher with concomitant hyperinsulinemia), the brain glucose concentration is well above the Km of hexokinase,20,21,129 thereby eliminating the need for appreciable glycogen activation. In fact, the flux through glycogen synthase at hyperinsulinemia was estimated at 0.1–0.2 μmol/g/h. As a consequence, a brain glycogen pool of a few mm is expected to have a turnover time on the order of several days to a week. These findings suggest that glycogen metabolism is a negligible factor in the energy metabolism of the conscious unstimulated human brain at euglycemia and above. Since concentration changes are induced by a mismatch in catabolic and anabolic flux of glycogen, it is, however, reasonable to assume that elevated brain glycogen concentrations, such as the ones seen after hypoglycemia in the rat, may take days to weeks to be normalized, which incidentally is consistent with the time it takes to restore the hypoglycemia unawareness syndrome in diabetes.145
Figure 13.
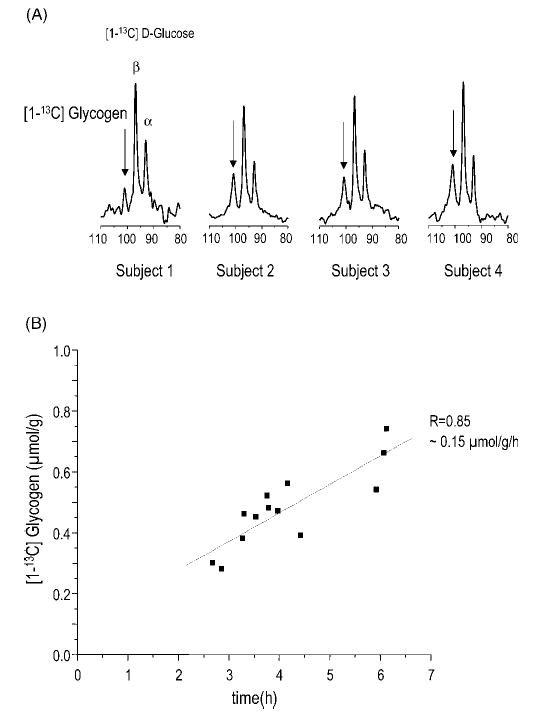
Measurement of glycogen in the human brain. (A) Demonstrates the detection of the brain glycogen signal in four different subjects (arrows) along with the glucose C1 resonances. Shown is the spectral region containing the glycogen C1 and glucose C1 resonances. (B) The increase in the quantified glycogen C1 signal represents the accumulation of [1-13C] glycogen, which occurred at an extremely slow rate on the order of 0.15 μmol/g/h in the human brain, as illustrated in the graph containing measurements from three different studies. From Oz et al.18 Reprinted from Neurochem. Int. Copyright © 2003, with permission from Elsevier
GLUTAMATE C4 TURNOVER: OXYGEN METABOLISM
Because of the ever increasing importance of functional MRI, which depends on an activation-dependent change in the venous concentration of deoxyhemoglobin, the question whether there is tight coupling between glucose and oxygen consumption in the brain has become of paramount importance. The landmark study by Fox and Raichle in the late 1980s suggested that there is indeed a large increase in glucose metabolism that exceeds the changes in oxygen metabolism.146 The concept of uncoupled oxygen metabolism has been supported by studies reporting small increases in brain lactate during focal activation147,148 that initially were very controversial149 and that are very difficult to perform. The relatively small magnitude of change in brain lactate is difficult to reconcile with the reported large uncoupling between oxygen and glucose consumption150 and explanations linking the lactate increase to brain glycogen at present appear unlikely (see above). To address this question, it is useful to measure the TCA cycle activity in the brain. Because glucose is the dominant substrate for metabolism, the flow of 13C label from glucose into the TCA cycle is likely to reflect the cerebral oxygen consumption. In intact tissue the transfer of 13C label into the glutamate pool has been linked to TCA cycle flux. The effect of focal activation on cerebral glutamate turnover thus is expected to reflect cerebral oxygen metabolism, at least in part. Using hemi-field activation, glutamate turnover was measured in the activated hemisphere and simultaneously in a control area placed symmetrically to the midline separating the two brain hemispheres. Comparison of the rate of label incorporation indicated a significant difference between the activated and the resting voxels. Modeling of the data indicated that oxygen consumption increased at most by 30%, which is approximately half of the cerebral blood flow increase measured using this stimulation paradigm.62 This study supports the idea that oxygen consumption increases are less than the associated cerebral blood flow increases, leading to a net decrease in deoxyhemoglobin content during focal activation, which forms the basis of blood-oxygen-level-dependent functional MRI.151 Other studies have also reported changes in the glutamate C4 turnover rate in response to altered electrical activity.39,132,152 However, it has been noted in the heart that the labeling of glutamate can change without a change in oxygen consumption,153 which was explained by changes in a subcellular isotope flux that contributes to the labeling rate of glutamate, as discussed below.
THE IMPORTANCE OF THE MALATE–ASPARTATE SHUTTLE IN REGULATING CEREBRAL GLUCOSE METABOLISM AND ISOTOPE FLUX
Measurements of Krebs cycle flux from the flow of label from glucose C1 to glutamate C4 are inherently affected by the assumptions made in the modeling. Of critical importance in that regard is the fact that most amino acids are located in the cytosol, whereas the reactions leading to the scrambling of the label take place in the mitochondrion. Therefore, transport has to occur across the highly charged inner mitochondrial membrane. It is likely that the transport of glutamate (a charged amino acid, whose transport is generally associated with concomitant ion transport) or 2-oxoglutarate is controlled, since rapid transport of these acids is likely to interfere with chemiosmosis. Indeed, this exchange rate Vx was found to be comparable to the flux through pyruvate dehydrogenase, VPDH, in most recent studies of the intact brain,9,115,154 as illustrated by Fig. 14(A), consistent with what has been reported in most other tissues.40,116,153,155 In the brain and other tissues, isotope exchange can occur via the malate-aspartate shuttle [illustrated by the scheme in Fig. 14(B)]. The observation that Vx was comparable to the flux through pyruvate dehydrogenase (Table 2) implied that the malate–aspartate shuttle may be a major mechanism mediating the exchange of label across the mitochondrial membrane,156 also pointed out elsewhere.9,53,153,157 Even transamination of glutamate may not be a very fast reaction in vivo: some studies suggest that the transamination rates in the brain are within one order of magnitude of the metabolic rates.158
Figure 14.
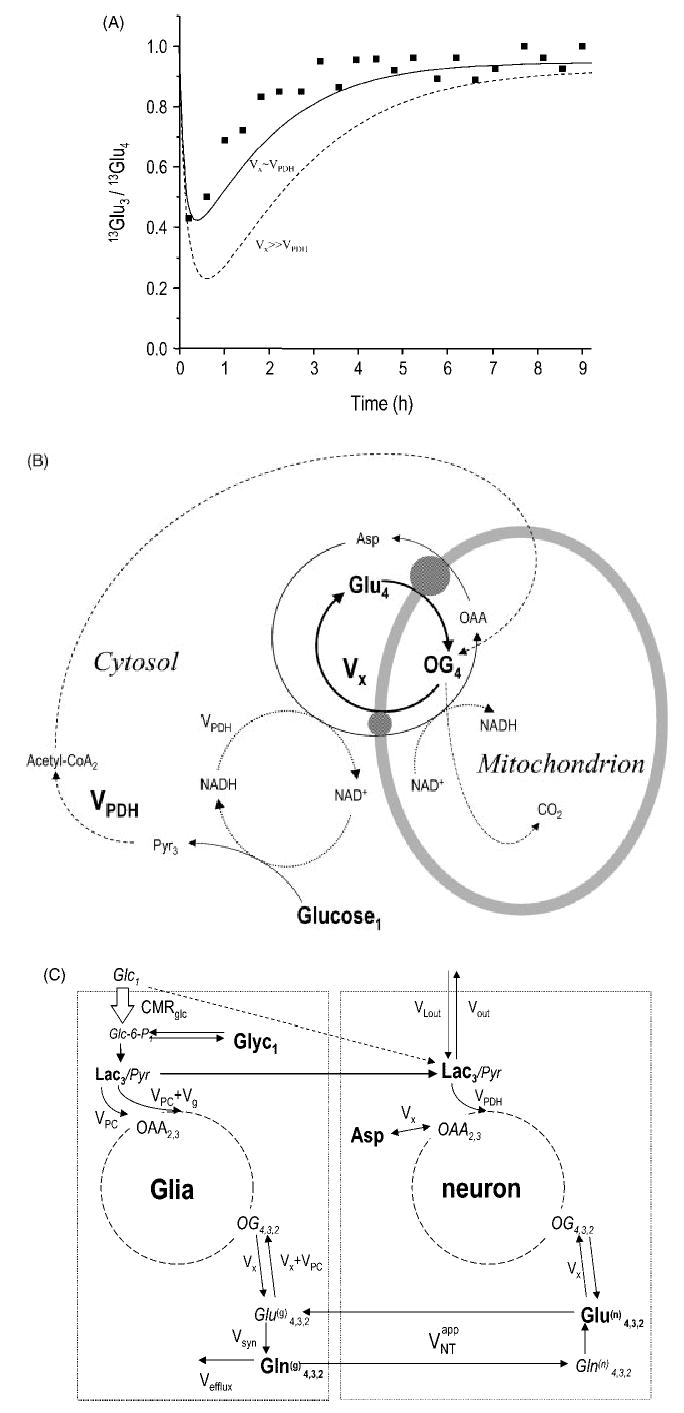
Modeling of cerebral neurotransmitter and amino acid metabolism labeling from glucose. (A) Direct experimental evidence of a slow exchange between 2-oxoglutarate and glutamate in vivo by comparing the rate of labeling for the C3 and the C4 of glutamate. The solid line indicates calculation using the parameters from Choi et al.115 The dashed line was calculated after fitting to the 13Glu4(t) and 13Gln4(t) data only, which resulted in VPDH = 0.15 μmol/g/min when assuming Vx = 57 μmol/g/min, as in Sibson et al.39, but this was clearly inconsistent with the relative rate of labeling of the C3 resonance in glutamate. (B) The link between oxidative glucose consumption and glutamate labeling is established by active exchange between 2-oxoglutarate (OG) and glutamate (Glu), this flux is indicated by Vx. This exchange, as well as that between oxaloacetate and aspartate, is mediated by the malate-aspartate shuttle.53 In short, the NADH produced by oxidative metabolism of pyruvate at the rate VPDH must be recycled. This is accomplished by the malate-aspartate shuttle, which transports reducing equivalents produced from the cytosol to the mitochondrion, indicated by the fluxes. The solid lines indicate the isotope flow between the TCA cycle and the cytosolic amino acids, the dashed lines the oxidative metabolism of pyruvate, the dotted lines the NADH/NAD+ redox reaction, and the subscripts the flow of label from glucose C1 (or C6) to glutamate. (C) A mathematical model of compartmentalized brain metabolism, from Gruetter et al.53 Reprinted from Neurochem. Int. Copyright ©2003, with permission from Elsevier. The glial compartment is on the left and the neuronal on the right. Abbreviations for metabolic fluxes: Vg + VPC, glial pyruvate dehydrogenase flux; Vefflux, loss of Gln from the glial compartment; Vout, VLout, label dilution and exchange of lactate across the blood–brain barrier. The metabolites in bold are the signals measurable by NMR in vivo. The subscripted numerals indicate the positions labeled due to metabolism of glucose labeled at the C1 position, i.e. Glc1
Table 2.
Relative fluxes in human visual cortex (mean ± SE) as measured by 13C NMR following glucose infusion (from Gruetter et al.9)
| Relative flux rate | |
|---|---|
| VNT/CMRglca | 41 ± 14% |
| Oxidative ATP/total ATP production in glia | 80 ± 5% |
| Glial/neuronal ATP synthesis | 16 ± 9% |
| Vx/VPDH | 100 ± 35% |
For a definition of fluxes see Fig. 14(C) and Gruetter et al.9
GLUTAMINE TURNOVER: ANOTHER HALLMARK OF CEREBRAL COMPARTMENTATION
Brain metabolism is exquisitely compartmentalized, with at least two major compartments (attributed to the ‘neuronal’ and ‘glial’ compartments) that are differentiated by the size of the respective glutamate pools associated with the Krebs cycle and that are metabolically linked by the so-called glutamate-glutamine cycle.159,160 It has now become accepted that the large glutamate pool is in the neuronal compartment and the small glutamate pool in the glial compartment.161,162 The compartmentation extends further to a number of enzymes, such as glutamine synthetase163 and pyruvate carboxylase,164 being almost exclusively in the glial compartment. Furthermore, glycogen appears to be mainly in the glial compartment in the normal adult brain.165 The compartmentation of brain metabolism and associated enzymes is summarized in more detail elsewhere.9,49,50 The scheme in Fig. 14(C) summarizes some of the salient features that can be exploited in modeling brain metabolism. It is of interest to note that the exclusive glial localization of glutamine synthetase implies that the observation of glutamine synthesis in vivo, first achieved in the human brain,47,48 is a direct manifestation of glial metabolism, whereas the observation of label incorporation into glutamate implies a mainly neuronal event. Clearly, glutamine synthesis can be measured non-invasively by 13C NMR spectroscopy, as shown in Fig. 4, which demonstrates the ability of 13C NMR spectroscopy to study cerebral compartmentation non-invasively.
ASTROCYTIC ENERGY METABOLISM AND ANAPLEROSIS
A key feature of cerebral compartmentation is the inactivation of neurotransmitter glutamate by uptake into perisynaptic astrocytes and conversion into electrophysiologically inactive glutamine.158,166–168 Clearly, this mechanism implies a much more active role for astrocytes than is conventionally assumed, since the conversion of neurotransmitter glutamate to glutamine involves glial energy metabolism.169–171 The neuron–astrocyte pair thus has to be considered the functional unit (the ‘tripartite synapse’ containing the pre- and postsynaptic neuron and the astrocyte) intimately involved in achieving chemical transmission, as has been proposed in the last decade by Magistretti and others.52,172,173
The link between astrocytes and neurons is generally accepted from a metabolic and from a neurophysiological standpoint,174 yet differences exist as to the precise relationship between the metabolic rates and the specific energetics involved.9,39,115,175 For example, a recent proposal suggested that the rate of glutamate/glutamine inter-conversion (‘glutamate-glutamine cycle’), identified in the scheme in Fig. 14(C) by VNTapp, is equal to the glucose consumption rate.39 Our recent measurements (summarized in Table 2) imply that, even when assuming that changes in glutamate neurotransmission result in a 1:1 stoichiometric change of glucose metabolism with VNTapp (which is different from what has been proposed39), glucose metabolism at VNT = 0 (‘isoelectricity’) is approximately half of that at normal resting conditions, which is in good agreement with reported rates of oxygen consumption during isoelectric pentobarbital anesthesia in humans.176 The proposal put forth by Shulman and coworkers39,51 is intriguing as it emphasizes further the coupling between neurons and glia at the level of energy metabolism as put forward earlier by others.173
Astrocytes have significant oxidative capacity to generate ATP, which shall be illustrated with two experimental observations. First, anaplerosis, a mitochondrial reaction confined to the glial compartment, mediated by pyruvate carboxylase, is now generally accepted to have significant activity in vivo.8,9,31,69 Anaplerosis occurs in the glial compartment and labels the TCA cycle intermediates in a different way than does pyruvate dehydrogenase. If pyruvate carboxylase was a substantial flux, VPC, in the brain in vivo, this should result in a differential labeling of glutamate and glutamine due to their differential distribution between astrocytes and neurons. Indeed, it was concluded from the differential label distribution in glutamate and glutamine (Table 3) that pyruvate carboxylase activity was substantial8,9,31,33 and contributed approximately 25% to the flux through glutamine synthetase Vsyn,8 which was comparable to the numbers subsequently reported in the rat brain using [2-13C] glucose infusions.89 Net glutamine synthesis (via pyruvate carboxylase) was shown to generate excess amounts of ATP oxidatively, thereby generating approximately one-third of the ATP per glucose molecule compared to that from complete glucose oxidation.53 The second experimental evidence supporting the presence of significant oxidative metabolism in astrocytes stems from the fact that acetate is known to be exclusively metabolized in astrocytes by the TCA cycle,177,178 which can only occur by oxidative metabolism.179 Interestingly, the metabolic rates of the glial compartment relative to the neuronal compartment reported from the acetate studies in the human brain71,87 confirmed the earlier measurement of relative glial ATP synthesis in the human brain,9 tabulated in Table 2.
Table 3.
Label incorporation into glutamine (Gln) relative to glutamate (Glu) in human visual cortex as measured by 13C NMR following glucose infusion (mean ± SEM)
| C2 | C3 | C4 | |
|---|---|---|---|
| Gln/Glu (45 ml volume9) | 0.41 ± 0.02 | 0.28 ± 0.04* | 0.30 ± 0.01 |
| Gln/Glu (72 ml volume8) | 0.39 ± 0.03 | 0.18 ± 0.01* | 0.26 ± 0.02 |
Significantly different between C2 and C3 (p < 0.05).
The mainly oxidative glial metabolism is compatible with the proposal that lactate produced in astrocytes is a fuel for oxidative metabolism in neurons. For example, if one-sixth of the ATP production from glucose is in the glial compartment, five-sixths of the lactate remain for export to neurons, when assuming the extreme case that phosphorylation of glucose is an exclusively glial process.
OUTLOOK
As illustrated above and summarized in the abstract, localized 13C NMR spectroscopy has already made many substantial contributions to our understanding of brain metabolism, e.g. understanding glucose transport, measuring brain glutamate and glutamine turnover, quantifying astrocytic and brain glycogen metabolism. Pivotal achievements include the demonstration that pyruvate carboxylase activity is substantial in vivo, and that glutamatergic neurotransmission can potentially be quantified in vivo. Future developments on the technical side probably will include the extension of these studies to GABA metabolism in vivo, and the characterization of the various fluxes that can be measured in different brain areas. Some investigators have already begun applying 13C NMR spectroscopy to disease states in humans88,123 and animal models of disease,154 and future expansion is to be expected in this area as well. The low sensitivity and technical complexity, including the administration of 13C label, will probably remain obstacles that need to be overcome for a successful 13C NMR line of research. The most important issue for this field to flourish, however, is the emergence of a critical mass of several independent research groups whose competition will foster the development of this new investigative tool of localized in vivo 13C NMR spectroscopy.
Acknowledgments
The encouragement and support from colleagues at the Center for MR Research is appreciated, in particular Drs Ugurbil, Garwood, Seaquist, Chen, Vaughan and Kim. We thank Dr Ivan Tkac for careful reading of the manuscript and for helpful suggestions.
References
- 1.Chance EM, Seeholzer SH, Kobayashi K, Williamson JR. Mathematical analysis of isotope labeling in the citric acid cycle with applications to 13C NMR studies in perfused rat hearts. . J Biol Chem. 1983;258:13785–13794. [PubMed] [Google Scholar]
- 2.Malloy C, Sherry A, Jeffrey F. Analysis of tricarboxylic acid cycle of the heart using 13C isotope isomers. . Am J Physiol. 1990;259:H987–H995. doi: 10.1152/ajpheart.1990.259.3.H987. [DOI] [PubMed] [Google Scholar]
- 3.Weiss RG, Stern MD, de Albuquerque CP, Vandegaer K, Chacko VP, Gerstenblith G. Consequences of altered aspartate amino-transferase activity on 13C-glutamate labelling by the tricarboxylic acid cycle in intact rat hearts. . Biochim Biophys Acta. 1995;1243:543–548. doi: 10.1016/0304-4165(95)00031-6. [DOI] [PubMed] [Google Scholar]
- 4.Yu X, Alpert NM, Lewandowski ED. Modeling enrichment kinetics from dynamic 13C NMR spectra: theoretical analysis and practical considerations. . Am J Physiol. 1997;41:C2037–C2048. doi: 10.1152/ajpcell.1997.272.6.C2037. [DOI] [PubMed] [Google Scholar]
- 5.van Zijl PCM, Rothman D. NMR studies of brain C-13-glucose uptake and metabolism—present status. . Magn Reson Imag. 1995;13:1213–1221. doi: 10.1016/0730-725x(95)02034-q. [DOI] [PubMed] [Google Scholar]
- 6.Mason GF, Rothman DL, Behar KL, Shulman RG. NMR determination of the TCA cycle rate and alpha-ketoglutarate/glutamate exchange rate in rat brain. . J Cereb Blood Flow Metab. 1992;12:434–447. doi: 10.1038/jcbfm.1992.61. [DOI] [PubMed] [Google Scholar]
- 7.Bachelard H, Badar-Goffer R. NMR spectroscopy in neurochemistry. . J Neurochem. 1993;61:412–429. doi: 10.1111/j.1471-4159.1993.tb02141.x. [DOI] [PubMed] [Google Scholar]
- 8.Gruetter R, Seaquist E, Kim S-W, Ugurbil K. Localized in vivo13C NMR of glutamate metabolism. Initial results at 4 Tesla. . Dev Neurosci. 1998;20:380–388. doi: 10.1159/000017334. [DOI] [PubMed] [Google Scholar]
- 9.Gruetter R, Seaquist ER, Ugurbil K. A mathematical model of compartmentalized neurotransmitter metabolism in the human brain. . Am J Physiol. 2001;281:E100–E112. doi: 10.1152/ajpendo.2001.281.1.E100. [DOI] [PubMed] [Google Scholar]
- 10.Fried R, Beckmann N, Keller U, Ninnis R, Stalder G, Seelig J. Early glycogenolysis and late glycogenesis in human liver after intravenous administration of galactose. . Am J Physiol. 1996;33:G14–G19. doi: 10.1152/ajpgi.1996.270.1.G14. [DOI] [PubMed] [Google Scholar]
- 11.Rothman DL, Magnusson I, Katz LD, Shulman RG, Shulman GI. Quantitation of hepatic glycogenolysis and gluconeogenesis in fasting humans with 13C NMR. Science. 1991;254:573–576. doi: 10.1126/science.1948033. [DOI] [PubMed] [Google Scholar]
- 12.Perseghin G, Price TB, Petersen KF, Roden M, Cline GW, Gerow K, Rothman DL, Shulman GI. Increased glucose transport-phosphorylation and muscle glycogen synthesis after exercise training in insulin-resistant subjects. . New Engl J Med. 1996;335:1357–1362. doi: 10.1056/NEJM199610313351804. [DOI] [PubMed] [Google Scholar]
- 13.Van Den Bergh AJ, Houtman S, Heerschap A, Rehrer NJ, Van Den Boogert HJ, Oeseburg B, Hopman MT. Muscle glycogen recovery after exercise during glucose and fructose intake monitored by 13C-NMR. . J Appl Physiol. 1996;81:1495–1500. doi: 10.1152/jappl.1996.81.4.1495. [DOI] [PubMed] [Google Scholar]
- 14.Jehenson P, Duboc D, Bloch G, Syrota A. Diagnosis of muscular glycogenosis by in vivo natural abundance 13C NMR spectroscopy. . Neuromusc Dis. 1991;1:99–101. doi: 10.1016/0960-8966(91)90056-x. [DOI] [PubMed] [Google Scholar]
- 15.Saner M, McKinnon G, Boesiger P. Glycogen detection by in vivo13C NMR: a comparison of proton decoupling and polarization transfer. . Magn Reson Med. 1992;28:65–73. doi: 10.1002/mrm.1910280107. [DOI] [PubMed] [Google Scholar]
- 16.Laughlin MR, Morgan C, Barrett EJ. Hypoxemic stimulation of heart glycogen synthase and synthesis. Effects of insulin and diabetes mellitus. Diabetes. 1991;40:385–390. doi: 10.2337/diab.40.3.385. [DOI] [PubMed] [Google Scholar]
- 17.Choi IY, Tkac I, Ugurbil K, Gruetter R. Noninvasive measurements of [1-(13)C]glycogen concentrations and metabolism in rat brain in vivo. J Neurochem. 1999;73:1300–1308. doi: 10.1046/j.1471-4159.1999.0731300.x. [DOI] [PubMed] [Google Scholar]
- 18.Oz G, Henry PG, Seaquist ER, Gruetter R. Direct, noninvasive measurement of brain glycogen metabolism in humans. . Neurochem Int. 2003;43:323–329. doi: 10.1016/s0197-0186(03)00019-6. [DOI] [PubMed] [Google Scholar]
- 19.Roussel R, Velho G, Carlier PG, Jouvensal L, Bloch G. In vivo NMR evidence for moderate glucose accumulation in human skeletal muscle during hyperglycemia. . Am J Physiol. 1996;34:E434–E438. doi: 10.1152/ajpendo.1996.271.3.E434. [DOI] [PubMed] [Google Scholar]
- 20.Gruetter R, Novotny EJ, Boulware SD, Rothman DL, Mason GF, Shulman GI, Shulman RG, Tamborlane WV. Direct measurement of brain glucose concentrations in humans by 13C NMR spectroscopy. . Proc Natl Acad Sci USA. 1992;89:1109–1112. doi: 10.1073/pnas.89.3.1109. [DOI] [PMC free article] [PubMed] [Google Scholar]
- 21.Gruetter R, Ugurbil K, Seaquist ER. Steady-state cerebral glucose concentrations and transport in the human brain. . J Neurochem. 1998;70:397–408. doi: 10.1046/j.1471-4159.1998.70010397.x. [DOI] [PubMed] [Google Scholar]
- 22.Mason GF, Behar KL, Rothman DL, Shulman RG. NMR determination of intracerebral glucose concentration and transport kinetics in rat brain. . J Cereb Blood Flow Metab. 1992;12:448–455. doi: 10.1038/jcbfm.1992.62. [DOI] [PubMed] [Google Scholar]
- 23.Jucker BM, Rennings AJ, Cline GW, Petersen KF, Shulman GI. In vivo NMR investigation of intramuscular glucose metabolism in conscious rats. . Am J Physiol. 1997;273:E139–E148. doi: 10.1152/ajpendo.1997.273.1.E139. [DOI] [PubMed] [Google Scholar]
- 24.Choi IY, Lee SP, Kim SG, Gruetter R. In vivo measurements of brain glucose transport using the reversible Michaelis–Menten model and simultaneous measurements of cerebral blood flow changes during hypoglycemia. . J Cereb Blood Flow Metab. 2001;21:653–663. doi: 10.1097/00004647-200106000-00003. [DOI] [PubMed] [Google Scholar]
- 25.Sonnewald U, Gribbestad IS, Westergaard N, Nilsen G, Unsgard G, Schousboe A, Petersen SB. Nuclear magnetic resonance spectroscopy: biochemical evaluation of brain function in vivo and in vitro. Neurotoxicology. 1994;15:579–590. [PubMed] [Google Scholar]
- 26.Leibfritz D. An introduction to the potential of 1H-, 31P- and 13C-NMR-spectroscopy. Anticancer Res. 1996;16:1317–1324. [PubMed] [Google Scholar]
- 27.Szyperski T, Neri D, Leiting B, Otting G, Wuthrich K. Support of 1H NMR assignments in proteins by biosynthetically directed fractional 13C-labeling. . J Biomol NMR. 1992;2:323–334. doi: 10.1007/BF01874811. [DOI] [PubMed] [Google Scholar]
- 28.Ugurbil K, Brown TR, den Hollander JA, Glynn P, Shulman RG. High-resolution 13C nuclear magnetic resonance studies of glucose metabolism in Escherichia coli. Proc Natl Acad Sci USA. 1978;75:3742–3746. doi: 10.1073/pnas.75.8.3742. [DOI] [PMC free article] [PubMed] [Google Scholar]
- 29.Brand A, Richter-Landsberg C, Leibfritz D. Multinuclear NMR studies on the energy metabolism of glial and neuronal cells. . Dev Neurosci. 1993;15:289–298. doi: 10.1159/000111347. [DOI] [PubMed] [Google Scholar]
- 30.Sonnewald U, Gribbestad IS, Westergaard N, Nilsen G, Unsgard G, Schousboe A, Petersen Nuclear magnetic resonance spectroscopy: biochemical evaluation of brain function in vivo and in vitro. Neurotoxicology. 1994;15:579–590. [PubMed] [Google Scholar]
- 31.Lapidot A, Gopher A. Cerebral Metabolic compertmentation. Estimation of glucose flux via pyruvate carboxylase/pyruvate dehydrogenase by 13C NMR isotopomer analysis of [U-13C] d-glucose metabolites. . J Biol Chem. 1994;269:27198–27208. [PubMed] [Google Scholar]
- 32.Cerdan S, Kunnecke B, Seelig J. Cerebral metabolism of [1,2-13C2]acetate as detected by in vivo and in vitro13C NMR. . J Biol Chem. 1990;265:12916–12926. [PubMed] [Google Scholar]
- 33.Martin M, Portais JC, Labouesse J, Canioni P, Merle M. [1-13C]glucose metabolism in rat cerebellar granule cells and astrocytes in primary culture. Evaluation of flux parameters by 13C- and 1H-NMR spectroscopy. . Eur J Biochem. 1993;217:617–625. doi: 10.1111/j.1432-1033.1993.tb18284.x. [DOI] [PubMed] [Google Scholar]
- 34.Badar-Goffer RS, Ben-Yoseph O, Bachelard HS, Morris PG. Neuronal–glial metabolism under depolarizing conditions. A 13C NMR study. . Biochem J. 1992;282:225–230. doi: 10.1042/bj2820225. [DOI] [PMC free article] [PubMed] [Google Scholar]
- 35.Malloy CR, Sherry AD, Jeffrey FM. Carbon flux through citric acid cycle pathways in perfused heart by 13C NMR spectroscopy. FEBS Lett. 1987;212:58–62. doi: 10.1016/0014-5793(87)81556-9. [DOI] [PubMed] [Google Scholar]
- 36.Alger JR, Sillerud LO, Behar KL, Gillies RJ, Shulman RG, Gordon RE, Shae D, Hanley PE. In vivo carbon-13 nuclear magnetic resonance studies of mammals. Science. 1981;214:660–662. doi: 10.1126/science.7292005. [DOI] [PubMed] [Google Scholar]
- 37.Behar KL, Petroff OA, Prichard JW, Alger JR, Shulman RG. Detection of metabolites in rabbit brain by 13C NMR spectroscopy following administration of [1-13C]glucose. . Magn Reson Med. 1986;3:911–920. doi: 10.1002/mrm.1910030611. [DOI] [PubMed] [Google Scholar]
- 38.Sibson NR, Dhankhar A, Mason GF, Behar KL, Rothman DL, Shulman RG. In vivo13C NMR measurements of cerebral glutamine synthesis as evidence for glutamate–glutamine cycling. . Proc Natl Acad Sci USA. 1997;94:2699–2704. doi: 10.1073/pnas.94.6.2699. [DOI] [PMC free article] [PubMed] [Google Scholar]
- 39.Sibson NR, Dhankhar A, Mason GF, Rothman DL, Behar KL, Shulman RG. Stoichiometric coupling of brain glucose metabolism and glutamatergic neuronal activity. . Proc Natl Acad Sci USA. 1998;95:316–321. doi: 10.1073/pnas.95.1.316. [DOI] [PMC free article] [PubMed] [Google Scholar]
- 40.Jucker BM, Ren J, Dufour S, Cao X, Previs SF, Cadman KS, Shulman GI. 13C/31P NMR assessment of mitochondrial energy coupling in skeletal muscle of awake fed and fasted rats: relationship with uncoupling protein 3 expression. . J Biol Chem. 2000;50:39279–39286. doi: 10.1074/jbc.M007760200. [DOI] [PubMed] [Google Scholar]
- 41.Rothman DL, Novotny EJ, Shulman GI, Howseman AM, Petroff OA, Mason G, Nixon T, Hanstock CC, Prichard JW, Shulman RG. 1H-[13C] NMR measurements of [4-13C]glutamate turnover in human brain. . Proc Natl Acad Sci USA. 1992;89:9603–9606. doi: 10.1073/pnas.89.20.9603. [DOI] [PMC free article] [PubMed] [Google Scholar]
- 42.Beckmann N, Turkalj I, Seelig J, Keller U. 13C NMR for the assessment of human brain glucose metabolism in vivo. Biochemistry. 1991;30:6362–6366. doi: 10.1021/bi00240a002. [DOI] [PubMed] [Google Scholar]
- 43.Bluml S. In vivo quantitation of cerebral metabolite concentrations using natural abundance 13C MRS at 1.5 T. . J Magn Reson. 1999;136:219–225. doi: 10.1006/jmre.1998.1618. [DOI] [PubMed] [Google Scholar]
- 44.Gruetter R, Rothman DL, Novotny EJ, Shulman RG. Localized 13C NMR spectroscopy of myo-inositol in the human brain in vivo. Magn Reson Med. 1992;25:204–210. doi: 10.1002/mrm.1910250121. [DOI] [PubMed] [Google Scholar]
- 45.Cunnane SC, Williams SC, Bell JD, Brookes S, Craig K, Iles RA, Crawford MA. Utilization of uniformly labeled 13C-polyunsaturated fatty acids in the synthesis of long-chain fatty acids and cholesterol accumulating in the neonatal rat brain. . J Neurochem. 1994;62:2429–2436. doi: 10.1046/j.1471-4159.1994.62062429.x. [DOI] [PubMed] [Google Scholar]
- 46.Gruetter R, Boesch C. Fast, Non-iterative shimming on spatially localized signals: in vivo analysis of the magnetic field along axes. . J Magn Reson. 1992;96:323–334. [Google Scholar]
- 47.Gruetter R. Automatic, localized in vivo adjustment of all first-and second-order shim coils. . Magn Reson Med. 1993;29:804–811. doi: 10.1002/mrm.1910290613. [DOI] [PubMed] [Google Scholar]
- 48.Gruetter R, Novotny EJ, Boulware SD, Mason GF, Rothman DL, Prichard JW, Shulman RG. Localized 13C NMR spectroscopy of amino acid labeling from [1-13C] d-glucose in the human brain. . J Neurochem. 1994;63:1377–1385. doi: 10.1046/j.1471-4159.1994.63041377.x. [DOI] [PubMed] [Google Scholar]
- 49.Bachelard H. Landmarks in the application of 13C-magnetic resonance spectroscopy to studies of neuronal/glial relationships. . Dev Neurosci. 1998;20:277–288. doi: 10.1159/000017322. [DOI] [PubMed] [Google Scholar]
- 50.Cruz F, Cerdan S. Quantitative 13C NMR studies of metabolic compartmentation in the adult mammalian brain. NMR Biomed. 1999;12:451–462. doi: 10.1002/(sici)1099-1492(199911)12:7<451::aid-nbm571>3.0.co;2-e. [DOI] [PubMed] [Google Scholar]
- 51.Rothman DL, Sibson NR, Hyder F, Shen J, Behar KL, Shulman RG. In vivo nuclear magnetic resonance spectroscopy studies of the relationship between the glutamate-glutamine neurotransmitter cycle and functional neuroenergetics. . Phil Trans R Soc Lond B Biol Sci. 1999;354:1165–1177. doi: 10.1098/rstb.1999.0472. [DOI] [PMC free article] [PubMed] [Google Scholar]
- 52.Magistretti PJ, Pellerin L, Rothman DL, Shulman RG. Energy on demand. Science. 1999;283:496–497. doi: 10.1126/science.283.5401.496. [DOI] [PubMed] [Google Scholar]
- 53.Gruetter R. In vivo13C NMR studies of compartmentalized cerebral carbohydrate metabolism. . Neurochem Int. 2002;41:143–154. doi: 10.1016/s0197-0186(02)00034-7. [DOI] [PubMed] [Google Scholar]
- 54.Adriany G, Gruetter R. A half volume coil for efficient proton decoupling in humans at 4 Tesla. . J Magn Reson. 1997;125:178–184. doi: 10.1006/jmre.1997.1113. [DOI] [PubMed] [Google Scholar]
- 55.Gruetter R, Adriany G, Merkle H, Andersen PM. Broadband decoupled, 1H Localized 13C MRS of the human brain at 4 Tesla. . Magn Reson Med. 1996;36:659–664. doi: 10.1002/mrm.1910360503. [DOI] [PubMed] [Google Scholar]
- 56.Choi IY, Tkac I, Gruetter R. Single-shot, three-dimensional ‘non-echo’ localization method for in vivo NMR spectroscopy. . Magn Reson Med. 2000;44:387–394. doi: 10.1002/1522-2594(200009)44:3<387::aid-mrm8>3.0.co;2-3. [DOI] [PubMed] [Google Scholar]
- 57.Sokoloff L, Reivich M, Kennedy C, Des Rosiers MH, Patlak CS, Pettigrew KD, Sakurada O, Shinohara M. The [14C]deoxyglucose method for the measurement of local cerebral glucose utilization: theory, procedure, and normal values in the conscious and anesthetized albino rat. . J Neurochem. 1977;28:897–916. doi: 10.1111/j.1471-4159.1977.tb10649.x. [DOI] [PubMed] [Google Scholar]
- 58.Tyler JL, Strother SC, Zatorre RJ, Alivisatos B, Worsley KJ, Diksic M, Yamamoto YL. Stability of regional cerebral glucose metabolism in the normal brain measured by positron emission tomography. . J Nucl Med. 1988;29:631–642. [PubMed] [Google Scholar]
- 59.Van Zijl PC, Davis D, Eleff SM, Moonen CT, Parker RJ, Strong JM. Determination of cerebral glucose transport and metabolic kinetics by dynamic MR spectroscopy. . Am J Physiol. 1997;273:E1216–E1227. doi: 10.1152/ajpendo.1997.273.6.E1216. [DOI] [PubMed] [Google Scholar]
- 60.Knudsen GM, Pettigrew KD, Paulson OB, Hertz MM, Patlak CS. Kinetic analysis of blood-brain barrier transport of d-glucose in man: quantitative evaluation in the presence of tracer backflux and capillary heterogeneity. . Microvasc Res. 1990;39:28–49. doi: 10.1016/0026-2862(90)90057-x. [DOI] [PubMed] [Google Scholar]
- 61.Pardridge WM. Glucose transport and phosphorylation: which is rate limiting for brain glucose utilization? . Ann Neurol. 1994;35:511–512. doi: 10.1002/ana.410350503. [DOI] [PubMed] [Google Scholar]
- 62.Chen W, Zhu XH, Gruetter R, Seaquist ER, Adriany G, Ugurbil K. Study of tricarboxylic acid cycle flux changes in human visual cortex during hemifield visual stimulation using (1)H-[(13)C] MRS and fMRI. . Magn Reson Med. 2001;45:349–355. doi: 10.1002/1522-2594(200103)45:3<349::aid-mrm1045>3.0.co;2-8. [DOI] [PubMed] [Google Scholar]
- 63.Jehenson P, Bloch G. Elimination of surface signals by a surface-spoiling magnetic field gradient. Theoretical optimization and application to human in vivo NMR spectroscopy. . J Magn Reson. 1991;94:59–72. [Google Scholar]
- 64.Heerschap A, Luyten PR, van der Heyden JI, Oosterwaal LJ, den Hollander JA. Broadband proton decoupled natural abundance 13C NMR spectroscopy of humans at 1.5 T. NMR Biomed. 1989;2:124–132. doi: 10.1002/nbm.1940020309. [DOI] [PubMed] [Google Scholar]
- 65.Van Cauteren M, Miot F, Segebarth CM, Eisendrath H, Osteaux M, Willem R. Excitation characteristics of adiabatic half-passage RF pulses used in surface coil MR spectroscopy. Application to 13C detection of glycogen in the rat liver. . Phys Med Biol. 1992;37:1055–1064. doi: 10.1088/0031-9155/37/5/003. [DOI] [PubMed] [Google Scholar]
- 66.Werner B, Boesch C, Gruetter R, Martin E. Modification of adiabatic pulses for the natural abundance 13-C MRS determination of glycogen during recovery from long-distance runs using surface coils. Proceedings of the 9th Society of Magnetic Resonance Conference, New York, 1990, Abstract; 868.
- 67.Garwood M, Ugurbil K. B1 insensitive adiabatic RF pulses. NMR Basic Principles Prog. 1992;26:110–147. [Google Scholar]
- 68.Bluml S, Adriany G, Gruetter R, Ross B. A Half-Volume coil for proton-decoupled 13C NMR of the human brain at 1.5 Tesla. 6th Annual Meeting of ISMRM, Sydney, 1998, Abstract; 1890.
- 69.Shen J, Petersen KF, Behar KL, Brown P, Nixon TW, Mason GF, Petroff OA, Shulman GI, Shulman RG, Rothman DL. Determination of the rate of the glutamate/glutamine cycle in the human brain by in vivo13C NMR. . Proc Natl Acad Sci USA. 1999;96:8235–8240. doi: 10.1073/pnas.96.14.8235. [DOI] [PMC free article] [PubMed] [Google Scholar]
- 70.Pan JW, Stein DT, Telang F, Lee JH, Shen J, Brown P, Cline G, Mason GF, Shulman GI, Rothman DL, et al. Spectroscopic imaging of glutamate C4 turnover in human brain. . Magn Reson Med. 2000;44:673–679. doi: 10.1002/1522-2594(200011)44:5<673::aid-mrm3>3.0.co;2-l. [DOI] [PubMed] [Google Scholar]
- 71.Lebon V, Petersen KF, Cline GW, Shen J, Mason GF, Dufour S, Behar KL, Shulman GI, Rothman DL. Astroglial contribution to brain energy metabolism in humans revealed by 13C nuclear magnetic resonance spectroscopy: elucidation of the dominant pathway for neurotransmitter glutamate repletion and measurement of astrocytic oxidative metabolism. . J Neurosci. 2002;22:1523–1531. doi: 10.1523/JNEUROSCI.22-05-01523.2002. [DOI] [PMC free article] [PubMed] [Google Scholar]
- 72.Chen W, Adriany G, Zhu XH, Gruetter R, Ugurbil K. Detecting natural abundance carbon signal of NAA metabolite within 12-cm3 localized volume of human brain using 1H-[13C] NMR spectroscopy. . Magn Reson Med. 1998;40:180–184. doi: 10.1002/mrm.1910400203. [DOI] [PubMed] [Google Scholar]
- 73.Pfeuffer J, Tkac I, Provencher SW, Gruetter R. Toward an in vivo neurochemical profile: quantification of 18 metabolites in short-echo-time (1)H NMR spectra of the rat brain. . J Magn Reson. 1999;141:104–120. doi: 10.1006/jmre.1999.1895. [DOI] [PubMed] [Google Scholar]
- 74.Pfeuffer J, Tkac I, Choi I-Y, Merkle H, Ugurbil K, Garwood M, Gruetter R. Localized in vivo1H NMR detection of neurotransmitter labeling in rat brain during infusion of [1-13C] d-glucose. . Magn Reson Med. 1999;41:1077–1083. doi: 10.1002/(sici)1522-2594(199906)41:6<1077::aid-mrm1>3.0.co;2-#. [DOI] [PubMed] [Google Scholar]
- 75.de Graaf RA, Brown PB, Mason GF, Rothman DL, Behar KL. Detection of [1,6-13C2]-glucose metabolism in rat brain by in vivo1H-[13C]-NMR spectroscopy. . Magn Reson Med. 2003;49:37–46. doi: 10.1002/mrm.10348. [DOI] [PubMed] [Google Scholar]
- 76.Gruetter R, Boesch C, Müri M, Martin E, Wüthrich K. A simple design for a double-tuneable probe head for imaging and spectroscopy at high fields. . Magn Reson Med. 1990;15:128–134. doi: 10.1002/mrm.1910150114. [DOI] [PubMed] [Google Scholar]
- 77.Vaughan JT, Hetherington HP, Otu JO, Pan JW, Pohost GM. High frequency volume coils for clinical NMR imaging and spectroscopy. . Magn Reson Med. 1994;32:206–218. doi: 10.1002/mrm.1910320209. [DOI] [PubMed] [Google Scholar]
- 78.Pan JLW, Mason GF, Vaughan JT, Chu WJ, Zhang YT, Hetherington HP. C-13 editing of glutamate in human brain using J-refocused coherence transfer spectroscopy at 4.1 T. . Magn Reson Med. 1997;37:355–358. doi: 10.1002/mrm.1910370308. [DOI] [PubMed] [Google Scholar]
- 79.Mason GF, Pan JW, Chu WJ, Newcomer BR, Zhang Y, Orr R, Hetherington HP. Measurement of the tricarboxylic acid cycle rate in human grey and white matter in vivo by 1H-[13C] magnetic resonance spectroscopy at 4.1 T. . J Cereb Blood Flow Metab. 1999;19:1179–1188. doi: 10.1097/00004647-199911000-00002. [DOI] [PubMed] [Google Scholar]
- 80.Shaka AJ, Keeler J, Freeman R. Evaluation of a new broadband decouling sequence: WALTZ-16. . J Magn Reson. 1983;53:313–340. [Google Scholar]
- 81.Luyten PR, Bruntink G, Sloff FM, Vermeulen JW, van der Heijden J, den Hollander JA, Heerschap A. Broadband proton decoupling in human 31P NMR spectroscopy. NMR Biomed. 1989;1:177–183. doi: 10.1002/nbm.1940010405. [DOI] [PubMed] [Google Scholar]
- 82.Bendall MR. Broadband and narrowband spin decoupling using adiabatic spin flips. . J Magn Reson A. 1995;112:126–129. [Google Scholar]
- 83.Kupce E, Freeman R. Adiabatic pulses for wideband inversion and broadband decoupling. . J Magn Reson A. 1995;115:273–276. [Google Scholar]
- 84.Skinner TE, Bendall MR. Peak power and efficiency in hyperbolic-secant decoupling. . J Magn Reson Ser A. 1996;123:111–115. doi: 10.1006/jmra.1996.0220. [DOI] [PubMed] [Google Scholar]
- 85.van den Bergh AJ, van den Boogert HJ, Heerschap A. Calibration of the 1H decoupling field strength and experimental evaluation of the specific RF absorption rate in 1H-decoupled human 13C-MRS. . Magn Reson Med. 1998;39:642–646. doi: 10.1002/mrm.1910390418. [DOI] [PubMed] [Google Scholar]
- 86.Bax A. A simple method for the calibration of the decoupler radiofrequency field strength. . J Magn Reson. 1983;52:76–80. [Google Scholar]
- 87.Bluml S, Moreno-Torres A, Shic F, Nguy CH, Ross BD. Tricarboxylic acid cycle of glia in the in vivo human brain. NMR Biomed. 2002;15:1–5. doi: 10.1002/nbm.725. [DOI] [PubMed] [Google Scholar]
- 88.Bluml S, Hwang JH, Moreno A, Ross BD. Novel peak assignments of in vivo (13)C MRS in human brain at 1.5 T. . J Magn Reson. 2000;143:292–298. doi: 10.1006/jmre.1999.2001. [DOI] [PubMed] [Google Scholar]
- 89.Sibson NR, Mason GF, Shen J, Cline GW, Herskovits AZ, Wall JE, Behar KL, Rothman DL, Shulman RG. In vivo (13)C NMR measurement of neurotransmitter glutamate cycling, anaplerosis and TCA cycle flux in rat brain during [2-13C]glucose infusion. . J Neurochem. 2001;76:975–989. doi: 10.1046/j.1471-4159.2001.00074.x. [DOI] [PubMed] [Google Scholar]
- 90.Chen W, Ackerman JJ. Localized 13C-[1H] NMR of rat liver in vivo using surface-spoiling gradients. NMR Biomed. 1989;2:267–273. doi: 10.1002/nbm.1940020515. [DOI] [PubMed] [Google Scholar]
- 91.Muller S, Beckmann N. 13C spectroscopic imaging. A simple approach to in vivo13C investigations. . Magn Reson Med. 1989;12:400–406. doi: 10.1002/mrm.1910120313. [DOI] [PubMed] [Google Scholar]
- 92.van den Bergh AJ, van den Boogert HJ, Heerschap A. Hetero-nuclear cross polarization for enhanced sensitivity of in vivo13C MR spectroscopy on a clinical 1.5 T MR system. . J Magn Reson. 1998;135:93–98. doi: 10.1006/jmre.1998.1533. [DOI] [PubMed] [Google Scholar]
- 93.Brown TR, Kincaid BM, Ugurbil K. NMR chemical shift imaging in three dimensions. . Proc Natl Acad Sci USA. 1982;79:3523–3526. doi: 10.1073/pnas.79.11.3523. [DOI] [PMC free article] [PubMed] [Google Scholar]
- 94.Haupt CI, Schuff N, Weiner MW, Maudsley AA. Removal of lipid artifacts in 1H spectroscopic imaging by data extrapolation. . Magn Reson Med. 1996;35:678–687. doi: 10.1002/mrm.1910350509. [DOI] [PMC free article] [PubMed] [Google Scholar]
- 95.Hu X, Patel M, Chen W, Ugurbil K. Reduction of truncation artifacts in CSI by extended sampling using variable TR. . J Magn Reson A. 1995;106:292–296. doi: 10.1006/jmrb.1995.1047. [DOI] [PubMed] [Google Scholar]
- 96.Seaquist ER, Gruetter R. Identification of a high concentration of scyllo-inositol in the brain of a healthy human subject using 1H and 13C NMR. . Magn Reson Med. 1998;39:313–316. doi: 10.1002/mrm.1910390220. [DOI] [PubMed] [Google Scholar]
- 97.Aue WP, Mueller S, Seelig J. Localized 13C NMR spectra with enhanced sensitivity obtained by volume-selective excitation. . J Magn Reson. 1985;61:392–395. [Google Scholar]
- 98.Doddrell DM, Pegg DT, Bendall MR. Distortionless enhancment of NMR signals by polarization transfer. . J Magn Reson. 1982;48:323–327. [Google Scholar]
- 99.Watanabe H, Ishihara Y, Okamoto K, Oshio K, Kanamatsu T, Tsukada Y. Three-dimensional localized 1H-13C heteronuclear single-quantum coherence correlation spectroscopy in vivo. Magn Reson Med. 2000;43:200–210. doi: 10.1002/(sici)1522-2594(200002)43:2<200::aid-mrm6>3.0.co;2-h. [DOI] [PubMed] [Google Scholar]
- 100.Shen J, Rothman DL. Implementation of adiabatic polarization transfer for localized 13C NMR spectroscopy on a whole-body spectrometer. Annual Meeting ISMRM Vancouver 1997, Abstract; 1346.
- 101.Garwood M, Ke Y. Symmetric pulses to induce arbitrary flip angles with compensation for RF inhomogeneity and resonance offsets. . J Magn Reson. 1991;94:511–525. [Google Scholar]
- 102.Henry PG, Tkac I, Gruetter R. 1H-localized broadband 13C NMR spectroscopy of the rat brain in vivo at 9.4 Tesla. . Magn Reson Med. 2003;50:684–692. doi: 10.1002/mrm.10601. [DOI] [PubMed] [Google Scholar]
- 103.Bomsdorf H, Roschmann P, Wieland J. Sensitivity enhancement in whole-body natural abundance 13C spectroscopy using 13C/1H double-resonance techniques at 4 Tesla. . Magn Reson Med. 1991;22:10–22. doi: 10.1002/mrm.1910220103. [DOI] [PubMed] [Google Scholar]
- 104.Overloop K, Vanstapel F, Vanhecke P. C-13-NMR relaxation in glycogen. . Magn Reson Med. 1996;36:45–51. doi: 10.1002/mrm.1910360109. [DOI] [PubMed] [Google Scholar]
- 105.Zang LH, Laughlin MR, Rothman DL, Shulman RG. 13C NMR relaxation times of hepatic glycogen in vitro and in vivo. Biochemistry. 1990;29:6815–6820. doi: 10.1021/bi00481a009. [DOI] [PubMed] [Google Scholar]
- 106.Hoult D, Richards R. The signal-to-noise ratio of the nuclear magnetic resonance experiment. . J Magn Reson. 1976;24:71–85. doi: 10.1016/j.jmr.2011.09.018. [DOI] [PubMed] [Google Scholar]
- 107.Zhu XH, Merkle H, Kwag JH, Ugurbil K, Chen W. 17O relaxation time and NMR sensitivity of cerebral water and their field dependence. . Magn Reson Med. 2001;45:543–549. doi: 10.1002/mrm.1073. [DOI] [PubMed] [Google Scholar]
- 108.Wright AC, Song HK, Wehrli FW. In vivo MR micro imaging with conventional radiofrequency coils cooled to 77 degrees K. . Magn Reson Med. 2000;43:163–169. doi: 10.1002/(sici)1522-2594(200002)43:2<163::aid-mrm1>3.0.co;2-k. [DOI] [PubMed] [Google Scholar]
- 109.Golman K, Axelsson O, Johannesson H, Mansson S, Olofsson C, Petersson JS. Parahydrogen-induced polarization in imaging: subsecond (13)C angiography. . Magn Reson Med. 2001;46:1–5. doi: 10.1002/mrm.1152. [DOI] [PubMed] [Google Scholar]
- 110.Schupp DG, Merkle H, Ellermann JM, Ke Y, Garwood M. Localized detection of glioma glycolysis using edited 1H MRS. . Magn Reson Med. 1993;30:18–27. doi: 10.1002/mrm.1910300105. [DOI] [PubMed] [Google Scholar]
- 111.Rothman DL, Behar KL, Hetherington HP, den Hollander JA, Bendall MR, Petroff OAC, Shulman RG. 1H-Observe/13C-decouple spectroscopic measurements of lactate and glutamate in the rat brain in vivo. Proc Natl Acad Sci USA. 1985;82:1633–1637. doi: 10.1073/pnas.82.6.1633. [DOI] [PMC free article] [PubMed] [Google Scholar]
- 112.Hyder F, Rothman DL, Mason GF, Rangarajan A, Behar KL, Shulman RG. Oxidative glucose metabolism in rat brain during single forepaw stimulation: a spatially localized 1H[13C] nuclear magnetic resonance study. . J Cereb Blood Flow Metab. 1997;17:1040–1047. doi: 10.1097/00004647-199710000-00005. [DOI] [PubMed] [Google Scholar]
- 113.van Zijl PCM, Chesnick AS, DesPres D, Moonen CTW, Ruiz-Cabello J, Van Gelderen P. In vivo proton spectroscopy and spectroscopic imaging of [1-13C]-glucose and its metabolic products. . Magn Reson Med. 1993;30:544–551. doi: 10.1002/mrm.1910300504. [DOI] [PubMed] [Google Scholar]
- 114.Gruetter R, Weisdorf SA, Rajanayagan V, Terpstra M, Merkle H, Truwit CL, Garwood M, Nyberg SL, Ugurbil K. Resolution improvements in in vivo1H NMR spectra with increased magnetic field strength. . J Magn Reson. 1998;135:260–264. doi: 10.1006/jmre.1998.1542. [DOI] [PubMed] [Google Scholar]
- 115.Choi IY, Lei H, Gruetter R. Effect of deep pentobarbital anesthesia on neurotransmitter metabolism in vivo: on the correlation of total glucose consumption with glutamatergic action. . J Cereb Blood Flow Metab. 2002;22:1343–1351. doi: 10.1097/01.WCB.0000040945.89393.46. [DOI] [PubMed] [Google Scholar]
- 116.Jeffrey FM, Reshetov A, Storey CJ, Carvalho RA, Sherry AD, Malloy CR. Use of a single (13)C NMR resonance of glutamate for measuring oxygen consumption in tissue. . Am J Physiol. 1999;277:E1111–E1121. doi: 10.1152/ajpendo.1999.277.6.E1111. [DOI] [PubMed] [Google Scholar]
- 117.Malloy CR, Sherry AD, Jeffrey FM. Analysis of tricarboxylic acid cycle of the heart using 13C isotope isomers. . Am J Physiol. 1990;259:H987–H995. doi: 10.1152/ajpheart.1990.259.3.H987. [DOI] [PubMed] [Google Scholar]
- 118.deGraaf R, Luo Y, Terpstra M, Garwood M. Spectral Editing with adiabatic pulses. . J Magn Reson B. 1995;109:184–193. doi: 10.1006/jmrb.1995.0008. [DOI] [PubMed] [Google Scholar]
- 119.Inubushi T, Morikawa S, Kito K, Arai T. 1H-detected in vivo13C NMR spectroscopy and imaging at 2 T magnetic field: efficient monitoring of 13C-labeled metabolites in the rat brain derived from 1-13C-glucose. . Biochem Biophys Res Commun. 1993;191:866–872. doi: 10.1006/bbrc.1993.1297. [DOI] [PubMed] [Google Scholar]
- 120.Gruetter R, Tkac I. Field mapping without reference scan using asymmetric echo-planar techniques. . Magn Reson Med. 2000;43:319–323. doi: 10.1002/(sici)1522-2594(200002)43:2<319::aid-mrm22>3.0.co;2-1. [DOI] [PubMed] [Google Scholar]
- 121.Shen J, Rycyna RE, Rothman DL. Improvements on an in vivo automatic shimming method (FASTERMAP). . Magn Reson Med. 1997;38:834–839. doi: 10.1002/mrm.1910380521. [DOI] [PubMed] [Google Scholar]
- 122.Henry PG, Oz G, Provencher SW, Gruetter R. Toward dynamic isotopomer analysis in the rat brain in vivo: automatic quantitation of 13C NMR spectra using LCModel. NMR Biomed. 2003;16:400–412. doi: 10.1002/nbm.840. [DOI] [PubMed] [Google Scholar]
- 123.Ross BD, Bluml S, Cowan R, Danielsen E, Farrow N, Gruetter R. In vivo magnetic resonance spectroscopy of human brain: the biophysical basis of dementia. . Biophys Chem. 1997;68:161–172. doi: 10.1016/s0301-4622(97)00032-x. [DOI] [PubMed] [Google Scholar]
- 124.Terpstra M, Henry PG, Gruetter R. Measurement of reduced glutathione (GSH) in human brain using LCModel analysis of difference-edited spectra. . Magn Reson Med. 2003;50:19–23. doi: 10.1002/mrm.10499. [DOI] [PubMed] [Google Scholar]
- 125.Price TB, Rothman DL, Avison MJ, Buonamico P, Shulman RG. 13C NMR measurements of muscle glycogen during low-intensity exercise. . J Appl Physiol. 1991;70:1836–1844. doi: 10.1152/jappl.1991.70.4.1836. [DOI] [PubMed] [Google Scholar]
- 126.Gruetter R, Rothman DL, Novotny EJ, Shulman GI, Prichard JW, Shulman RG. Detection and assignment of the glucose signal in 1H NMR spectra of the human brain. . Magn Reson Med. 1992;26:183–188. doi: 10.1002/mrm.1910270118. [DOI] [PubMed] [Google Scholar]
- 127.Gruetter R, Garwood M, Ugurbil K, Seaquist ER. Observation of resolved glucose signals in 1H NMR spectra of the human brain at 4 Tesla. . Magn Reson Med. 1996;36:1–6. doi: 10.1002/mrm.1910360102. [DOI] [PubMed] [Google Scholar]
- 128.Cunningham VJ, Hargreaves RJ, Pelling D, Moorhouse SR. Regional blood–brain glucose transfer in the rat: a novel double-membrane kinetic analysis. . J Cereb Blood Flow Metab. 1986;6:305–314. doi: 10.1038/jcbfm.1986.53. [DOI] [PubMed] [Google Scholar]
- 129.Seaquist ER, Damberg GS, Tkac I, Gruetter R. The effect of insulin on in vivo cerebral glucose concentrations and rates of glucose transport/metabolism in humans. Diabetes. 2001;50:2203–2209. doi: 10.2337/diabetes.50.10.2203. [DOI] [PubMed] [Google Scholar]
- 130.de Graaf RA, Pan JW, Telang F, Lee JH, Brown P, Novotny EJ, Hetherington HP, Rothman DL. Differentiation of glucose transport in human brain gray and white matter. . J Cereb Blood Flow Metab. 2001;21:483–492. doi: 10.1097/00004647-200105000-00002. [DOI] [PubMed] [Google Scholar]
- 131.Choi IY, Seaquist ER, Gruetter R. Effect of hypoglycemia on brain glycogen metabolism in vivo. J Neurosci Res. 2003;72:25–32. doi: 10.1002/jnr.10574. [DOI] [PMC free article] [PubMed] [Google Scholar]
- 132.Hyder F, Chase JR, Behar KL, Mason GF, Siddeek M, Rothman DL, Shulman RG. Increased tricarboxylic acid cycle flux in rat brain during forepaw stimulation detected with H-1 [C-13] NMR. . Proc Natl Acad Sci USA. 1996;93:7612–7617. doi: 10.1073/pnas.93.15.7612. [DOI] [PMC free article] [PubMed] [Google Scholar]
- 133.Lowry O, Passonneau J, Hasselberger F, Schulz D. Effect of ischemia on known substrates and cofactors of the glycolytic pathway in brain. . J Biol Chem. 1964;239:18–30. [PubMed] [Google Scholar]
- 134.Swanson RA, Sagar SM, Sharp FR. Regional brain glycogen stores and metabolism during complete global ischaemia. . Neurol Res. 1989;11:24–28. doi: 10.1080/01616412.1989.11739856. [DOI] [PubMed] [Google Scholar]
- 135.Cruz NF, Dienel GA. High glycogen levels in brains of rats with minimal environmental stimuli: implications for metabolic contributions of working astrocytes. . J Cereb Blood Flow Metab. 2002;22:1476–1489. doi: 10.1097/01.WCB.0000034362.37277.C0. [DOI] [PubMed] [Google Scholar]
- 136.Kong J, Shepel PN, Holden CP, Mackiewicz M, Pack AI, Geiger JD. Brain glycogen decreases with increased periods of wakefulness: implications for homeostatic drive to sleep. . J Neurosci. 2002;22:5581–5587. doi: 10.1523/JNEUROSCI.22-13-05581.2002. [DOI] [PMC free article] [PubMed] [Google Scholar]
- 137.Gruetter R, Seaquist ER, Choi IY. Non-invasive measurements of brain glycogen during hypoglycemia using localized in vivo13C NMR. Diabetes. 2000;49:265. [Google Scholar]
- 138.Choi IY, Gruetter R. In vivo13C NMR assessment of brain glycogen concentration and turnover in the awake rat. . Neurochem Int. 2003;43:317–322. doi: 10.1016/s0197-0186(03)00018-4. [DOI] [PubMed] [Google Scholar]
- 139.Sorg O, Magistretti PJ. Vasoactive intestinal peptide and nora-drenaline exert long-term control on glycogen levels in astrocytes: blockade by protein synthesis inhibition. . J Neurosci. 1992;12:4923–4931. doi: 10.1523/JNEUROSCI.12-12-04923.1992. [DOI] [PMC free article] [PubMed] [Google Scholar]
- 140.Swanson RA. Physiologic coupling of glial glycogen metabolism to neuronal activity in brain. . Can J Physiol Pharmac. 1992;70:S138–S144. doi: 10.1139/y92-255. [DOI] [PubMed] [Google Scholar]
- 141.Dienel GA, Wang RY, Cruz NF. Generalized sensory stimulation of conscious rats increases labeling of oxidative pathways of glucose metabolism when the brain glucose–oxygen uptake ratio rises. . J Cereb Blood Flow Metab. 2002;22:1490–1502. doi: 10.1097/01.WCB.0000034363.37277.89. [DOI] [PubMed] [Google Scholar]
- 142.Nelson SR, Schulz DW, Passonneau JV, Lowry OH. Control of glycogen levels in brain. . J Neurochem. 1968;15:1271–1279. doi: 10.1111/j.1471-4159.1968.tb05904.x. [DOI] [PubMed] [Google Scholar]
- 143.Shulman RG, Hyder F, Rothman DL. Lactate efflux and the neuroenergetic basis of brain function. NMR Biomed. 2001;14:389–396. doi: 10.1002/nbm.741. [DOI] [PubMed] [Google Scholar]
- 144.Swanson RA, Morton MM, Sagar SM, Sharp FR. Sensory stimulation induces local cerebral glycogenolysis: demonstration by autoradiography. Neuroscience. 1992;51:451–461. doi: 10.1016/0306-4522(92)90329-z. [DOI] [PubMed] [Google Scholar]
- 145.Cryer PE. Hypoglycaemia: the limiting factor in the glycaemic management of type I and type II diabetes. Diabetologia. 2002;45:937–948. doi: 10.1007/s00125-002-0822-9. [DOI] [PubMed] [Google Scholar]
- 146.Fox PT, Raichle ME, Mintun MA, Dence C. Nonoxidative glucose consumption during focal physiologic neural activity. Science. 1988;241:462–464. doi: 10.1126/science.3260686. [DOI] [PubMed] [Google Scholar]
- 147.Prichard J, Rothman D, Novotny E, Petroff O, Kuwabara T, Avison M, Howseman A, Hanstock C, Shulman R. Lactate rise detected by 1H NMR in human visual cortex during physiologic stimulation. . Proc Natl Acad Sci USA. 1991;88:5829–5831. doi: 10.1073/pnas.88.13.5829. [DOI] [PMC free article] [PubMed] [Google Scholar]
- 148.Sappey-Marinier D, Calabrese G, Fein G, Hugg JW, Biggins C, Weiner MW. Effect of photic stimulation on human visual cortex lactate and phosphates using 1H and 31P magnetic resonance spectroscopy. . J Cereb Blood Flow Metab. 1992;12:584–592. doi: 10.1038/jcbfm.1992.82. [DOI] [PubMed] [Google Scholar]
- 149.Merboldt KD, Bruhn H, Hanicke W, Michaelis T, Frahm J. Decrease of glucose in the human visual cortex during photic stimulation. . Magn Reson Med. 1992;25:187–194. doi: 10.1002/mrm.1910250119. [DOI] [PubMed] [Google Scholar]
- 150.Madsen PL, Cruz NF, Sokoloff L, Dienel GA. Cerebral oxygen/glucose ratio is low during sensory stimulation and rises above normal during recovery: excess glucose consumption during stimulation is not accounted for by lactate efflux from or accumulation in brain tissue. . J Cereb Blood Flow Metab. 1999;19:393–400. doi: 10.1097/00004647-199904000-00005. [DOI] [PubMed] [Google Scholar]
- 151.Ogawa S, Menon RS, Kim SG, Ugurbil K. On the characteristics of functional magnetic resonance imaging of the brain. . A Rev Biophys Biomol Struct. 1998;27:447–474. doi: 10.1146/annurev.biophys.27.1.447. [DOI] [PubMed] [Google Scholar]
- 152.Chhina N, Kuestermann E, Halliday J, Simpson LJ, Macdonald IA, Bachelard HS, Morris PG. Measurement of human tricarboxylic acid cycle rates during visual activation by (13)C magnetic resonance spectroscopy. . J Neurosci Res. 2001;66:737–746. doi: 10.1002/jnr.10053. [DOI] [PubMed] [Google Scholar]
- 153.Yu X, White LT, Alpert NM, Lewandowski ED. Subcellular metabolite transport and carbon isotope kinetics in the intramyocardial glutamate pool. Biochemistry. 1996;35:6963–6968. doi: 10.1021/bi960199l. [DOI] [PubMed] [Google Scholar]
- 154.Henry PG, Lebon V, Vaufrey F, Brouillet E, Hantraye P, Bloch G. Decreased TCA cycle rate in the rat brain after acute 3-NP treatment measured by in vivo1H-[13C] NMR spectroscopy. . J Neurochem. 2002;82:857–866. doi: 10.1046/j.1471-4159.2002.01006.x. [DOI] [PubMed] [Google Scholar]
- 155.Garcia-Martin ML, Garcia-Espinosa MA, Ballesteros P, Bruix M, Cerdan S. Hydrogen turnover and subcellular compartmentation of hepatic [2-(13)C]glutamate and [3-(13)C]aspartate as detected by (13)C NMR. . J Biol Chem. 2002;277:7799–7807. doi: 10.1074/jbc.M107501200. [DOI] [PubMed] [Google Scholar]
- 156.LaNoue KF, Tischler ME. Electrogenic characteristics of the mitochondrial glutamate-aspartate antiporter. . J Biol Chem. 1974;249:7522–7528. [PubMed] [Google Scholar]
- 157.Chatham JC, Forder JR, Glickson JD, Chance EM. Calculation of absolute metabolic flux and the elucidation of the pathways of glutamate labeling in perfused rat heart by 13C NMR spectroscopy and nonlinear least squares analysis. . J Biol Chem. 1995;270:7999–8008. doi: 10.1074/jbc.270.14.7999. [DOI] [PubMed] [Google Scholar]
- 158.McKenna MC, Stevenson JH, Huang X, Hopkins IB. Differential distribution of the enzymes glutamate dehydrogenase and aspartate aminotransferase in cortical synaptic mitochondria contributes to metabolic compartmentation in cortical synaptic terminals. . Neurochem Int. 2000;37:229–241. doi: 10.1016/s0197-0186(00)00042-5. [DOI] [PubMed] [Google Scholar]
- 159.Yudkoff M, Nissim I, Daikhin Y, Lin Z, Nelson D, Pleasure D, Erecinska M. Brain glutamate metabolism: neuronal-astroglial relationships. . Dev Neurosci. 1993;15:343–350. doi: 10.1159/000111354. [DOI] [PubMed] [Google Scholar]
- 160.Schousboe A, Westergaard N, Hertz L. Neuronal-astrocytic interactions in glutamate metabolism. . Biochem Soc Trans. 1993;21:49–53. doi: 10.1042/bst0210049. [DOI] [PubMed] [Google Scholar]
- 161.Ottersen O, Zhang N, Walberg F. Metabolic compartmentation of glutamate and glutamine: morpholocial evidence obtained by quantitative immunocytochemistry in rat cerebellum. Neurosci. 1992;46:519–534. doi: 10.1016/0306-4522(92)90141-n. [DOI] [PubMed] [Google Scholar]
- 162.Zhang NH, Laake J, Nagelhus E, Storm-Mathisen J, Ottersen OP. Distribution of glutamine-like immunoreactivity in the cerebellum of rat and baboon (Papio anubis) with reference to the issue of metabolic compartmentation. . Anat Embryol (Berl) 1991;184:213–223. doi: 10.1007/BF01673257. [DOI] [PubMed] [Google Scholar]
- 163.Martinez-Hernandez A, Bell KP, Norenberg MD. Glutamine synthetase: glial localization in brain. Science. 1976;195:1356–1358. doi: 10.1126/science.14400. [DOI] [PubMed] [Google Scholar]
- 164.Shank RP, Bennett GS, Freytag SO, Campbell GL. Pyruvate carboxylase: an astrocyte-specific enzyme implicated in the replenishment of amino acid neurotransmitter pools. Brain Res. 1985;329:364–367. doi: 10.1016/0006-8993(85)90552-9. [DOI] [PubMed] [Google Scholar]
- 165.Dringen R, Gebhardt R, Hamprecht B. Glycogen in astrocytes: possible function as lactate supply for neighboring cells. Brain Res. 1993;623:208–214. doi: 10.1016/0006-8993(93)91429-v. [DOI] [PubMed] [Google Scholar]
- 166.Daikhin Y, Yudkoff M. Compartmentation of brain glutamate metabolism in neurons and glia. . J Nutr. 2000;130:1026S–1031S. doi: 10.1093/jn/130.4.1026S. [DOI] [PubMed] [Google Scholar]
- 167.Schousboe A, Westergaard N, Sonnewald U, Petersen SB, Huang R, Peng L, Hertz L. Glutamate and glutamine metabolism and compartmentation in astrocytes. . Dev Neurosci. 1993;15:359–366. doi: 10.1159/000111356. [DOI] [PubMed] [Google Scholar]
- 168.Nicklas WJ, Zeevalk G, Hyndman A. Interactions between neurons and glia in glutamate/glutamine compartmentation. . Biochem Soc Trans. 1987;15:208–210. doi: 10.1042/bst0150208. [DOI] [PubMed] [Google Scholar]
- 169.Eriksson G, Peterson A, Iverfeldt K, Walum E. Sodium-dependent glutamate uptake as an activator of oxidative metabolism in primary astrocyte cultures from newborn rat. Glia. 1995;15:152–156. doi: 10.1002/glia.440150207. [DOI] [PubMed] [Google Scholar]
- 170.Magistretti P, Pellerin L. Cellular mechanisms of brain energy metabolism. Relevance to functional brain imaging and to neurodegenerative disorders. . Ann NY Acad Sci. 1996;777:380–387. doi: 10.1111/j.1749-6632.1996.tb34449.x. [DOI] [PubMed] [Google Scholar]
- 171.Silver IA, Erecinska M. Energetic demands of the Na+/K+ ATPase in mammalian astrocytes. Glia. 1997;21:35–45. doi: 10.1002/(sici)1098-1136(199709)21:1<35::aid-glia4>3.0.co;2-0. [DOI] [PubMed] [Google Scholar]
- 172.Tsacopoulos M, Magistretti P. Metabolic coupling between glia and neurons. . J Neurosci. 1996;16:877–885. doi: 10.1523/JNEUROSCI.16-03-00877.1996. [DOI] [PMC free article] [PubMed] [Google Scholar]
- 173.Magistretti PJ, Sorg O, Yu N, Martin JL, Pellerin L. Neurotransmitters regulate energy metabolism in astrocytes: implications for the metabolic trafficking between neural cells. . Dev Neurosci. 1993;15:306–312. doi: 10.1159/000111349. [DOI] [PubMed] [Google Scholar]
- 174.Bergles DE, Dzubay JA, Jahr CE. Glutamate transporter currents in bergmann glial cells follow the time course of extrasynaptic glutamate. . Proc Natl Acad Sci USA. 1997;94:14821–14825. doi: 10.1073/pnas.94.26.14821. [DOI] [PMC free article] [PubMed] [Google Scholar]
- 175.Attwell D, Laughlin SB. An energy budget for signaling in the grey matter of the brain. . J Cereb Blood Flow Metab. 2001;21:1133–1145. doi: 10.1097/00004647-200110000-00001. [DOI] [PubMed] [Google Scholar]
- 176.Siegel GJ, Agranoff BW. Basic Neurochemistry: Molecular, Cellular and Medical Aspects 6th edn. Lippincott-Raven: Philadelphia, PA, 1999; xxi, 1183.
- 177.Berl S, Nicklas WJ, Clarke DD. Compartmentation of citric acid cycle metabolism in brain: labelling of glutamate, glutamine, aspartate and gaba by several radioactive tracer metabolites. . J Neurochem. 1970;17:1009–1015. doi: 10.1111/j.1471-4159.1970.tb02254.x. [DOI] [PubMed] [Google Scholar]
- 178.Waniewski RA, Martin DL. Preferential utilization of acetate by astrocytes is attributable to transport. . J Neurosci. 1998;18:5225–5233. doi: 10.1523/JNEUROSCI.18-14-05225.1998. [DOI] [PMC free article] [PubMed] [Google Scholar]
- 179.Dienel GA, Liu K, Popp D, Cruz NF. Enhanced acetate and glucose utilization during graded photic stimulation. Neuronalglial interactions in vivo. Ann NY Acad Sci. 1999;893:279–281. doi: 10.1111/j.1749-6632.1999.tb07836.x. [DOI] [PubMed] [Google Scholar]
- 180.Lee JH, Garwood M, Menon R, Adriany G, Andersen P, Truwit CL, Ugurbil K. High contrast and fast three-dimensional magnetic resonance imaging at high fields. . Magn Reson Med. 1995;34:308–312. doi: 10.1002/mrm.1910340305. [DOI] [PubMed] [Google Scholar]