Abstract
Many models of cortical function assume that local lateral connections are specific with respect to the preferred features of the interacting cells and that they are organized in a Mexican-hat pattern with strong “center” excitation flanked by strong “surround” inhibition. However, anatomical data on primary visual cortex indicate that the local connections are isotropic and that inhibition has a shorter range than excitation. We address this issue in an analytical study of a neuronal network model of the local cortical circuit in primary visual cortex. In the model, the orientation columns specified by the convergent lateral geniculate nucleus inputs are arranged in a pinwheel architecture, whereas cortical connections are isotropic. We obtain a trade-off between the spatial range of inhibition and its time constant. If inhibition is fast, the network can operate in a Mexican-hat pattern with isotropic connections even with a spatially narrow inhibition. If inhibition is not fast, Mexican-hat operation requires a spatially broad inhibition. The Mexican-hat operation can generate a sharp orientation tuning, which is largely independent of the distance of the cell from the pinwheel center.
Models of cortical function often assume that cortical circuitry acts in a center–surround fashion, namely that nearby cells excite each other, whereas separated pairs of cells have a mutually suppressive influence (1–9). Because of their selective enhancement of local groups of cells, center–surround interactions are attractive dynamic mechanisms for sharpening, or even spontaneously generating, spatial patterns of activity in the neuronal assembly. Further, to make the enhanced cortical patterns congruent with the sensory representation of the system, the cortical interactions must depend on the functional distance between the cells, determined by the features coded by them. This functional circuitry, known as “Mexican hat” organization, has been adopted in network models of orientation selectivity (OS) (1–5), working memory in frontal cortex (7), multiplicative neural responses in parietal cortex (8), and in general winner-take-all circuits (9). However, the underlying anatomical and physiological basis of this architecture is not well understood. For instance, experiments in primary visual cortex (V1) suggest that inhibitory connections in cortex tend to be more spatially restricted than the excitatory ones (10, 11). Furthermore, although there is anatomical evidence that long-range connections are feature-specific (11, 12), several experimental studies find that the local connectivity in cortex has roughly a symmetric organization (12, 13), depending primarily on cortical distances. The functional implications of this isotropic organization of connectivity depend on the columnar organization of the coded features. In cat, monkey, and several other primates, orientation columns are organized in pinwheel architectures with singularities at their centers. Given that near the pinwheel centers, cells with orthogonal preferred orientations (POs) are close to each other, but are far apart from each other away from the centers, it might be expected that the orientation tuning properties of cells would depend on their location relative to these centers. Indeed, a recent study by McLaughlin et al. (14) modeling the simple cell network in V1 predicted that OS would be considerably sharper near pinwheel centers than away. Experimental findings have so far failed to find substantial differences between the OS near and away from the centers (15). In light of these results, we address two questions: (i) What are the requirements on cortical connectivity that allow for a functional Mexican-hat action in the cortical network? (ii) In networks that do realize Mexican-hat functional connectivity, what is the predicted relationship between OS and the 2D pinwheel organization of orientation columns?
Materials and Methods
A Network Model.
We model a restricted region of cortical circuitry by two populations of excitatory and inhibitory neurons that interact with each other in a 2D plane. The network dynamics is described by using a mean-field rate model (16–18), with mE(r⃗, t) and mI(r⃗, t) as the dynamic variables. The variable mE(r⃗, t) (mI(r⃗, t)) denotes the synaptic conductance rate (normalized by the peak conductance) generated by an excitatory (inhibitory) cell located at the 2D cortical coordinate r⃗. The conductance rates are low-pass filters of the presynaptic firing rates, ME(r⃗, t) and MI(r⃗, t), with excitatory and inhibitory synaptic conductance time constants τE and τI, respectively. The firing rates for each cell are approximated by an instantaneous f-I curve M(t) = [I(t)]+, where I(t) is the synaptic current injected into a neuron relative to its threshold current after scaling by the gain of the f-I curve; [x]+ is the rectification function ([x]+ = x for x > 0 and [x]+ = 0 for x < 0). These assumptions lead to the following set of equations.
 |
1 |
 |
2 |
The first terms in brackets of Eqs. 1 and 2 represent the lateral geniculate nucleus (LGN) drive, specified below. The second (third) term of Eq. 1 denotes the excitatory (inhibitory) cortical feedback, where SEEρE(r⃗, r⃗′)(SEIρI(r⃗, r⃗′)) is the strength of synaptic connection between a presynaptic excitatory (inhibitory) cell at r⃗′ and a postsynaptic excitatory cell at r⃗. The function ρE(r⃗, r⃗′)(ρI(r⃗, r⃗′)) denotes the (normalized) spatial profile of the excitatory (inhibitory) cortical interactions, whereas the factor SEE(SEI) denotes the summed strength of these interactions. Similar definitions apply to Eq. 2. For simplicity we have not incorporated self-inhibition into our model.
In this paper we consider only the local cortical connections and assume that their density as well as strength depend only on the cortical distance between the interacting cells. We thus assume that ρE(r⃗′, r⃗) and ρI(r⃗′, r⃗) are normalized 2D Gaussian functions of r⃗ − r⃗′ with standard deviations σE and σI, respectively.
Pinwheel Architecture and LGN Inputs.
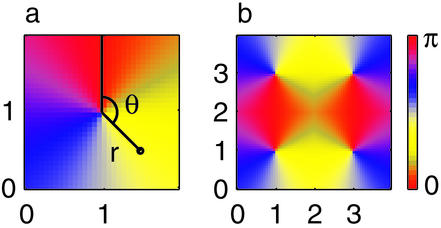
The LGN afferent input to a neuron is specified by its preferred orientation (PO), i.e., by its location within the pinwheel orientation map, shown in Fig. 1. The 2D coordinate r⃗ is represented in polar coordinates r⃗ = (r, θ) where the origin is the closest pinwheel center. The PO of a cell ranges from 0° to 180° and is equal to half of its polar angle θ. The LGN input is modeled as ILGN(r⃗) = A + B cos(θ − 2θ0) where A is the mean LGN input to the cortical cell, B is its orientation modulation amplitude, and θ0 is the orientation of the stimuli.
Figure 1.
Pinwheel architecture in the model. (a) A single-pinwheel system. Each cell is indexed by its distance r from the pinwheel center at (1,1), and an angle θ measured relative to the depicted vertical line. The preferred orientation of the cell is θ/2. (b) Four-pinwheel system, with centers at (1,1), (1,3), (3,1), and (3,3). θ of each cell is defined relative to the nearest center. The red regions show the two horizontal columns, each connecting center pairs with opposite parity.
Our main results are based on the analytical solution of the model. For this we assume (i) a single pinwheel approximation, namely that the interaction between different “hypercolumns” can be neglected, (ii) most of the cells are above their threshold for firing so that the system is essentially linear, and (iii) the number of neurons in the network is large. The resulting linear equations can then be solved by 2D Fourier transforms. By setting the time derivatives of the dynamic equations to zero and transforming back to real space, we obtain the stationary spatial activity profiles generated by a stationary visual stimulus. In the stationary case, the conductance rates, mE(r⃗) and mI(r⃗) are identical to the firing rates, ME(r⃗) and MI(r⃗), respectively. In the following section we will describe the properties of the excitatory population.
Results
The Stationary Spatial Activity Profile.
The stationary profile of the excitatory population, mE(r⃗), has the form
 |
3 |
where A and B are the mean and modulation amplitudes of the LGN input, respectively. The factor a is
 |
4 |
The analytical expression for b(r) is
 |
5 |
where J1(x) is the Bessel function of order 1. The feedback kernel is D(k) = SEEρ̃E(k) − SEISIEρ̃E(k)ρ̃I(k), where ρ̃E(k) = exp(−σ k2/2) and ρ̃I(k) = exp(−σ
 k2/2) are the Fourier transforms of ρE(r⃗) and ρI(r⃗), respectively. The variable r is the radial distance from the pinwheel center, and k denotes the Fourier wave number. Note that the k = 0 value of the term in the square brackets of Eq. 5 is equal to a. The factor a represents the cortical gain of the mean activity, whereas b(r) represents the effect of the cortical interactions on the orientation modulation of the cell. In the absence of cortical interactions a = b = 1. For the above solution to be valid 1 − D(k) must be positive for all k. If D(k) is larger than unity, the linear solution is unstable.
Orientation Selectivity and Pinwheel Architecture.
The above solution implies that the mean activity of the cells does not depend on their distance r from the pinwheel center. On the other hand, the orientation modulation depends on r through the cortical factor b(r). The degree of OS can be measured by the orientation index (OI), which is half the ratio between the modulated and the mean components of the cell's activity, namely OI = Bb(r)/2Aa. We write the OI as Q(r)B/2A, where B/2A is the OI of the cell in the absence of cortical interactions. Q(r) = b(r)/a measures the cortical orientation amplification factor. To obtain an insight into the r-dependence of Q, it is instructive to consider two theoretical limits: “near center,” r ≪ σE,I and “far from center,” r ≫ σE,I.
Near Center.
In this limit the dominant contribution to the k-integral of Eq. 5 is from large k. However, for large k all interaction terms vanish, yielding, b(r → 0) → 1, and therefore Q(r → 0) → 1/a. The meaning of this result is simple: for cells near the centers, the interactions span all orientations. Hence they affect the activity by controlling the average component of the activity, a, but they do not contribute to the modulated component.
Far from Center.
In this limit, small wavenumbers k dominate the integral. Hence all the k-dependent interactions can be replaced by their k = 0 values, yielding b(r → ∞) → a, and Q(r → ∞) → 1. This means that in this limit the range of interactions is shorter than the distance between dissimilar orientations. Thus, the entire interaction takes place within a single iso-orientation domain; hence, interactions affect the overall gain of the cell's activity but do not affect its orientation tuning. It should be stressed, however, that whether this limit is actually reached depends on the range of the interactions relative to the width of iso-orientation domains far from the centers, or within the framework of our model, on the maximum value of r relative to σE,I. To determine the actual dependence of Q on r in between the two limits, one needs to specify the parameters of the interactions which we do below.
Mexican Hat with Fast Short-Range Inhibition.
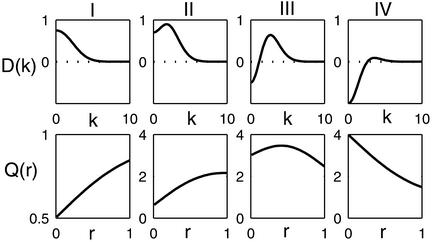
In this section we assume that the inhibitory time constant is much shorter than the excitatory one. In this case, all stationary solutions whose feedback kernel satisfies D(k) < 1 are stable. The change of Q with r depends largely on the shape and magnitude of D(k). When |D(k)| is small for all k, the influence of cortical feedback is negligible. To be concrete, we call D(k) as type F (feed-forward) when |D(k)| < 0.5 for all k. In our model D(k) has four main shapes, depicted in Fig. 2, other than type F. Type I is positive and decreases monotonically with k. It acts as a low-pass filter enhancing the low-k modes. This behavior occurs whenever SEE dominates.
Figure 2.
Types of feedback kernels D(k) vs. the wave-number k and the corresponding cortical orientation amplification factor Q vs. the radial distance r from the pinwheel center. Here σI = 0.45, σE = 0.5, and SEI = 0.5. The other parameters are: (I) SEE = 1, SIE = 0.5; (II) SEE = 3, SIE = 4.6; (III) SEE = 3.5, SIE = 8; and (IV) SEE = 1, SIE = 4. They correspond to the circles depicted in Fig. 5.
Types II and III are both realizations of a Mexican-hat state. They are defined by having a band-pass feedback kernel with a pronounced peak at a non-zero k. By combining inhibition with excitation, these two types selectively enhance a nonhomogeneous pattern of activity. Furthermore, this enhancement can be made arbitrarily sharp by making the non-zero k peak of the feedback kernel close to 1. For concreteness we define the Mexican-hat state by the requirements that (i) the maximum value of D obeys Dmax > 0.5 and (ii) 1 − D(0) > 2(1 − Dmax). Type II and type III differ by the value of the feedback at low k. In type II, SEE is sufficiently strong so that the D(k = 0) is positive. Type III has negative D(k = 0). Finally, when SEE is small, the feedback D(k) is dominated by the inhibitory component. It is negative for low k and its maximum value is less than 0.5. (type IV). Here the feedback acts as a high-pass filter, suppressing the low-k modes.
The Mexican-hat behavior is present in our system even when the inhibitory synapses have a shorter spatial range than the excitatory ones (in Figs. 2–6, we use σI = 0.9σE). The reason for this is that the space constant of the negative component of the feedback loop is σ− =  , which is always larger than the positive feedback one, σE. A similar argument has been given in a study of a 1D network (19).
Figure 6.
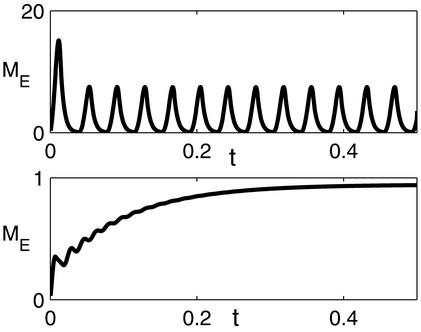
(Upper) Oscillatory instability with slow inhibition. Evolution of firing rate of an excitatory cell at lattice location (1.0, 1.5). Network parameters are the same as in Fig. 4 (type III), except for the synaptic time constants, which are τE = τI = 5 msec. The system exhibits high-amplitude rapid coherent oscillation. (Lower) Total excitatory conductance is the same as in Upper, but 60% of it is composed of slow synapses with time constant 50 msec. The time constants of the fast synapses are the same as in Upper.
Fig. 2 shows the contribution of the cortical interactions to the orientation tuning of the excitatory population, in the different regimes. We plot the cortical modulation amplitude Q as a function of the distance r from the pinwheel center. Since the anatomical findings suggest that σE,I are roughly half the “radius” of a hypercolumn we consider only the range 0 < r < 1, r = 1 being twice the size of σE (i.e., σE = 0.5).
As can be seen, the shape of D(k) has a substantial effect on the OS of the cells. In order to generate sharp tuning the cortical interactions must enhance the non-zero k modes [contributing to the modulation amplitude b(r)] relative to the k = 0 mode of the activity, which is a. This can be achieved by suppressing the uniform mode, enhancing the non-zero modes, or a combination of the two. Thus, type I kernel is unsuitable for OS because it peaks at k = 0, thereby enhancing maximally the uniform mode. Indeed, Fig. 2 shows that in this case, Q is less than unity, implying that the OS is broadened relative to the tuning of cells without cortical interaction. On the other hand types, II, III, and IV can all sharpen tuning, at least in some locations.
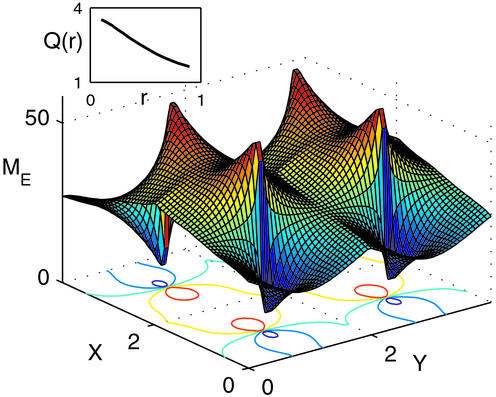
In the case of the type IV kernel, Q > 1 and is maximal near the center. At this location, the negative feedback suppresses the uniform component of the activity without suppressing the modulation component. Away from the center, Q monotonically decreases with r, as the inhibition suppresses also the modulated component of the activity and reaches a value close to unity for r = 1. This behavior is confirmed in the simulations of the model, as shown in Fig. 3. The network is stimulated by a broadly tuned LGN input with horizontal stimulus, θ0 = 0°. The activity profile exhibits sharp peaks at the pinwheel centers. As one moves away from them, both the peak activities as well as the angular modulation of the profile decrease considerably. Note that unlike the analytical solution, here the interactions between the different pinwheels are not neglected. Nevertheless, the simulation results are in a good agreement with the analytical predictions [compare Fig. 3 Inset with Fig. 2 (IV)].
Figure 3.
Simulations of Eqs. 1 and 2 with the parameters of Fig. 2 (type IV) and time constants τI = 2 msec, τE = 6 msec. The network is composed of two populations of cells on a 64 × 64 lattice organized in four pinwheels. Here, A = 3.25, B = 0.75, and θ0 = 0°. Displayed is a surface plot of the stationary excitatory activity profile, with its contours shown in the x-y plane. (Inset) The cortical orientation amplification factor Q(r), as estimated by computing the angular modulation of the profile in narrow annuli with radius r.
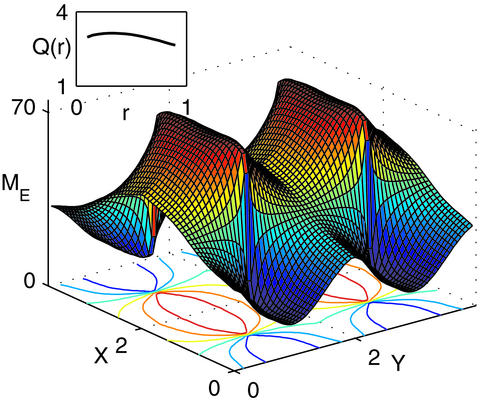
In type II, Q(r) is monotonically increasing with r (in the range r < 1). In fact, near the center Q is less than 1, indicating that here the cortical interactions actually broaden the OS of the cells. Because of the positive feedback at small k, it enhances the uniform component, causing a decrease in Q. At larger r the selective enhancement of the non-zero k mode comes into play, causing an increase in Q that can reach values larger than 1, as shown in Fig. 2. Type III achieves large values of Q for all r. This is because of the combined inhibitory suppression of the low k mode (which is effective at the center) and the enhancement of a non-zero k mode (important far from the center). In general, Q peaks at an intermediate value of r. However, depending on the chosen parameters, the dependence on r of Q can be rather mild, as shown in Fig. 2III. Simulations of the type III parameters (for stimulus with θ0 = 0°) are shown in Fig. 4. The activity profile shows two uniform ridges at the middle of the two horizontal columns, with relatively uniform peak activity and angular modulation, as suggested by the numerical calculation of Q (Fig. 4 Inset).
Figure 4.
Simulations using the parameters of Fig. 2 (i.e., type III). Details are the same as in Fig. 3.
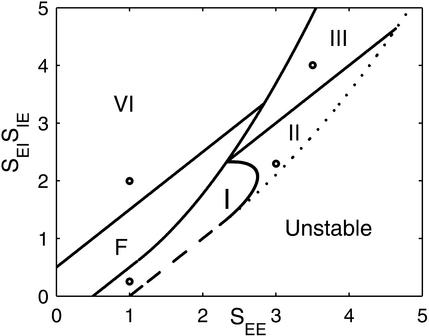
Fig. 5 shows the phase diagram of the system, in the plane of the positive feedback amplitude, SEE, and the amplitude of the negative feedback loop, SEISIE. The parameter regimes where the different types of D(k) exist are marked. In addition, the instability lines where the maximum of D(k) is 1 are shown. One line (dashed) corresponds to the case where D(k) peaks at k = 0 (type I) so that the unstable mode is a uniform mode. Crossing this line causes the activities to grow uncontrollably. The other stability line (dotted) corresponds to the case where the unstable mode is at non-zero k. Crossing this line the solution becomes nonlinear and exhibits symmetry breaking (see Discussion).
Figure 5.
Phase diagram showing the parameter regions for the different type of D(k). Here σI/σE = 0.9. The four circles show the value of parameters used in Fig. 2. Also shown are the instability lines where D(k) becomes greater than unity. The dashed instability line is for the case where the unstable k is zero; the dotted line is when the unstable k is nonzero.
Instability of Mexican-Hat Solutions with Slow Short-Range Inhibition.
In the previous section we have assumed that the inhibition is fast so that all stationary solutions with D(k) < 1 are stable. This assumption, however, is problematic because the γ-aminobutyric acid type A (GABAA) decay time-constant is larger than that of the α-amino-3-hydroxy-5-methyl-4-isoxazolepropionic acid (AMPA) receptors. Here we study the system behavior when the inhibition is not faster than the excitation. Calculating the stability of the solutions of Eqs. 1 and 2 we find that the stability of the linear solution requires, in addition to D(k) < 1, also that
 |
6 |
If SEE exceeds this limit, the system undergoes an oscillatory instability. The constraint, Eq. 6, seriously limits the strength of the excitatory synapses, and hence their role in amplifying the cortical tuning. For instance, in the case of inhibition and excitation with equal time constants, the stability requires that SEE < 2, which excludes the Mexican-hat regimes (types II and III; see Fig. 5), limiting the action of the cortical interactions to predominantly inhibitory (type IV). An example of the effect of this oscillatory instability is shown in Fig. 6, where the network with the parameters corresponding to the Mexican-hat architecture (type III parameters, Fig. 5) is simulated with τE = τI = 5 msec.
The above analysis assumes only one excitatory synaptic time-scale. In cortex, in addition to fast AMPA receptors, many cells have also N-methyl-d-aspartate (NMDA) receptors (20), and these receptors have a much longer decay time, of the order of 100 msec. Motivated by this, we examine the possible role of the slow NMDA synapses in stabilizing the Mexican-hat system (21, 22). We model the system by using three populations of synapses: fast inhibition (time constant τI), fast excitation (with strength SEE1 and time constant τE1), and slow excitation (with strength SEE2 and time constant τE2). The spatial profiles of both types of excitatory synapses are assumed to be the same. Because the nature of the synapse is determined by the postsynaptic target and not by presynaptic sources, the firing rates of the excitatory population are still defined in terms of a single variable, ME(r⃗, t) = [IE(r⃗, t)]+, since both types of synaptic receptors “see” the same presynaptic firing sources. This implies that in the stationary state mE1(r⃗) = mE2(r⃗), and both are equal to the excitatory firing rate profile ME(r⃗). Thus, the properties of the stationary solution remain the same as those analyzed in the two-population model above with SEE = SEE1 + SEE2. Nevertheless, the dynamics of the system is different and, in particular, the dynamic stability criteria of this stationary state change.
To see the effect of slow excitation on the stability of the stationary state, consider the simple limit where the time constant of the fast synapses τE2 is much larger than τE1 and τI. In this limit, the stability requirement that the positive feedback not be larger than 1 yields the same condition as in the two-population model, but with a feedback kernel D(k) computed by using the total excitatory strength, SEE = SEE1 + SEE2. On the other hand, the oscillatory instability applies now only to the fast subsystem (i.e., that involving SEE1 and the ratio τE1/τI). Denoting the fraction of slow excitatory synapses by α (SEE2 = αSEE, SEE1 = (1 − α)SEE), the stability condition (Eq. 6) is replaced by
 |
7 |
Thus the presence of slow synapses allows a stable stationary state with stronger overall feedback excitation than the corresponding system with only fast excitation. Fig. 6 shows an example of stabilization of the nonoscillatory states for the Mexican-hat parameters for a system for which 60% of the excitatory interactions are slow (NMDA synapses) with τE2 = 50 msec.
Stable Mexican-Hat Solutions with Slow Long-Range Inhibition.
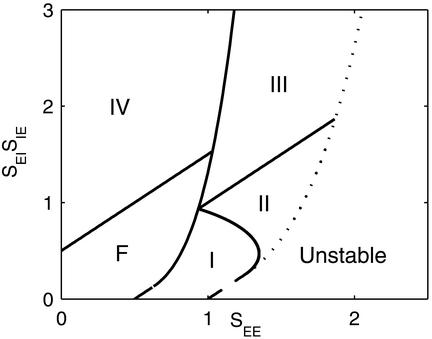
We have seen in the phase diagram of Fig. 5 that the Mexican-hat state exists only for large values of positive feedback and this, according to Eq. 6, can lead to its instability. However, we find that the phase diagram of the system is very sensitive to the ratio of the excitatory and inhibitory space constants, σE and σI. Fig. 5 was calculated for σI = 0.9σE. In Fig. 7 we show the corresponding phase diagram for the cases σI = 2σE. Comparing Figs. 5 and 7, it is clearly seen that if the inhibition has a substantially longer spatial range than the excitation, Mexican-hat solutions occur already for smaller values of SEE. To understand this phenomenon, we recall that the space constant of the negative feedback is σ− =  . Thus, if σI is small, the space constants of the positive and negative feedbacks are nearly the same. Hence, to generate a significant net positive feedback one needs to overcome the cancellation of the positive and negative feedback by substantially increasing the strength of the interactions. This cancellation effect does not happen if σI is large.
Figure 7.
Effect of long-range inhibition on the phase diagram of the system. Parameters are the same as in Fig. 5, except that σI/σE = 2.
Examining the dependence of the phase diagram on the space constants ratio, we find that the Mexican-hat state requires
 |
8 |
This bound, which is an increasing function of x, predicts that a smaller value of SEE is sufficient if σI is large. If this bound is smaller than the condition Eq. 6 (or Eq. 7), then the system posses a stable Mexican-hat state.
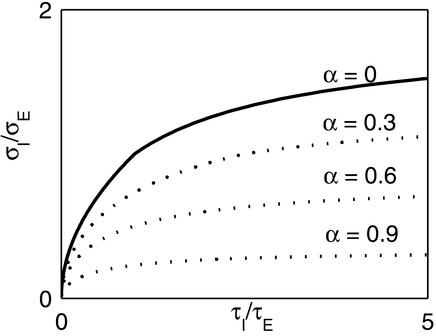
The interplay between the spatial extent of the inhibition and its time constant is summarized in Fig. 8. Fig. 8 shows the minimum relative spatial range of inhibition required for a stable Mexican-hat solution vs. its relative time constant. This relationship is derived by combining Eqs. 6, 7, and 8. Note that if the inhibition is not faster than the excitation, then for the system to have a Mexican-hat solution the inhibition must have a longer range than the excitation. This is not the case if in addition to the fast subsystem, there is also a substantial component of slow excitatory synapses, as predicted by Eq. 7.
Figure 8.
Relation between the relative spatial range of inhibition and its relative temporal range. The curves show the minimum ratio σI/σE required for the existence of a Mexican-hat state vs. the ratio τI/τE. Solid line is for a system with a single excitatory time constant (α = 0). The dotted lines are for a system where a fraction α of the excitation is very slow compared to the fast subsystem. In the latter case, the x axis corresponds to the ratio of time constants for the fast subsystem, see Eq. 7.
Discussion
Mexican Hats and the Range of Inhibition.
In this work we shed light on the conditions for local recurrent circuits to amplify spatial patterns of activity by using a balance between strong excitation and inhibition, with both of limited spatial extent. We show that long-range inhibition is not a prerequisite for amplification. This is because the negative feedback loop consists of excitatory and inhibitory synapses in series, and the range of this loop is always longer than the monosynaptic positive feedback. Long-range inhibition is, however, necessary to stabilize the asynchronous state in the Mexican-hat regime, if the inhibitory conductance is not faster than the excitatory ones. Indeed, in visual cortex the long axons of GABAergic basket cells may provide the substrate for long-range inhibition (23).
Possible Role of NMDA Synapses.
A potential source for slow excitatory conductances in cortical recurrent dynamics is NMDA-mediated receptors. Other recent models have proposed a role for NMDA synapses in the cortical dynamics (20, 21). As we show here, stability of the Mexican-hat state with short-range inhibition can be achieved when a sizable fraction of the total excitatory conductance is slow compared to the inhibition, even though the fast excitatory component contributes significantly to the total positive feedback. Indeed, several experiments suggest that NMDA-mediated currents constitute a large fraction of the excitatory current in cortex (20, 24), although the ratio of NMDA to α-amino-3-hydroxy-5-methyl-4-isoxazolepropionic acid (AMPA) conductances in adult visual cortex is not known.
Orientation Tuning and Pinwheel Architecture.
One of the main results of this work is that the Mexican-hat state differs qualitatively from the inhibitory regime in the 2D layout of orientation tuning. In the regime where cortical feedback is predominantly inhibitory, OS is sharp at the pinwheel centers and is considerably broadened far from the centers, in agreement with previous numerical work. We show that in this regime, the peak firing rate should be significantly higher near the center. In contrast, when cortical excitation is substantial, OS width as well as peak firing rate are maximal at intermediate distance from the centers. Furthermore, in a suitable choice of parameters of the Mexican-hat interactions, the distance dependence of the cortical activity pattern is weak, yielding a roughly uniform OS along an orientation column. Further experimental studies of the relation between OS and the pinwheel singularities will be important for elucidating the involvement of cortical circuitry in orientation processing.
Relation to Previous Work.
This work differs from most previous models of visual cortex in that it does not assume feature specificity of the connections. Instead, connections are assumed to depend only on cortical distances. In addition, lateral inhibition is not assumed to be global or of larger extent than excitation. This architecture is closely related to that used in the recent large-scale numerical study by McLaughlin et al. (14) of layer 4Cα in macaque V1. Their work studied the inhibitory regime (type IV) in a large-scale network of conductance-based integrate-and-fire cells. Its complexity precludes a systematic survey of a large parameter range. Shelley and McLaughlin (17) analyzed this network near and far from pinwheel centers by using nonlinear rate models in the inhibitory regime. Here we simplify the neuronal dynamics further by using linear rate equations and gain analytical solutions. Other analytical studies of spatial patterns in V1 have focused only on the long-range connectivity while ignoring the pinwheel orientation architecture (22, 25), or used a 1D “ring” model of an orientation hypercolumn (3, 4). The ring model has been recently extended to incorporate both orientation and spatial frequency tuning (26). In this work we extend the power of analytical study of large networks to the study of the local 2D architecture of V1. The methods developed here allowed us to map the phase diagram of the system and to specifically address the conditions for the existence of stable Mexican-hat states and their properties.
Limitations of the Model.
For the sake of simplicity, we have ignored inhibitory–inhibitory interactions. A more comprehensive analysis shows that incorporating these interactions does not change the qualitative conclusions of our work. Our rate equations ignore the effects of active currents on the network state. Although this rate model is suitable for calculating the properties of stationary (namely asynchronous) states due to spatial averaging, more work is needed to elucidate the effect of spike-related mechanisms on the stability of these states. The present analytical solution was confined to the linear regime where all the cells are above firing threshold. Our numerical simulations (data not shown) indicate that in the studied parameter regime, adding a high firing threshold does not change the qualitative behavior of the network aside from the thresholding the activity profiles predicted by the linear solution.
Mexican Hats and Multiple Attractors.
When the peak value of the Mexican-hat feedback is sufficiently large, the linear state becomes unstable. When this instability line is crossed (dotted line in Figs. 5 and 7), the system settles into a nonlinear marginal phase. This phase is characterized by having a continuum of states, spatially modulated on intrinsic scales, which emerge in the system spontaneously in the absence of modulated inputs. This multiplicity of “attractors” is a key feature in network models of working memory, head direction systems, and other spatial memory systems (7). Mexican-hat feedback is crucial for the appearance of the spatially tuned “bump” states in these models. Thus our work puts substantial constraints on the spatial and temporal connectivity features of these networks. A similar conclusion is reached in studying the stability of bump states in a 1D network (19).
Acknowledgments
We thank R. Shapley, D. McLaughlin, and L. Tao for very helpful discussions. We acknowledge grant support of the U.S.A.–Israel Binational Science Foundation and the Sloan Foundation for the New York University Theoretical Neurobiology Program.
Abbreviations
- V1
primary visual cortex
- LGN
lateral geniculate nucleus
- OS
orientation selectivity
- NMDA
N-methyl-d-aspartate
References
- 1.Douglas R J, Koch C, Mahowald M, Martin K A C, Suarez H H. Science. 1995;269:981–985. doi: 10.1126/science.7638624. [DOI] [PubMed] [Google Scholar]
- 2.Somers D, Nelson S, Sur M. J Neurosci. 1995;15:5448–5465. doi: 10.1523/JNEUROSCI.15-08-05448.1995. [DOI] [PMC free article] [PubMed] [Google Scholar]
- 3.Ben-Yishai R, Bar-Or R, Sompolinsky H. Proc Natl Acad Sci USA. 1995;92:3844–3848. doi: 10.1073/pnas.92.9.3844. [DOI] [PMC free article] [PubMed] [Google Scholar]
- 4.Hansel D, Sompolinsky H. In: Methods in Neuronal Modeling: From Ions to Networks. 2nd Ed. Koch C, Segev I, editors. Boston: MIT Press; 1998. pp. 499–567. [Google Scholar]
- 5.Ernst U A, Pawelzik K R, Sahar-Pikielny C, Tsodyks M V. Nat Neurosci. 2001;4:431–436. doi: 10.1038/86089. [DOI] [PubMed] [Google Scholar]
- 6.Sompolinsky H, Shapley R. Curr Opin Neurobiol. 1997;7:514–522. doi: 10.1016/s0959-4388(97)80031-1. [DOI] [PubMed] [Google Scholar]
- 7.Wang X-J. Trends Neurosci. 2001;24:455–463. doi: 10.1016/s0166-2236(00)01868-3. [DOI] [PubMed] [Google Scholar]
- 8.Salinas E, Abbott L F. Proc Natl Acad Sci USA. 1996;93:11956–11961. doi: 10.1073/pnas.93.21.11956. [DOI] [PMC free article] [PubMed] [Google Scholar]
- 9.Hahnloser R H, Sarpeshkar R, Mahowald M A, Douglas R J, Seung H S. Nature. 2000;405:947–951. doi: 10.1038/35016072. [DOI] [PubMed] [Google Scholar]
- 10.Fitzpatrick D, Lund J, Blasdel G. J Neurosci. 1985;5:3329–3349. doi: 10.1523/JNEUROSCI.05-12-03329.1985. [DOI] [PMC free article] [PubMed] [Google Scholar]
- 11.Callaway E. Annu Rev Neurosci. 1998;21:47–74. doi: 10.1146/annurev.neuro.21.1.47. [DOI] [PubMed] [Google Scholar]
- 12.Bosking W H, Zhang Y, Scofield B, Fitzpatrick D. J Neurosci. 1997;17:2112–2127. doi: 10.1523/JNEUROSCI.17-06-02112.1997. [DOI] [PMC free article] [PubMed] [Google Scholar]
- 13.Das A, Gilbert C. Nature. 1999;399:655–661. doi: 10.1038/21371. [DOI] [PubMed] [Google Scholar]
- 14.McLaughlin D, Shapley R, Shelley M, Wielaard D J. Proc Natl Acad Sci USA. 2000;97:8087–8092. doi: 10.1073/pnas.110135097. [DOI] [PMC free article] [PubMed] [Google Scholar]
- 15.Maldonado P E, Godecke I, Gray C M, Bonhoeffer T S. Science. 1997;276:1551–1555. doi: 10.1126/science.276.5318.1551. [DOI] [PubMed] [Google Scholar]
- 16.Ermentrout G B. Neural Comput. 1994;6:679–695. [Google Scholar]
- 17.Shelley M, McLaughlin D. J Comp Neurosci. 2002;12:97–122. doi: 10.1023/a:1015760707294. [DOI] [PubMed] [Google Scholar]
- 18.Wilson H, Cowan J. Kybernetik. 1973;13:55–80. doi: 10.1007/BF00288786. [DOI] [PubMed] [Google Scholar]
- 19.Pinto D, Ermentrout G B. SIAM J Appl Math. 2001;62:226–243. [Google Scholar]
- 20.Wang X-J. J Neurosci. 1999;19:9587–9603. doi: 10.1523/JNEUROSCI.19-21-09587.1999. [DOI] [PMC free article] [PubMed] [Google Scholar]
- 21.Krukowski A, Miller K. Nat Neurosci. 2001;4:424–430. doi: 10.1038/86084. [DOI] [PubMed] [Google Scholar]
- 22.Ermentrout G B, Cowan J D. Biol Cybern. 1979;34:137–150. doi: 10.1007/BF00336965. [DOI] [PubMed] [Google Scholar]
- 23.Buzas P, Eysel U T, Adorjan P, Kisvarday Z F. J Comp Neurol. 2001;437:259–285. doi: 10.1002/cne.1282. [DOI] [PubMed] [Google Scholar]
- 24.Feldmeyer D, Egger V, Lubke J, Sakmann B. J Physiol (London) 1999;521:169–190. doi: 10.1111/j.1469-7793.1999.00169.x. [DOI] [PMC free article] [PubMed] [Google Scholar]
- 25.Bressloff P C, Cowan J D, Golubitsky M, Thomas P J, Wiener M. Neural Comput. 2002;14:473–491. doi: 10.1162/089976602317250861. [DOI] [PubMed] [Google Scholar]
- 26.Bresslof P C, Cowan J D. Phys Rev Lett. 2002;88:078102. doi: 10.1103/PhysRevLett.88.078102. (lett.). [DOI] [PubMed] [Google Scholar]


