

Abstract
The formation of the crypt-villus axis during gut ontogeny requires continued reciprocal interactions between the endoderm and mesenchyme. Epimorphin/syntaxin 2 (epimorphin) is a mesenchymal protein expressed in the fetal gastrointestinal tract during villus morphogenesis. To elucidate its role in gut ontogeny, the epimorphin cDNA was transfected, in sense and antisense orientations, into a rat intestinal myofibroblast cell line, MIC 216. To determine the effects of epimorphin on the epithelium, myofibroblasts were cocultured with the Caco2 cell line. Caco2 cells spread in a simple monolayer over antisense-transfected cells lacking epimorphin. In contrast, sense-transfected myofibroblasts induced Caco2 cells to form compact, round clusters with small lumens. These morphologic differences were preserved in Transwell cocultures in which cell-cell contact was prevented, suggesting that epimorphin’s effects were mediated by secreted factor(s). To determine the effects of epimorphin on crypt-villus axis formation in an in vivo model, rat gut endoderm was combined with epimorphin-transfected myofibroblasts and implanted into the chick intracoelomic cavity. The grafts in which epimorphin was overexpressed revealed multiple well-formed villi with crypt-like units, whereas those in which epimorphin expression was inhibited developed into round cystic structures without crypts or villi. Of several potential secreted morphogens, only the expression of bone morphogenetic protein 4 (Bmp4) was increased in the epimorphin-transfected cells. Incubation with noggin partially blocked the transfected myofibroblasts’ effects on Caco2 colony morphology. These results indicate that mesenchymal epimorphin has profound effects on crypt-villus morphogenesis, mediated in part by secreted factor(s) including the Bmp’s.
Introduction
The crypt-villus axis is the principal functional and anatomic unit of the small intestinal epithelium. Anchored stem cells in the crypts of Lieberkuhn give rise to proliferating daughter cells that differentiate into four major epithelial cell types, including the enterocyte, goblet cell, enteroendocrine cell, and Paneth cell. Following injuries to the intestine such as ischemia, irradiation, trauma, and small bowel resection, or during recovery from inflammatory diseases such as Crohn disease, rapid renewal of the epithelium is required to maintain a functional gut and adequate nutritional status.
Epithelial-mesenchymal interactions are critical for the normal morphogenesis and maintenance of the crypt-villus axis (1–5). Mesenchyme is required for the normal growth and differentiation of the endoderm. For example, in vitro differentiation of endoderm into enterocytes occurs only in the presence of fibroblasts or mesenchymal cells (1, 2). In some circumstances, mesenchyme directs regional specificity in the gut. For example, small bowel mesenchyme can instruct heterologous endoderm to express a small bowel phenotype (2, 4).
The molecules that regulate these reciprocal interactions are still being elucidated (6–12). Mesenchyme differentiates into the gut’s connective tissue components, including subepithelial myofibroblasts, fibroblasts, and smooth muscle. The subepithelial myofibroblast in particular plays an important role in fetal gut ontogeny and in the adult intestine (13). Located in the pericrypt region and in the lamina propria of the villus, these cells are required for gut epithelial repair. They are the source of growth factors such as HGF and bFGF as well as basement membrane/ECM proteins (11, 14). They also express Fkh6, a member of the winged helix family of transcription factors, and Nkx2-3, a homeodomain transcription factor. Targeted deletion of Fkh6 or Nkx2-3 leads to profound abnormalities in gut epithelial cell proliferation and crypt-villus morphology (10, 12). The hedgehog signaling pathway has also been implicated to play a critical role in early embryonic endoderm-mesenchymal interactions (9).
Epimorphin, a member of the syntaxin family of vesicle docking proteins, is a mesenchymal protein that is a putative regulator of epithelial morphogenesis (15). Studies of lung, skin, and mammary epithelium suggest a role for epimorphin in the formation of luminal, ductular, or branching structures during ontogeny (15–17). We have previously shown that epimorphin is expressed in fetal gut mesenchyme and in intestinal myofibroblasts (14), and that epimorphin mRNA levels increase markedly during crypt-villus morphogenesis (18). Epimorphin appears to function as a mesenchymal regulator of epithelial repair processes in gut and lung (18, 19). However, the role of epimorphin in gut morphogenesis has not been previously described.
To further examine its role in gut ontogeny, the effects of overexpression or inhibition of expression of epimorphin was examined in a rat intestinal myofibroblast cell line (14). The present studies show that overexpression of epimorphin induced marked changes in gut epithelium, in cocultures of myofibroblasts and epithelial (Caco2) cells in vitro, and in chick intracoelomic grafts in vivo, composed of rat gut endoderm and transfected rat myofibroblasts. Conversely, inhibition of myofibroblast epimorphin expression by antisense RNA expression prevented morphogenesis. The effect of epimorphin overexpression on Caco2 cell morphology was preserved in Transwell cocultures in which cell-cell contact was prevented. Expression of bone morphogenetic protein 4 (Bmp4) and patched, both targets of hedgehog signaling, was increased in epimorphin-transfected myofibroblasts. In addition, the Bmp4 antagonist, noggin, partially blocked the effects of epimorphin on the morphology of cocultured Caco2 cells. These results indicate that epimorphin exerts some of its effects via secreted morphogenetic factors, suggesting a novel regulatory function for this protein.
Methods
Cell lines.
The MIC 216 rat intestinal myofibroblast cell line (14) was grown in 5% CO2, in DMEM containing 10% FCS, 1% penicillin, and 1% streptomycin. The clones were passaged every 7 days about 15 times without altering their morphology or growth rate.
Construction of recombinant expression plasmid.
The full-length rat intestinal epimorphin/syntaxin 2 cDNA was cloned as follows: a rat ileal Lambda Zap II (Stratagene, La Jolla, California, USA) cDNA library (20) was screened by hybridization with a 350-bp fragment of the epimorphin cDNA (nucleotides 600–946) isolated by PCR as previously described (18). Positive clones were subjected to restriction analysis and DNA sequencing. A partial cDNA clone was isolated containing the entire syntaxin 2 coding region minus the first 317 bases from the 5′ end. The missing 5′ fragment was obtained by PCR using rat ileal RNA and primers derived from rat syntaxin 2 nucleotides 1–21 and 368–388 (21). The PCR fragment and partial cDNA clone were subjected to restriction digest by BclI, then re-ligated to produce the full-length cDNA, as verified by sequence analysis (21). EcoRI linkers were attached and the full-length cDNA was subcloned, in both sense (EpiS) and antisense (EpiAS) orientations, into the EcoRI site of pCEN, a dicistronic vector with an internal ribosomal entry site that has transcriptional activity in intestinal cell lines.
Cell transfections.
MIC 216 cells were transfected with the plasmids EpiS and EpiAS or with the control pCEN vector using the FuGENE 6 transfection reagent (Roche Molecular Biochemicals, Mannheim, Germany). Cells were seeded at 80% confluence in 24-well plates. The next day, standard culture medium was replaced by 1 ml of medium containing 1 μg of plasmid that had previously been incubated for 15 minutes at room temperature with FuGENE 6 reagent. After 48 hours at 37°C, selection was started by adding the antibiotic G418 (0.4 mg/ml) to the culture medium. Seven days later, the resistant population was subcloned by the limit dilution technique into 96-well plates, and the stable homogeneous clones were analyzed for their ability to express epimorphin/syntaxin 2.
Sources of antibodies.
Polyclonal anti–laminin 1 was raised as previously described (22). The mouse monoclonal anti–rat lactase (monoclonal antibody YBB/2/61) was provided by Andrea Quaroni (Cornell University, Ithaca, New York, USA). The mouse monoclonal anti–smooth muscle α-actin (1A4), anti-vimentin (VIM 13.2), and anti-desmin antibodies were purchased from Sigma-Aldrich (St. Louis, Missouri, USA). The polyclonal anti-tenascin was provided by R. Chiquet-Ehrismann (Friedrich Miescher Institut, Basel, Switzerland). The polyclonal anti–epimorphin/syntaxin 2 antibody was provided by Mark Bennett (Chiron Corp., Emeryville, California, USA) and Beatrice Quinones (University of California, Berkeley, Berkeley, California, USA). The polyclonal rabbit anti–mouse patched receptor antibody came from L. Burkly (Biogen Inc., Cambridge, Massachusetts, USA) and Nicholas Davidson (Washington University), and the polyclonal rabbit anti–mouse Hsp40 antibody was from Nicholas Davidson (Washington University).
Immunocytochemistry and histology.
The myofibroblast cell lines were grown on chamber slides (Nalge Nunc International, Naperville, Illinois, USA) and fixed in 1% paraformaldehyde in 1× PBS at room temperature for 10 minutes. Surface immunostaining was performed directly and intracellular staining was performed after permeabilization of the cells with 0.5% Triton X-100 for 10 minutes. Antibodies were diluted in PBS and applied for 1 hour at room temperature. After several washes, secondary antibodies labeled with sheep anti-mouse fluorescein (Institut Pasteur, Paris, France), sheep anti-mouse CY3 (Sigma-Aldrich), or goat anti-rabbit IgG fluorescein (Nordic Immunological Laboratories, Tilburg, the Netherlands) were applied for 1 hour. The cells were washed several times in PBS, mounted in phenylene-PBS-diamine medium, and examined under a fluorescence microscope (Axioskop 2; Carl Zeiss Jena GmbH, Jena, Germany).
For staining of the cocultures or the grafts, frozen sections of 5 μm thickness or paraffin sections were prepared and stained as described above. Morphological analysis was performed on tissues embedded in paraffin or after frozen sectioning and stained with hematoxylin and eosin and/or periodic acid–Schiff reagent.
RNA extraction.
RNA was extracted from cultured cells using Trizol reagent (Invitrogen BV, Groningen, the Netherlands) according to the recommendations of the supplier. After cell homogenization, the mixture was centrifuged for 5 minutes at 12,000 g to remove genomic DNA contained in the pellet. RNA concentration was determined by optical densitometry at 260 nm.
Northern blot hybridization.
Total RNA (20 μg per lane) was prepared, electrophoresed on 1.2% agarose and 2.2 M formaldehyde gels, and transferred to nylon membranes. Northern blot hybridization was performed as previously described (18). For analysis of Bmp4 expression, a 32P-labeled Bmp4 full-length cDNA probe (a kind gift of Brigid Hogan, Vanderbilt University, Nashville, Tennessee, USA, and Richard Pierce, Washington University) was used. Specific bands representing Bmp4 mRNA were quantified either by NIH Image 1.6 analysis of digitized images obtained with a UMAX Powerlook 1100 scanner using UMAX MagicScan version 4.4 (UMAX Technologies Inc., Dallas, Texas, USA) or using a Molecular Dynamics 425S PhosphorImager (Molecular Dynamics, Sunnyvale, California, USA). Data were normalized for differences in RNA loading and transfer by hybridizing the membranes sequentially with a 1.2-kb DNA fragment of the mouse 18S rRNA gene (Ambion Inc., Austin, Texas, USA).
RT-PCR.
Cells were grown for 7 days in T25 culture flasks, and total cellular RNA was extracted using Trizol reagent (Invitrogen BV). cDNA synthesis was carried out at 42°C in 20 μl of solution containing 5 μg RNA, 3.5 μM oligo(dT), 50 mM Tris-HCl (pH 8.3), 40 mM KCl, 8 mM MgCl2, 1 M DTT, 500 μM each dNTP, and 1 unit Enhanced Avian Reverse Transcriptase (Sigma-Aldrich).
The primers used and the PCR conditions were as follows. For GAPDH, the forward primer was 5′-GGCTGAGAACGGGAAGCTTGTGATCAATGG-3′, and the reverse primer was 5′-GTCGCTGTTGAAGTCAGAGGAGACCACCT-3′. PCR was performed with 25 cycles, with a product size of 685 bp. For syntaxin 1, the forward primer was 5′-GCCCTCAGTGAGATCGAG-3′, and the reverse primer was 5′-TACTTGACGGCCTTCTTGGT-3′. PCR was performed with 32 cycles, with a product size of 200 bp. For syntaxin 3, the forward primer was 5′-CGACCTTGAACAGCTCACAA-3′, and the reverse primer was 5′-GAAGTCCACCTGTGCCTCAT-3′. PCR was run for 32 cycles with a product size of 200 bp. For syntaxin 4, the forward primer was 5′-AGAGCCCCAGAAGGAAGAAG-3′, and the reverse primer was 5′-CAGACACCATTCCAGCATTG-3′. PCR was performed with 32 cycles with a product size of 200 bp. For 36B4, the forward primer was 5′-ATGTGAAGTCACTGTGCCAG-3′, and the reverse primer was 5′-GTGTAATCCGTCTCCACAGA-3′. PCR was performed with 22 cycles, with a product size of 420 bp. PCR analysis of TGFβ1, TGFβ2, and HGF expression was performed as described previously (4).
The PCR reaction mixture (50 μl) contained 1/10 (vol) cDNA, 50 pmol of each primer, 10 mM Tris-HCl (pH 8.3), 500 mM KCl, 1.5 mM MgCl2, 0.01% gelatin, 1 mM each dNTP, and 2.5 units of Taq DNA polymerase (Sigma-Aldrich). PCR was performed in an Amplitron II apparatus (Barnstead International, Dubuque, Iowa, USA). PCR reactions were run under the following conditions: 94°C for 3 minutes, followed by 22–32 cycles at 94°C for 30 seconds, 55°C for 1 minute, 72°C for 3 minutes, and extension at 72°C for 7 minutes. The number of cycles chosen corresponded to a window of exponential increase in the signal. As an internal standard, PCR was carried out with primers specific to GAPDH and 36B4 sequences. As PCR negative controls, the cDNA templates were replaced by 0.5 μg of RNA.
Gene expression profiling by DNA microarrays.
To determine the identity of putative myofibroblast morphogens that may mediate the effects of epimorphin on cocultured epithelial cells, total RNA was prepared from vector control (pCEN) and epimorphin-transfected clones grown for 7 days in culture. Biotinylated cRNA targets were prepared and hybridized to the high-density, oligonucleotide-based rat genomic U34 GeneChip set (Affymetrix Inc., Santa Clara, California, USA), containing 7,000 named genes and expressed sequence tags (ESTs) in chip A and an additional 14,000 ESTs in chips B and C. Experimental data from the chips are analyzed using the GeneChip Microarray Suite, version 4.0. For comparison between two chips, the “baseline chip” intensity values are measured and normalized to the average signal intensity. Intensity values of the experimental chip are then compared with the baseline chip and an average difference change is calculated. A search of the data set was performed to identify potential morphogens that exhibited differences of more than twofold in expression between the vector control and EpiS-transfected cells, a generally accepted standard for significance change (23, 24).
Epithelial cell line.
The human colon cancer cell line Caco2 was used. This cell line was cultured in DMEM containing 20% FCS, 1% nonessential amino acids, 1% penicillin, and 1% streptomycin.
Coculture experiments.
The Caco2 cells were seeded on top of subconfluent layers of the different fibroblast clones that had been precultured for 3–4 days in dishes 3 cm in diameter. The cocultures were maintained for 4 days or 10 days, respectively, recovered by scraping from the culture dishes, and used for routine histologic and immunocytochemical studies or Western blot.
To assess adherence of the Caco2 cells to the myofibroblasts, Caco2 cells (3 × 10³ cells per well) were plated onto the myofibroblasts. Two days later, the media was collected from cocultures containing each of the four cloned cell lines, and nonadherent cells in the media were counted. This experiment was performed in duplicate and no differences in Caco2 cell adherence were found among the four lines.
Intestinal epithelial cell–fibroblast Transwell coculture experiments.
Myofibroblast cell lines (3 × 10³ cells/well) were grown for 3 days in the basal compartment of a 24-well plate until confluent. Caco2 cells (3 × 10³ cells/Transwell) were cultured in the apical compartment of the Transwell (0.4 μm) with underlying fibroblasts. The cocultures were maintained for up to 10 days, and proliferation and morphology of the Caco2 cells grown on the Transwell membranes was assessed.
Inhibition of Bmp activity by noggin and noggin-conditioned media.
Myofibroblast cell lines were plated onto six-well plates and were grown for 3 days until confluent. For experiments with purified noggin, which binds Bmp4 and antagonizes its activity (25–27), Caco2 cells were plated onto myofibroblasts in media that was preincubated for 1 hour with purified mouse noggin/Fc chimera (R&D Systems Inc. Minneapolis, Minnesota, USA) at 1 μg/ml with 0.1% BSA added every 12 hours, or with vehicle control (media plus 0.1% BSA). Cells were incubated with noggin or vehicle control for 3 days and observed by inverted-phase microscopy. Noggin-conditioned media was a kind gift from David Beebe, Washington University School of Medicine, and was prepared as described previously (27, 28). Briefly, CHO B3 cells that express noggin or DHFR– control CHO cells were grown for 3 days in CHO–SFM II medium (Life Technologies Inc., Gaithersburg, Maryland, USA). The medium was collected, centrifuged at low speed, and frozen at –80°C (27). Caco2 cells were plated on myofibroblasts in either the noggin-conditioned media or control medium that was diluted 1:4 with DMEM prepared for Caco2 cells. At least four independent experiments were performed with noggin or noggin-conditioned media. Caco2 colony sizes were measured from photographs of cocultured myofibroblasts and Caco2 cells. At least five fields were observed for each experimental or control culture for experiments with noggin. The average size of the largest colonies from each field from control or noggin-treated cells was compared by Student t test.
Isolation of fetal intestinal endoderms.
Intact intestines were removed from fetal rat pups on embryonic day 14–15 and then incubated for 1 hour at 37°C in 0.125 U/ml collagenase (from Clostridium histolyticum; Roche Applied Science, Indianapolis, Indiana, USA) in CMRL 1066 medium (Invitrogen BV) at 37°C. The intestinal anlagen were then transferred to newborn calf serum/Ham’s F-10 (1:1) (Invitrogen BV) for an incubation period of at least 30 minutes. The endoderms were dissected free under a microscope using ophthalmic knives (29).
Grafting experiment.
Sheets of confluent fibroblasts were detached from the culture dishes with a curette and a needle-mounted probe. The sheets enveloped isolated 2-mm-long endodermal fragments. The associations were maintained overnight on a gelled medium in the incubator before grafting into the coelomic cavity of 3-day-old chick embryos. They were recovered 13 days later, embedded in Tissue-Tek, OCT cryosectioned, and analyzed by routine histologic techniques and by immunohistochemistry.
Measurement of growth response.
Cellular proliferation in the intestinal myofibroblast cell lines was quantified in 96-well microtiter plates up to 8 days after plating, using crystal violet dye binding techniques (23). At each timepoint, the cells were fixed in 70% ethanol, air dried, and stained with 0.1% crystal violet (pH 5.5) for 5 minutes at room temperature. The cultures were then washed in water, and the cell-bound dye was solubilized in 10% acetic acid and measured at an OD of 595 nm. Statistical analysis of the growth curves was performed using one-way ANOVA with the Tukey HSD post test at each timepoint.
Protein preparations and Western blots.
Western blot analysis of 7-day confluent cultures of mesenchymal clones or 10-day cocultures was performed by scraping the cells in a small volume of protein extraction buffer consisting of 0.1 M Tris-HCl at pH 8.0, 0.1 M NaCl, 0.5 M EDTA, 1% Triton X-100, and 1% Protease Inhibitor Cocktail (Sigma-Aldrich). Cell extracts were collected, homogenized by sonication, and clarified by centrifugation at 2,200 g for 15 minutes, and the supernatants were frozen at –80°C. Aliquots of cleared protein extracts were incubated for 5 minutes in Laemmli buffer containing 100 mM DTT and 2% SDS at 100°C. Proteins were separated on 4–12% SDS-PAGE gels and subsequently electrotransferred for 1 hour onto PVDF membranes in 25 mM Tris-HCl and 76 mM glycine, pH 8.2. After transfer, the PVDF membrane was saturated overnight at 4°C with 4% nonfat dry milk in buffer (0.03 M Tris-HCl at pH 7.6, 0.04% vol/vol Tween-20, 0.03% vol/vol AntifoamA (Sigma-Aldrich), and 0.1% vol/vol sodium azide) and then incubated for 1 hour at room temperature with specific antibodies. After reaction with the secondary antibody, PVDF membranes were treated with enhanced chemiluminescent reagent (Amersham Biosciences, Piscataway, New Jersey, USA). Prestained molecular mass markers were included in each gel. Relative abundance of epimorphin protein was quantified by NIH Image 1.6 analysis of digitized images of the specific bands, obtained with a UMAX Powerlook 1100 scanner using UMAX MagicScan version 4.4. All membranes were stained with India ink to check for equal protein loading and transfer in all lanes.
Results
Characterization of epimorphin sense- and antisense-transfected MIC 216 cell lines.
To determine the role of mesenchymal epimorphin during gut ontogeny, epimorphin levels were altered in the MIC 216 rat ileal subepithelial myofibroblast cell line. These cells express a low basal level of epimorphin/syntaxin 2 mRNA (14) and protein (Figure 1).
Figure 1.

Western blot analysis of epimorphin/syntaxin 2 expression in transfected MIC 216 cell lines. Total cellular proteins (25 μg or 50 μg per lane as indicated) were separated by reduced SDS-PAGE on 4–12% acrylamide gels, transferred to nitrocellulose, incubated with the polyclonal epimorphin/syntaxin 2 antibody, and then visualized with enhanced chemiluminescence reagent. (a) The 34-kDa band corresponds to the epimorphin/syntaxin 2 protein. MIC C: native MIC 216 cell line grown in media without G418. pCEN V: MIC 216 cells transfected with empty pCEN vector. (b) EpiAS1 and EpiAS2: Two independent clonal pCEN-antisense epimorphin/syntaxin 2 cell lines. (c) EpiS1, EpiS2, EpiS3, and EpiS5: Four independent clonal pCEN-epimorphin/syntaxin 2 (sense) transfected cell lines. (d) Quantitation of epimorphin/syntaxin 2 expression by NIH Image analysis of specific bands. C, control; V, vector; S, sense; AS, antisense.
MIC 216 cells were transfected with pCEN plasmid vector containing the full-length epimorphin cDNA in sense (EpiS1, EpiS2, EpiS3, and EpiS5) and antisense (EpiAS1 and EpiAS2) orientations, and controls were transfected with the pCEN vector alone. G418-resistant cell populations were subcloned; subcultures were derived from single cells. Epimorphin expression was analyzed by immunoblot after 7 days in culture. Compared with control cells transfected with the pCEN vector alone, epimorphin expression was approximately four to ten times higher in the EpiS1, -2, -3, and -5 clones. Conversely, epimorphin expression was inhibited in the EpiAS1 and EpiAS2 clones (Figure 1).
MIC 216 cells have been previously shown to express laminins, collagen type IV, vimentin, and smooth muscle α-actin, and they do not express desmin (14). Mesenchymal-epithelial interactions are modulated by the gut’s ECM, and specifically by components of the basement membrane, including the laminins and collagen type IV (11). Thus, the expression of cytoskeletal and basement membrane antigens was compared in the normal and transfected cell lines. All expressed laminin, collagen type IV, and vimentin, and none expressed desmin (data not shown). Smooth muscle α-actin was expressed in the control cells (Figure 2, a and b) and the EpiAS1- and EpiAS2-transfected cells (Figure 2, e and f). Smooth muscle α-actin staining was also present in the EpiS1 and EpiS2 cells, but expression was spotty and not detected in all cells (Figure 2, c and d).
Figure 2.

Immunocytochemical analysis of smooth muscle α-actin expression in permeabilized cells. (a) MIC 216 (b) pCEN (c) EpiS1 (d) EpiS2 (e) EpiAS1, and (f) EpiAS2 following 7 days of culture. Magnification: ×200.
To determine whether changes in epimorphin expression altered the expression of other syntaxins, RT-PCR was performed to detect syntaxin 1, -3, and -4 expression in all MIC 216 clones. Syntaxins 1 and 3 were not expressed in the myofibroblast clones. Syntaxin 4 was readily detectable by RT-PCR and its expression was the same in the epimorphin-transfected and control clones (data not shown).
Cellular proliferation in epimorphin-transfected and control myofibroblast clones.
Growth rates were determined for the EpiS- and EpiAS-transfected clones compared with the MIC 216 native myofibroblast cells and pCEN-transfected vector control cells (Figure 3). Growth rates varied among different clones, but this variation was not related to the presence or absence of epimorphin. For example, cellular proliferation was more rapid in EpiAS1 than in EpiAS2 clones by day 8 after plating. The cell number after 8 days of culture was significantly lower in populations transfected with EpiS1, EpiS2, EpiAS1, and EpiAS2 than in controls, but there was no significant difference between EpiS2 and EpiAS2 by day 6 (Figure 3).
Figure 3.

Effect of epimorphin/syntaxin 2 expression on the growth of MIC 216 cell lines. MIC 216 (diamonds), pCEN (squares), EpiS1 (triangles), EpiS2 (times symbols), EpiAS1 (asterisks), and EpiAS2 (circles) were plated at a cell density of 10,000 cells per well in 96-well plates. At various stages of the culture, ten wells for each experimental condition were fixed. Changes in the number of cells were measured using crystal violet staining as described in Methods. Experimental versus control cell lines were compared by one-way ANOVA for independent samples, followed by the Tukey HSD post test. *P < 0.01 for all clones on days 2 and 4, and all clones except EpiS2 versus EpiAS2 on day 8. On day 6, P < 0.01 for all experimental clones versus controls, and for EpiS1 versus EpiAS1.
Altered epimorphin expression in myofibroblasts affects the morphology of cocultured Caco2 cells in vitro.
To test the effects of epimorphin overexpression or inhibition on epithelial cell colony morphology, transfected myofibroblasts were cocultured with the human colon cancer cell line Caco2. Caco2 cells exhibit an enterocyte-like, differentiated phenotype upon achieving confluence in culture. Caco2 cells were seeded on top of subconfluent MIC 216, pCEN, EpiS1, EpiS2, EpiAS1, or EpiAS2 cells. The Caco2 cells adhered to the mesenchymal cell feeder layers within 24 hours after seeding. There were no differences in Caco2 cell adherence to the different clones (see Methods).
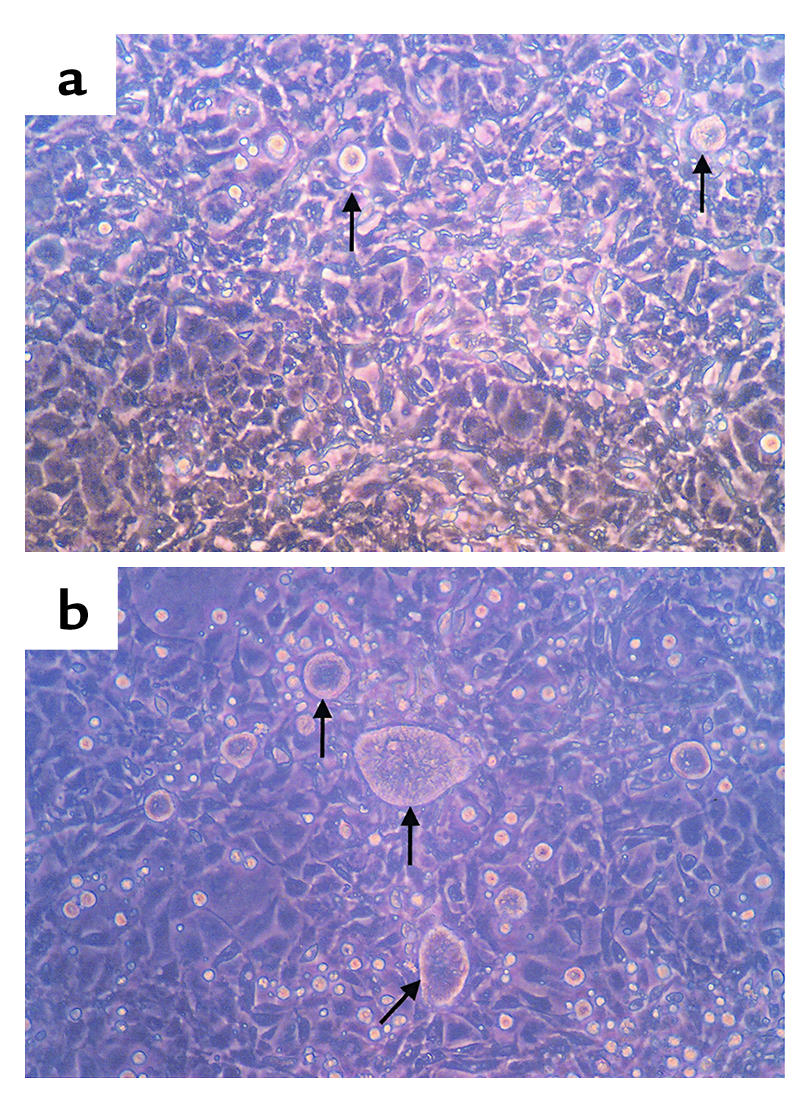
After 4 days of coculture, the diameter of many of the Caco2 cell colonies was reduced when cultured on EpiS1 or EpiS2 (Figure 4, c and d), compared with the EpiAS1 or EpiAS2 cocultures (Figure 4, e and f), and to a lesser extent compared with the MIC 216 and pCENcontrols (Figure 4, a and b). At this time, the reduction in Caco2 cell colony diameter compared with vector controls was most apparent in the EpiS1 coculture (Figure 4c). In contrast, Caco2 cell colonies cultured on EpiAS1 or EpiAS2 spread over the entire surface of the underlying myofibroblast cells (Figure 4, e and f).
Figure 4.

Morphologic analysis of epimorphin-transfected and normal MIC 216–Caco2 cocultures demonstrates effects on Caco2 cell morphology and spreading. Morphological features of Caco2 cells cocultured on top of confluent MIC 216 control and transfected cell lines. Phase-contrast microscopy shows living cocultures grown for 4 days in upper panels: (a) MIC 216 (b) pCEN (c) EpiS1 (d) EpiS2 (e) EpiAS1, and (f) EpiAS2; and cocultures grown for 10 days in lower panels: (g) pCEN (h) EpiS1 (i) EpiS2 (j) EpiAS1 (k) EpiAS2, and (l) MIC 216. Magnification: ×200.
The difference in growth and spreading of Caco2 cells on the different clones was even more apparent after 10 days of coculture (Figure 4, g–l). Small, round epithelial cell colonies were visible on EpiS1 or EpiS2 cells (Figure 4, h and i). In contrast, the Caco2 cells spread diffusely on top of the pCEN vector control cells and the MIC 216 native cells (Figure 4, g and l). These effects were even more pronounced in the EpiAS1 and EpiAS2 cocultures. Inhibition of epimorphin expression permitted Caco2 cells to spread over the entire surface of the EpiAS1 and EpiAS2 cells and to continue to grow past confluence (Figure 4, j and k).
Periodic acid–Schiff staining of the cocultured cells was performed on paraffin sections cut perpendicular to the cell bilayer (Figure 5). After 10 days of coculture, Caco2 cells grew into small spherical colonies on the EpiS2 cells (Figure 5, c and d) and EpiS1 cells (data not shown). Some of the colonies showed small lumina (Figure 5d). In contrast, Caco2 cells cocultured with the antisense clone EpiAs1 (Figure 5, e and f) spread in a monolayer over the transfected myofibroblast cells. Caco2 cells seeded on the pCEN control cells formed monolayers with small foci of stratified epithelium (Figure 5, a and b).
Figure 5.

Light microscopic analysis of Caco2–MIC 216 cocultures. Standard periodic acid–Schiff staining on 5-mm cryosections of 10-day cocultures composed of Caco2 cells and pCEN cells (a and b), EpiS2 cells (c and d), and EpiAS1 cells (e and f). Magnification in a, c, and e: ×100; in b, d, and f: ×200.
To demonstrate that epimorphin expression in the transfected MIC 216 clones was not altered by coculture with Caco2 cells, Western blot analysis was performed on total protein from Caco2 cells and from Caco2 cell–myofibroblast cocultures; a representative Western blot is shown in Figure 6a. Epimorphin was not expressed in Caco2 cells (data not shown). EpiS1–EpiS5 cells continued to overexpress epimorphin, and epimorphin expression was still inhibited in EpiAS1 and EpiAS2 cells (P < 0.01 for pCEN vs. EpiS or EpiAS, and EpiS vs. EpiAS, n = 2 independent experiments). Thus, the differences in Caco2 colony morphology correlated with alterations in epimorphin expression in the myofibroblast clones.
Figure 6.

Epimorphin/syntaxin 2 expression in Caco2–MIC 216 cocultures. Proteins from coculture extracts (25 μg per lane) were separated by reduced SDS-PAGE on 4–12% acrylamide gels, transferred to nitrocellulose, incubated with the polyclonal syntaxin 2 antibody, and then visualized with enhanced chemiluminescence reagent. (a) The 34-kDa band corresponds to the epimorphin/syntaxin 2 protein. (b) Epimorphin expression was quantified as in Methods, and the relative expression of epimorphin in each cell line is depicted.
Epimorphin’s effects on Caco2 cell colony morphology are partially preserved in a Transwell coculture model.
To determine whether epimorphin’s effects are mediated by a secreted factor or whether direct cell-cell contact is required, a Transwell coculture model was established in which the two cell populations were grown in proximity but without direct contact. Transfected or control myofibroblasts were grown on the bottom compartment and Caco2 cells were grown on the inserted filter. Despite the lack of direct contact, after 10 days of coculture the diameter of Caco2 colonies seeded on the EpiS1- and EpiS2-transfected cells (Figure 7, b and c) was still reduced compared with the pCEN-transfected control cultures (Figure 7a). However, the diameter of the Caco2 colonies was not as small as when cultured directly on EpiS-transfected fibroblasts. This suggested that secreted factors are at least partially responsible for mediating this effect. To assess whether or not epimorphin was secreted in the medium, Western blot analysis was performed on conditioned media collected from the cocultures and concentrated 100-fold. Epimorphin could not be detected in the media (data not shown).
Figure 7.

Effects of EpiS-transfected MIC 216 cells on Caco2 cell colony morphology are preserved in Transwell filter cocultures. Fibroblasts were cultured for 3 days in the outer well of Transwell filters. Caco2 cells were then seeded and cultured for 10 days on the top of the inner well membrane (0.4 mm). (a) Caco2 on pCEN cells, (b) Caco2 on EpiS1 cells, and (c) Caco2 on EpiS2 cells. Magnification: ×250.
Epimorphin expression in myofibroblasts affects epithelial morphogenesis in vivo.
To analyze the in vivo morphogenetic potential of epimorphin/syntaxin 2, EpiS2-, EpiAS1-, and control pCEN-transfected myofibroblasts were associated with fetal rat intestinal endoderm fragments, grafted into the coelomic cavity of chick embryos, and harvested after 13 days (Figure 8 and Figure 9). The grafts composed of the EpiS2-transfected cells plus endoderm were much larger in diameter than the grafts composed of the EpiAS1-transfected cells plus endoderm (P < 0.01, Figure 8). Histologic and immunohistochemical analyses revealed marked morphologic differences among the grafts. The morphologic features of the majority of the grafts in each group are illustrated in Figure 9. The grafts composed of the vector control cells developed short, flat villi and glandular structures (Figure 9, a and b), whereas the grafts composed of EpiS-transfected fibroblasts developed taller villus structures with small nascent crypts in the intervillus regions (Figure 9c). The lamina propria and the muscle appeared more organized in the EpiS grafts. In contrast, in the grafts composed of the antisense clone EpiAS1, there was no villus formation and the surface epithelium consisted of a flat monolayer (Figure 9d).
Figure 8.

Mean diameters of chick intracoelomic hybrid intestinal grafts derived from transfected MIC 216 myofibroblast-endodermal associations. Diameter was measured of grafts derived from the association of MIC 216 (n = 2), pCEN (n = 6), EpiS2 (n = 6), or EpiAS1 (n = 3) cells with intestinal endoderms. Data were analyzed by one-way ANOVA followed by the Tukey HSD post test. *P < 0.01 for EpiS2 versus EpiAS1.
Figure 9.

Chick intracoelomic grafts composed of endoderm plus transfected MIC 216 cells show a morphogenetic effect of epimorphin-syntaxin 2. Standard periodic acid–Schiff staining of 5-μm cryosections of 13-day-old grafts composed of intestinal endoderm and (a) MIC 216 (b) pCEN (c) EpiS2, and (d) EpiAS1 cells. Magnification: ×25.
Immunostaining was performed to detect the brush border protein lactase (Figure 10, a, e, and i) and laminin (Figure 10, d, h, and l). All grafts expressed lactase and laminin despite differences in morphology, and staining patterns appeared normal. Lactase immunostaining also delineated the presence of taller villi in the EpiS2 than in the pCEN control grafts (compare Figure 10e with Figure 10a) and a lack of villi in the EpiAS1 grafts (Figure 10i). In contrast, in the EpiS2 associations, immunodetection of smooth muscle α-actin revealed staining in well-organized muscular layers around the graft periphery and in connective tissue cells of the villus lamina propria (Figure 10f). The circular muscle staining was more orderly and organized in the EpiS2 grafts than in the vector control grafts and was completely disordered in the EpiAS1 grafts (Figure 10, b and j). Tenascin expression was markedly increased in the lamina propria of the grafts containing EpiS2 myofibroblasts (Figure 10g) compared with the controls (Figure 10c) or with the EpiAS1 grafts (Figure 10k).
Figure 10.

Immunofluorescent immunohistochemical analyses of intracoelomic hybrid intestinal grafts detecting lactase, smooth muscle α-actin, tenascin, or laminin 1 expression. Hybrid intestines composed of 14-day fetal intestinal endoderms surrounded by pCEN cells (a–d), EpiS2 cells (e–h), or EpiAS1 cells (i–l) were developed for 13 days in the coelomic cavity of chicken embryos. Immunostaining of lactase (a, e, and i), smooth muscle α-actin (b, f, and j), tenascin (c, g, and k), and laminin 1 (d, h, and l). Magnification in a, c–e, g–i, k, and l: ×200; in b, f, and j: ×100.
Bmp4 and patched expression are increased in epimorphin-transfected myofibroblasts.
As shown in Figure 7, Transwell culture experiments suggested that a secreted morphogen at least partially mediates myofibroblast epimorphin’s effects on the morphology of cocultured Caco2 cells. To identify the putative secreted factor or factors, RT-PCR was performed to quantify the expression of known growth factors that exhibit morphogenetic effects in epithelial tissues, including TGFβ1, HGF, and keratinocyte growth factor (KGF). These were either absent or their expression was unchanged in the epimorphin-transfected clones compared with the control clones (Table 1). Gene expression profiling using DNA microarrays was therefore performed, using total RNA prepared from control pCEN vector–transfected cells and from EpiS-transfected myofibroblasts grown for 7 days in culture. High-density, oligonucleotide-based DNA microarrays (Affymetrix Inc.) were used, including rat chip U34A, with 7,000 known rat genes and ESTs, and chips U34B and U34C with 7,000 ESTs each. Biotinylated cRNA targets were hybridized to each chip, and data were analyzed using the GeneChip Microarray Suite, version 4.0. The database was searched for morphogens that exhibited changes in expression greater than twofold in the epimorphin-transfected myofibroblast cells versus the pCEN control cells.
Table 1.
Expression of selected growth factors/morphogens in epimorphin-transfected versus control myofibroblasts

Notably, expression of Bmp4 was increased 4.15-fold in epimorphin-transfected cells compared with control pCEN vector cells. To verify this change in expression, Northern blot hybridization analysis was performed using a Bmp4 cDNA probe (Figure 11 and Table 1). There was a marked increase in Bmp4 expression in epimorphin-transfected myofibroblasts (Figure 11a) compared with pCEN control cells. To determine whether the increase in Bmp4 expression was seen in fibroblasts following coculture with epithelial cells, the transfected myofibroblast clones were cocultured with gut endoderm removed from fetal rat pups on embryonic day 14–15 (Figure 11, b and c). Bmp4 expression was also increased in the epimorphin-transfected myofibroblast-endoderm cocultures compared with the controls.
Figure 11.

Bmp4 expression is increased in epimorphin-transfected myofibroblasts. pCEN- and EpiS-transfected MIC 216 cell lines were grown for 7 days either alone (a) or with endoderm (+E) (b) and harvested. Total RNA was prepared and Northern blot hybridization analysis was performed using a 32P-radiolabeled full-length Bmp4 cDNA probe or a radiolabeled 18S rRNA probe for normalization. (c)Bands specific for Bmp4 mRNA or 18S were quantified as indicated in Methods and Bmp4 expression levels were determined.
Bmp4 is a signaling target of sonic hedgehog (Shh), one of three mammalian hedgehog proteins that is expressed in early gut endoderm and signals to the mesenchyme. To determine whether other members of this pathway are regulated in the epimorphin-transfected myofibroblasts, we examined expression of patched, the mesenchymal receptor for Shh. Microarray analysis indicated that patched expression was increased 3.75-fold (Table 1). Western blot analysis verified that patched expression was increased in the epimorphin-transfected cells compared with the pCEN controls (Figure 12, a and b). This was not just a general phenomenon in the epimorphin-transfected cells, since expression of Hsp40, an unrelated heat shock protein, was decreased in the EpiS cells compared with controls (Figure 12c). The specificity of the increase in Bmp4 among other growth factors/secreted morphogens was further demonstrated by our analysis of the microarray gene expression profiling data (Table 1), which confirmed and expanded upon the results of RT-PCR experiments.
Figure 12.

Expression of patched receptor is increased in epimorphin-transfected myofibroblasts. Caco2, pCEN vector control, or EpiS-transfected cells were harvested for total protein. (a, c) Protein extracts (50 μg per lane) were separated by reduced SDS-PAGE on 4–12% acrylamide gels, transferred to nitrocellulose, incubated with (a)the polyclonal patched antibody or (c) the polyclonal Hsp40 antibody, and then visualized with enhanced chemiluminescence reagent. (b) Bands specific for patched were quantified as indicated in Methods.
Incubation with noggin alters morphology of Caco2 colonies grown on epimorphin-transfected fibroblasts.
The Bmp4 antagonist, noggin, was used to examine whether or not Bmp4 mediates epimorphin’s effects on the morphology of cocultured Caco2 cells. Noggin binds to Bmp4 and prevents it from interacting with its receptors, thus antagonizing its effects (25–28). Epimorphin-transfected myofibroblasts were grown for 3 days in six-well plates. Caco2 cells were plated onto the myofibroblasts in the presence or absence of noggin (1 μg/ml), or with or without noggin-conditioned medium derived from CHO cells transfected with noggin cDNA (1:4 dilution in regular media) (28). Cocultures were grown for 3 days more in the presence or absence of noggin and observed by inverted-phase microscopy. As shown in Figure 13, incubation with noggin partially blocked the effect of epimorphin on Caco2 cell morphology. Although there was some variability in colony size, noggin-treated colonies were generally larger in diameter than control BSA-treated colonies (Figure 13). To quantify these differences, photomicrographs were taken of five independent fields from dishes containing noggin-treated or control vehicle-treated cocultured cells. The diameters of the largest colonies in each field were measured and were found to be significantly greater in the noggin-treated cultures than in control cultures (P < 0.007). This represented a partial effect, since noggin treatment did not result in the marked growth and spreading of Caco2 cells cocultured with antisense epimorphin-transfected myofibroblasts (see Figure 4).
Figure 13.
Effects of noggin, a Bmp-binding protein, on Caco2 colony morphology in myofibroblast-Caco2 cocultured cells. Epimorphin-transfected myofibroblasts were incubated with media containing noggin (1 μg/ml) or with control media, and Caco2 cells were plated onto the myofibroblasts. Cocultures were treated with noggin-containing or control media for 3 days and photomicrographs were obtained. (a) Control vehicle treatment. (b) Noggin-treated cocultures. Arrows depict Caco2 colonies. Magnification:×100.
Discussion
In the present studies, we have shown that myofibroblast epimorphin affects both the morphology of cocultured gut epithelial cells in vitro and crypt-villus formation/morphogenesis in vivo. In the coculture model, epimorphin overexpression in myofibroblasts altered Caco2 cell colony morphology, inducing the formation of round, compact epithelial colonies with small lumina. In contrast, these morphogenetic effects were blocked in cocultures in which epimorphin expression was inhibited. Epimorphin overexpression also supported crypt-villus morphogenesis in chick intracoelomic grafts composed of rat gut endoderm recombined with intestinal myofibroblasts. Conversely, inhibition of epimorphin expression completely eliminated the myofibroblasts’ ability to support crypt-villus formation in these grafts. These effects of epimorphin on gut epithelial cells have not been previously described, and provide evidence that mesenchymal epimorphin expression is required for gut epithelial morphogenesis. Thus, epimorphin is one of few known myofibroblast proteins that affect these processes. The profound lack of morphogenesis resulting from inhibition of epimorphin expression suggests that it plays a critical role in crypt-villus axis formation.
Although the growth curves of transfected myofibroblast clones differed from one another, these differences did not correlate with the morphogenetic capability of the cells. For example, both EpiS1 and EpiS2 clones exerted similar effects on Caco2 cells and on endoderm in the intracoelomic chick grafts, despite EpiS1’s slower growth rate. EpiAS1 and EpiAS2 clones also exhibited the same effects on the epithelium, independent of the differences in growth rate between these clones. Differences in proliferation also did not correlate with the presence or absence of epimorphin, since the EpiS2 and EpiAS2 clones demonstrated similar growth rates despite the marked difference in epimorphin expression levels.
Myofibroblasts produce a variety of basement membrane/ECM proteins that mediate morphogenetic effects on gut endoderm. We found that tenascin expression was markedly increased in the EpiS-endoderm intracoelomic grafts compared with the EpiAS and control vector grafts. The pattern of tenascin expression was similar to that in normal rat intestine (30). Tenascin is a mesenchymal ECM protein that is regulated during branching morphogenesis in epithelial tissues (31). It is also induced during neovascularization and wound healing. Epimorphin may directly influence the secretion of tenascin, consistent with epimorphin’s putative role as a regulator of myofibroblast secretion. Alternatively, tenascin expression may be indirectly altered in response to the morphogenesis induced by epimorphin. Further experiments using the myofibroblast cell lines alone and in coculture will be required to elucidate the underlying mechanisms of the changes in tenascin expression.
When cultured alone, the EpiS cells exhibited somewhat spotty, decreased smooth muscle α-actin expression. However, the EpiS-endoderm associations implanted into the chick coelomic cavity showed abundant expression. The smooth muscle was well organized, and its microscopic appearance was very similar to smooth muscle in vivo, unlike the vector control or antisense grafts. This suggests that myofibroblast epimorphin affects morphogenesis of multiple layers of the gut along the vertical axis.
At least part of epimorphin’s effects on crypt-villus formation and gut morphogenesis may be related to the secretion of Bmp4 and appears to involve the Shh signaling pathway. Our data from Transwell filter coculture experiments suggest that at least some of epimorphin’s effects may occur by regulating the secretion of, or interaction with, morphogenetic substances from fibroblasts. Epimorphin did not appear to affect the expression of other known morphogens produced by fibroblasts, such as HGF, KGF, or other TGF-β family members, as determined by RT-PCR analysis of the transfected myofibroblasts and by DNA microarray gene expression profiling analysis. Yet Bmp4 was markedly upregulated as shown by microarray analysis and confirmed by Northern blot hybridization. In addition, noggin, which binds Bmp4 and Bmp2 with high affinity and prevents interaction of the Bmp’s with their target receptors (25–28, 32–35), partially blocked the effects of epimorphin on Caco2 cell colony morphology. Bmp2 was not expressed in these cells (Table 1), suggesting that Bmp4 is the active family member in this system. The results from the noggin experiments are consistent with our experiments using Transwell filters (Figure 7), which showed that the changes in Caco2 colony morphology induced by epimorphin-transfected myofibroblasts were only partially preserved when direct cell-cell contact was disrupted. Taken together, the experiments using Transwell filters and noggin imply that secreted factors play a role in epimorphin’s effects, yet expression of the full phenotypic morphologic effect requires direct contact of epimorphin with the Caco2 cells.
Bmp4 is a secreted mesodermal molecule that is a target for Shh signaling (36, 37). Bmp4–/– mice die at gastrulation and show an absence of organized embryonic mesoderm (38). Shh is a secreted protein expressed in embryonic endoderm, and Shh–/– mice have a distinct gut phenotype (9). Shh and other members of the mammalian hedgehog gene family are coexpressed with Bmp4 in early embryonic development at sites of endodermal-mesenchymal interaction (37), and the concentric structure of the gut from epithelium to the lamina propria, submucosa, and smooth muscle layers appears to be regulated by Shh via patched/Bmp4 signaling in the mesenchyme (39). Our results showing that Bmp4 and patched expression are increased in epimorphin-transfected cells compared with control cells suggest that the Shh signaling pathway is involved in epimorphin’s effects on gut epithelial morphogenesis.
A direct morphogenetic effect of epimorphin has been supported by studies by Hirai and colleagues of mammary gland morphogenesis (15–17, 40). Epimorphin is expressed in the breast in stromal cells only; however, ectopic overexpression in mammary epithelial cells induced lumen formation, at least partly via regulation of C/EBP-β (40). Earlier studies (15–17) had suggested that high-molecular-weight multimeric forms of epimorphin are inserted into the plasma membrane, and that the active site of the protein is located extracellularly. More recent analyses have shown the presence of a smaller (30–kDa) soluble form of epimorphin in breast milk (40). Thus it has been postulated that epimorphin, present on the surface of breast stromal cells, may be removed by proteolytic cleavage at the cell surface and delivered into breast milk by transcytosis across the epithelial membrane or across junctions between epithelial cells (40), where it acts directly to induce lumen formation. Purified epimorphin also induces morphogenesis of endothelial and mammary cells in vitro (16, 17). In contrast, in our gut epithelial cell culture system, epimorphin itself was not secreted, as indicated by immunoblot analysis of concentrated media from myofibroblast-Caco2 coculture experiments and from Transwell coculture experiments. Also, immunoblots of myofibroblasts alone or of cocultured myofibroblast-Caco2 cells showed only a single 34-kDa epimorphin band (monomer); no higher or lower molecular weight forms were detected. Finally, other studies have shown that the rat homologue of epimorphin known as syntaxin 2 is a member of the syntaxin family of secretory vesicle docking proteins; syntaxin 2 has been shown by immunofluorescent studies to be membrane-bound, with a cytoplasmic location (21, 41). Therefore the precise cellular location and mechanism by which epimorphin exerts its morphogenetic effects may differ in a tissue-specific manner and thus remain to be clarified.
The postulation that epimorphin may regulate the secretion of morphogens from myofibroblasts is consistent with its homology to the syntaxins. These are intracellular secretory vesicle docking proteins that target exocytosis in neural and polarized epithelial cells such as pancreatic acinar cells (21). However, a role in regulating myofibroblast secretion has not been previously described. Studies of syntaxin 1A support this putative function, showing that syntaxin 1A was developmentally regulated in lung mesenchymal lipofibroblasts (42). The addition of a specific syntaxin 1A antibody to fetal lung organ cultures blocked dexamethasone and bombesin-like peptide induction of type II pneumocyte differentiation, which occurs only in the presence of lipofibroblasts (thought to be the source of secreted morphogens) (42).
Based on other studies of syntaxin function, there are other possible explanations for the preservation of epimorphin’s effects in Transwell cultures. For example, epimorphin may affect the function of other membrane-bound regulatory proteins or receptors for soluble morphogens (such as patched), or it might recruit membrane-bound receptor molecules from vesicles to the cell surface. Syntaxin 1A, which is expressed in adult lung and gut epithelia (43), also regulates the function of the cystic fibrosis transmembrane conductance regulator (CFTR) (44–46). Syntaxin 1A inhibits CFTR-mediated chloride transport by direct protein-protein interactions. This inhibition is reversed by the addition of purified Munc18 isoforms, which are syntaxin 1A–binding proteins (44). Also, syntaxin 4 plays a role in regulating Glut4 translocation to the plasma membrane in response to insulin (46). Thus, it is possible that patched, the Shh receptor (47), is a target for regulation by epimorphin.
In summary, our studies provide new evidence that epimorphin/syntaxin 2 affects gut epithelial morphogenesis. The role of the syntaxins in targeted vesicular secretion in neural cells has been well described, but their developmental regulation and effects on epithelial morphogenesis have received much less attention. Syntaxins affect developmental processes in Drosophila (48) and in plants (49), but their role in mammalian ontogeny remains to be clarified. Our results indicate that myofibroblast epimorphin has profound effects on cocultured Caco2 cells and on crypt-villus formation in myofibroblast-endodermal grafts. These effects are mediated at least in part by secreted factors that likely include Bmp4, suggesting a novel mode of action for epimorphin in epithelial-mesenchymal interactions during gut morphogenesis.
Acknowledgments
We gratefully acknowledge Michela Plateroti for contributing the MIC 216 cell line and David Beebe for advice. Excellent technical support was provided by Karen Hutton. These studies were supported by NIH National Institute of Diabetes and Digestive and Kidney Diseases grants DK-46122, DK-61216, DK-50466, and DK-52574, and the Morphology Core of the Digestive Diseases Research Core Center of Washington University. Christine Fritsch was supported by a postdoctoral fellowship award from the Association pour la Recherche sur le Cancer, Paris, France.
Footnotes
Christine Fritsch’s present address is: Novartis Ophthalmics AG, Basel, Switzerland.
Conflict of interest: The authors have declared that no conflict of interest exists.
Nonstandard abbreviations used: bone morphogenetic protein (Bmp); keratinocyte growth factor (KGF); sonic hedgehog (Shh).
References
- 1.Kedinger M, et al. Fetal gut mesenchyme induces differentiation of cultured intestinal endodermal and crypt cells. Dev Biol. 1986;113:474–483. doi: 10.1016/0012-1606(86)90183-1. [DOI] [PubMed] [Google Scholar]
- 2.Yasugi S. Role of epithelial-mesenchymal interactions in differentiation of epithelium of vertebrate digestive organs. Dev Growth Differ. 1993;35:1–9. doi: 10.1111/j.1440-169X.1993.00001.x. [DOI] [PubMed] [Google Scholar]
- 3.Birchmeier C, Birchmeier W. Molecular aspects of mesenchymal-epithelial interactions. Annu Rev Cell Biol. 1993;9:511–540. doi: 10.1146/annurev.cb.09.110193.002455. [DOI] [PubMed] [Google Scholar]
- 4.Duluc I, Freund JN, Leberquier C, Kedinger M. Fetal endoderm primarily holds the temporal and positional information required for mammalian intestinal development. J Cell Biol. 1994;126:211–221. doi: 10.1083/jcb.126.1.211. [DOI] [PMC free article] [PubMed] [Google Scholar]
- 5.Montgomery RK, Mulberg AE, Grand RJ. Development of the human gastrointestinal tract: twenty years of progress. Gastroenterology. 1999;116:702–731. doi: 10.1016/s0016-5085(99)70193-9. [DOI] [PubMed] [Google Scholar]
- 6.Roberts DJ, Smith DM, Goff DJ, Tabin CJ. Epithelial-mesenchymal signaling during the regionalization of the chick gut. Development. 1998;125:2791–2801. doi: 10.1242/dev.125.15.2791. [DOI] [PubMed] [Google Scholar]
- 7.Smith DM, Nielsen C, Tabin CJ, Roberts DJ. Roles of BMP signaling and Nkx2.5 in patterning at the chick midgut-foregut boundary. Development. 2000;127:3671–3681. doi: 10.1242/dev.127.17.3671. [DOI] [PubMed] [Google Scholar]
- 8.Roberts DJ. Molecular mechanisms of development of the gastrointestinal tract. Dev Dyn. 2000;219:109–120. doi: 10.1002/1097-0177(2000)9999:9999<::aid-dvdy1047>3.3.co;2-y. [DOI] [PubMed] [Google Scholar]
- 9.Ramalho-Santos M, Melton DA, McMahon AP. Hedgehog signals regulate multiple aspects of gastrointestinal development. Development. 2000;127:2763–2772. doi: 10.1242/dev.127.12.2763. [DOI] [PubMed] [Google Scholar]
- 10.Kaestner KH, Silberg DG, Traber PG, Schutz G. The mesenchymal winged helix transcription factor Fkh6is required for the control of gastrointestinal proliferation and differentiation. Genes Dev. 1997;11:1583–1595. doi: 10.1101/gad.11.12.1583. [DOI] [PubMed] [Google Scholar]
- 11.Kedinger, M., Olsen, J., Fritsch, C., Simon-Assmann, P., and Freund, J.N. 1999. Regulation of the epithelial-mesenchymal cross-talk in the gut. In Intestinal mucosa and its diseases. Pathophysiology and clinics. W. Domschke, R. Stoll, T.A. Brasitus, and M.F. Kagnoff, editors. Kluwer Academic Publishers. Dordrecht, the Netherlands. 153–166.
- 12.Pabst O, Zweigerdt R, Arnold HH. Targeted disruption of the homeobox transcription factor Nkx2-3 results in postnatal lethality and abnormal development of small intestine and spleen. Development. 1999;126:2215–2225. doi: 10.1242/dev.126.10.2215. [DOI] [PubMed] [Google Scholar]
- 13.Powell DW, et al. Myofibroblasts. II. Intestinal subepithelial myofibroblasts. Am J Physiol. 1999;277:C183–C201. doi: 10.1152/ajpcell.1999.277.2.C183. [DOI] [PubMed] [Google Scholar]
- 14.Plateroti M, et al. Subepithelial fibroblast cell lines raised from different levels of the gut axis display regional characteristics. Am J Physiol. 1998;274:G945–G954. doi: 10.1152/ajpgi.1998.274.5.G945. [DOI] [PubMed] [Google Scholar]
- 15.Hirai Y, Takebe K, Takashina M, Kobayashi S, Takeichi M. Epimorphin: a mesenchymal protein essential for epithelial morphogenesis. Cell. 1992;69:471–481. doi: 10.1016/0092-8674(92)90448-l. [DOI] [PubMed] [Google Scholar]
- 16.Oka Y, Hirai Y. Inductive influences of epimorphin on endothelial cells in vitro. Exp Cell Res. 1996;222:189–198. doi: 10.1006/excr.1996.0024. [DOI] [PubMed] [Google Scholar]
- 17.Hirai Y, et al. Epimorphin functions as a key morphoregulator for mammary epithelial cells. J Cell Biol. 1998;140:159–169. doi: 10.1083/jcb.140.1.159. [DOI] [PMC free article] [PubMed] [Google Scholar]
- 18.Goyal A, Singh R, Swietlicki EA, Levin MS, Rubin DC. Characterization of rat intestinal epimorphin/syntaxin 2 expression suggests a role in crypt-villus morphogenesis. Am J Physiol. 1998;275:G114–G124. doi: 10.1152/ajpgi.1998.275.1.G114. [DOI] [PubMed] [Google Scholar]
- 19.Fang KC. Mesenchymal regulation of alveolar repair in pulmonary fibrosis. Am J Respir Cell Mol Biol. 2000;23:142–145. doi: 10.1165/ajrcmb.23.2.f195. [DOI] [PubMed] [Google Scholar]
- 20.Dodson BD, Wang JL, Swietlicki EA, Rubin DC, Levin MS. Analysis of cloned cDNAs differentially expressed in adaptive remnant small intestine after partial resection. Am J Physiol. 1996;271:G347–G356. doi: 10.1152/ajpgi.1996.271.2.G347. [DOI] [PubMed] [Google Scholar]
- 21.Bennett MK, et al. The syntaxin family of vesicular transport receptors. Cell. 1993;74:863–873. doi: 10.1016/0092-8674(93)90466-4. [DOI] [PubMed] [Google Scholar]
- 22.Plateroti M, Freund JN, Leberquier C, Kedinger M. Mesenchyme-mediated effects of retinoic acid during rat intestinal development. J Cell Sci. 1997;110:1227–1238. doi: 10.1242/jcs.110.10.1227. [DOI] [PubMed] [Google Scholar]
- 23.Mysorekar IU, Mulvey MA, Hultgren SJ, Gordon JI. Molecular regulation of urothelial renewal and host defenses during infection with uropathogenic Escherichia coli. J Biol Chem. 2002;277:7412–7419. doi: 10.1074/jbc.M110560200. [DOI] [PubMed] [Google Scholar]
- 24.Fambrough D, McClure KL, Kazlauskas AL, Lander ES. Diverse signaling pathways activated by growth factor receptors induce broadly overlapping, rather than independent, sets of genes. Cell. 1999;97:727–741. doi: 10.1016/s0092-8674(00)80785-0. [DOI] [PubMed] [Google Scholar]
- 25.Zimmerman LB, De Jesus-Escobar JM, Harland RM. The Spemann organizer signal noggin binds and inactivates bone morphogenetic protein 4. Cell. 1996;86:599–606. doi: 10.1016/s0092-8674(00)80133-6. [DOI] [PubMed] [Google Scholar]
- 26.Brunet LJ, McMahon JA, McMahon AP, Harland RM. Noggin, cartilage morphogenesis, and joint formation in the mammalian skeleton. Science. 1998;280:1455–1457. doi: 10.1126/science.280.5368.1455. [DOI] [PubMed] [Google Scholar]
- 27.Belecky-Adams TL, Adler R, Beebe DC. Bone morphogenetic protein signaling and the initiation of lens fiber cell differentiation. Development. 2002;129:3795–3802. doi: 10.1242/dev.129.16.3795. [DOI] [PubMed] [Google Scholar]
- 28.Lamb TM, et al. Neural induction by the secreted polypeptide noggin. Science. 1993;262:713–718. doi: 10.1126/science.8235591. [DOI] [PubMed] [Google Scholar]
- 29.Fritsch C, et al. Characterization of human intestinal stromal cell lines: response to cytokines and interactions with epithelial cells. Exp Cell Res. 1999;248:391–406. doi: 10.1006/excr.1999.4414. [DOI] [PubMed] [Google Scholar]
- 30.Aufderheide E, Ekblom P. Tenascin during gut development: appearance in the mesenchyme, shift in molecular forms and dependence on epithelial-mesenchymal interactions. J Cell Biol. 1988;107:2341–2349. doi: 10.1083/jcb.107.6.2341. [DOI] [PMC free article] [PubMed] [Google Scholar]
- 31.Jones PL, Jones FS. Tenascin-C in development and disease: gene regulation and cell function. Matrix Biol. 2000;19:581–596. doi: 10.1016/s0945-053x(00)00106-2. [DOI] [PubMed] [Google Scholar]
- 32.Lim DA, et al. Noggin antagonizes BMP signaling to create a niche for adult neurogenesis. Neuron. 2000;28:713–726. doi: 10.1016/s0896-6273(00)00148-3. [DOI] [PubMed] [Google Scholar]
- 33.Bhardwaj G, et al. Sonic hedgehog induces the proliferation of primitive human hematopoietic cells via BMP regulation. Nat Immunol. 2001;2:172–180. doi: 10.1038/84282. [DOI] [PubMed] [Google Scholar]
- 34.Gratsch TE, O’Shea KS. Noggin and chordin have distinct activities in promoting lineage commitment of mouse embryonic stem (ES) cells. Dev Biol. 2002;245:83–94. doi: 10.1006/dbio.2002.0629. [DOI] [PubMed] [Google Scholar]
- 35.Botchkarev VA, et al. Noggin is required for induction of the hair follicle growth phase in postnatal skin. FASEB J. 2001;15:2205–2214. doi: 10.1096/fj.01-0207com. [DOI] [PubMed] [Google Scholar]
- 36.Roberts DJ, et al. Sonic hedgehog is an endodermal signal inducing Bmp-4 and Hox genes during induction and regionalization of the chick hindgut. Development. 1995;121:3163–3174. doi: 10.1242/dev.121.10.3163. [DOI] [PubMed] [Google Scholar]
- 37.Bitgood MJ, McMahon AP. Hedgehog and Bmp genes are coexpressed at many diverse sites of cell-cell interaction in the mouse embryo. Dev Biol. 1995;172:126–138. doi: 10.1006/dbio.1995.0010. [DOI] [PubMed] [Google Scholar]
- 38.Winnier G, Blessing M, Labosky PA, Hogan B. Bone morphogenetic protein-4 (Bmp-4) is required for mesoderm formation and patterning in the mouse. Genes Dev. 1995;9:2105–2116. doi: 10.1101/gad.9.17.2105. [DOI] [PubMed] [Google Scholar]
- 39.Sukegawa A, et al. The concentric structure of the developing gut is regulated by Sonic hedgehog derived from endodermal epithelium. Development. 2000;127:1971–1980. doi: 10.1242/dev.127.9.1971. [DOI] [PubMed] [Google Scholar]
- 40.Hirai Y, et al. Epimorphin mediates mammary luminal morphogenesis through control of C/EBPβ. J Cell Biol. 2001;153:785–794. doi: 10.1083/jcb.153.4.785. [DOI] [PMC free article] [PubMed] [Google Scholar]
- 41.Quinones B, Riento K, Olkkonen VM, Hardy S, Bennett MK. Syntaxin 2 splice variants exhibit differential expression patterns, biochemical properties and subcellular locations. J Cell Sci. 1999;112:4291–4304. doi: 10.1242/jcs.112.23.4291. [DOI] [PubMed] [Google Scholar]
- 42.Brimhall BB, et al. Syntaxin 1A is transiently expressed in fetal lung mesenchymal cells: potential developmental roles. Am J Physiol. 1999;277:L401–L411. doi: 10.1152/ajplung.1999.277.2.L401. [DOI] [PubMed] [Google Scholar]
- 43.Naren AP, et al. Syntaxin 1A is expressed in airway epithelial cells, where it modulates CFTR Cl–currents. J Clin Invest. 2000;105:377–386. doi: 10.1172/JCI8631. [DOI] [PMC free article] [PubMed] [Google Scholar]
- 44.Naren AP, et al. Regulation of CFTR chloride channels by syntaxin and Munc18 isoforms. Nature. 1997;390:302–305. doi: 10.1038/36882. [DOI] [PubMed] [Google Scholar]
- 45.Naren AP, Quick MW, Collawn JF, Nelson DJ, Kirk KL. Syntaxin 1A inhibits CFTR chloride channels by means of domain-specific protein-protein interactions. Proc Natl Acad Sci USA. 1998;95:10972–10977. doi: 10.1073/pnas.95.18.10972. [DOI] [PMC free article] [PubMed] [Google Scholar]
- 46.Kawanishi M, et al. Role of SNAP23 in insulin-induced translocation of GLUT4 in 3T3-L1 adipocytes. Mediation of complex formation between syntaxin4 and VAMP2. J Biol Chem. 2000;275:8240–8247. doi: 10.1074/jbc.275.11.8240. [DOI] [PubMed] [Google Scholar]
- 47.Kalderon D. Transducing the hedgehog signal. Cell. 2000;103:371–374. doi: 10.1016/s0092-8674(00)00129-x. [DOI] [PubMed] [Google Scholar]
- 48.Burgess RW, Deitcher DL, Schwartz TL. The synaptic protein syntaxin 1 is required for cellularization of Drosophila embryos. J Cell Biol. 1997;138:861–875. doi: 10.1083/jcb.138.4.861. [DOI] [PMC free article] [PubMed] [Google Scholar]
- 49.Lukowitz W, Mayer U, Jurgens G. Cytokinesis in the Arabidopsis embryo involves the syntaxin related KNOLLE gene product. Cell. 1996;84:61–71. doi: 10.1016/s0092-8674(00)80993-9. [DOI] [PubMed] [Google Scholar]