Abstract
We have compared the effect of microwave irradiation and of conventional heating on the fluorescence of solution-based green fluorescent protein. A specialized near-field 8.5 GHz microwave applicator operating at 250 mW input microwave power was used. The solution temperature, the intensity, and the spectrum of the green fluorescent protein fluorescence 1), under microwave irradiation and 2), under conventional heating, were measured. In both cases the fluorescence intensity decreases and the spectrum becomes red-shifted. Although the microwave irradiation heats the solution, the microwave-induced changes in fluorescence cannot be explained by heating alone. Several possible scenarios are discussed.
INTRODUCTION
The ever-increasing number of cellular phones, base stations, digital mobile communication systems, and other portable devices operating at microwave frequencies, motivates the scientific community to deeply understand the mechanism of interaction between microwave radiation and biological systems. One powerful approach to this problem is studying the effect of microwave irradiation on protein conformation.
There is substantial evidence that the microwave radiation effect on biomolecules in solution and living tissues cannot be entirely reduced to macroscopic heating. In particular, Bohr and Bohr (1) have recently argued for the existence of the unique microwave effect in their experiments with folding/unfolding of the β-lactoglobulin under microwave irradiation; De Pomerai et al. (2,3) claimed very specific kinetics of green fluorescent protein reporter induction in PC161 worms under prolonged exposure to microwaves; Porcelli et al. (4) have shown a nonthermal irreversible inactivation of some enzymes after extended exposure to 10.4 GHz microwave radiation; Mancinelli et al. (5) have demonstrated slower refolding kinetics of tuna myoglobin protein due to prolonged exposure at 1.95 GHz at a nonthermal level; and Hamad-Schifferli et al. (6) reported microwave heating of solution-based DNA with attached gold particles where the effective temperature of the DNA exceeded the solution temperature by 13°C. However, when the biomolecule is in the crystalline form, the effect of microwave irradiation is indistinguishable from conventional heating (7).
The theoretical analysis of microwave interaction with biological systems does not leave many possibilities for the nonthermal microwave effect on biological systems. In particular, Adair (8) showed that the resonance excitation of biological molecules in solution at microwave frequencies is highly improbable. Foster (9) demonstrated that thermal gradients on the nanometric scale are exceedingly small. The recent overviews (9,10) summarize possible mechanisms of microwave interaction with biological systems. A thorough analysis of possible microwave interaction with proteins in solution can also be found in Weissenborn et al. (7).
Most of the experimental works in this area compare the properties of the sample before and after microwave irradiation, i.e., they focus on irreversible effects. Only a few works study the properties of biomolecules and tissues during microwave irradiation (1,6,11). In particular, Gellermann et al. (11) used proton nuclear magnetic resonance frequency shift as a real-time sensor of the tissue temperature under RF-exposure. A similar task can be done with the fluorescing proteins which are known for their great asset of monitoring chemical and biological processes (12). Our idea is to study the effect of microwave radiation on the fluorescence of such proteins in solution in real time.
For this purpose, we chose the green fluorescent protein (GFP). This molecule has a very specific structure. Indeed, in the folded state it has a barrel shape, where the walls of the barrel are composed of several antiparallel β-sheets connected to α-helical stretches. One of these stretches extends to the interior of the β-barrel and forms the fluorescent chromophore, which is a p-hydroxybenzylidene-imidazolidinone generated by cyclization and oxidation of the Ser-Tyr-Gly sequence at positions 65, 66, and 67 (13). These three amino acids and their interaction with neighboring residues determine the fluorescent properties of GFP and its mutant forms. In our particular experiments we used a mutant named enhanced GFP (or EGFP), which contains two amino-acid substitutions at positions 64 and 65 (14). The chromophore in EGFP is permanently ionized and it is found in a hydrophobic region where it is well-protected by the β-structure from external solvents. The EGFP fluorescence is high in the folded state and is insignificant in the unfolded state (15). The high quantum yield at ambient temperature—60%—is related to the rigid attachment of the chromophore inside the barrel, which prevents nonradiative decay of the excited state (16). Nevertheless, the EGFP fluorescence at ambient temperature shows weak temperature dependence (16–18). In particular, upon increasing the temperature, the fluorescence intensity decreases and the spectrum is red-shifted. This is usually attributed to increased thermal motion of side chains (19). Therefore, the measurement of the red-shift provides a way to estimate the local temperature of the protein molecule.
In this work we study the effect of microwave irradiation on the intensity and spectrum of the EGFP fluorescence in solution. Since the EGFP fluorescence is a very sensitive monitor of its structure, changes under microwave irradiation can be detected in real-time.
PROTEIN PREPARATION
The enhanced form of the green fluorescent protein (EGFP) (BD Clontech, Mountain View, CA) was cloned into pDest17 vector (Invitrogen, Carlsbad, CA). The EGFP gene was cloned downstream to a 6×His affinity tag, so that the expressed protein contains six histidines at the N-terminal of the protein. The vector was expressed in Escherichia coli BL21 pLysS cells (Novagen, Merck Biosciences, Princeton, NJ), using standard induction condition procedures. This was done as follows: cells were grown to OD600 = 0.6 and induced with 0.4 mM isopropyl-d-thiogalactopyranoside. The cells were then grown at 37°C and harvested after 16 h. The cells pellet was dissolved in lysis buffer (50 mM Tris-HCl, pH 8.0, 0.3 M NaCl, 10 mM MgSO4, 10 mM imidazole, 10% glycerol, and 1 mM PMSF) and lysed using an M-110EHI microfluidizer processor (Microfluidics, Newton, MA). The protein was affinity-purified on nickel-NTA beads (Qiagen, Hilden, Germany) columns, using the AKTA Explorer FPLC (Amersham Pharmacia Biotech, Uppsala, Sweden). The protein was eluted in 50 mM Tris-HCl, pH 8.3, 0.3 M NaCl containing 250 mM imidazole, and dialyzed in 20 mM Tris-HCl, pH 8.0, and 50 mM NaCl at 4°C. The final concentration of the protein in solution was 0.84 mg/ml.
EXPERIMENTAL SETUP
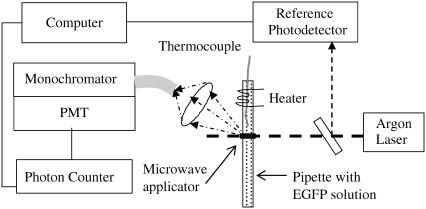
The EGFP fluorescence was excited by a 488-nm Argon laser (Fig. 1). The laser beam is directed across a transparent 2-mm diameter glass pipette with the buffer solution containing the EGFP. The fluorescence is picked up with a collecting lens mounted at 45° with respect to the laser beam. The optical fiber connects the lens to a monochromator, which is followed by a photomultiplier and a photon counter. The fluctuations in the incident laser intensity are monitored by a reference photodetector.
FIGURE 1.
Experimental setup. The 488-nm argon laser excites fluorescence in the glass pipette containing the EGFP in a buffer solution. The fluorescence is collected by the lens which is coupled to a monochromator via an optical fiber. The microwave applicator is mounted above the pipette (only the radiating aperture is shown) and locally irradiates the laser-illuminated volume of the solution. The resistive heater can heat the solution. The temperature is measured by the thermocouple inserted inside the solution in the close vicinity (within 0.5–1 mm) of the laser irradiated area.
To perform microwave irradiation we chose a localized microwave applicator. Its advantages over a conventional microwave cavity or microwave oven are: 1), the applicator and the sample are decoupled; 2), low and controllable microwave power can be used; and 3), only a small part of the sample can be irradiated. An additional advantage of our setup is that it is versatile and allows measurements at varying power/frequency in the continuous and pulse modes. For narrowband measurements we used a special 8.5 GHz probe based on a narrow rectangular aperture microfabricated on the convex surface of the sapphire dielectric resonator (20). For the broadband measurements we used an unmatched coaxial tip.
The microwave probe is brought to the distance of 100 μm above the glass pipette in such a way that the probe's apex aims directly on to the laser-illuminated region. The operating frequency of the probe is 8.53 GHz and the bandwidth in the presence of the sample is typically 0.3 GHz. Under proper matching the reflectivity of the probe is <−20 dB. The microwave energy is supplied from the HP-83623A synthesizer. In the absence of the sample, most of the input energy is dissipated in the probe while ≈10% of the input energy is radiated. At resonance, the microwave energy circulating in the probe is predominantly a reactive one. Since the probe is an open resonator, a considerable part of the reactive energy is concentrated in the near-field zone. When the sample is mounted there, it strongly absorbs the microwave energy. In comparison to an open waveguide, our probe allows for squeezing microwave radiation to the sub-wavelength size. Therefore, the irradiated volume is of submillimeter size. Since the wavelength of the 8.5 GHz microwave radiation in free space is 3.5 cm while the probe-sample distance is <0.25 mm, the irradiated region is entirely within the near-field zone of our probe where the microwave electric field may be considered as static.
It should be noted that the solution temperature slightly rises under microwave irradiation. The temperature rise in the irradiated spot is a sensitive indicator of the microwave energy reaching the solution. We found ΔT ≈ 3 K for the microwave frequency corresponding to the resonance, and ΔT < 0.1 K when the microwave frequency is out of resonance of the probe. This indicates that the heating arises from the microwave absorption in solution rather than from the heat transfer through the air gap between the microwave probe and the pipette with solution.
COMPUTER SIMULATIONS
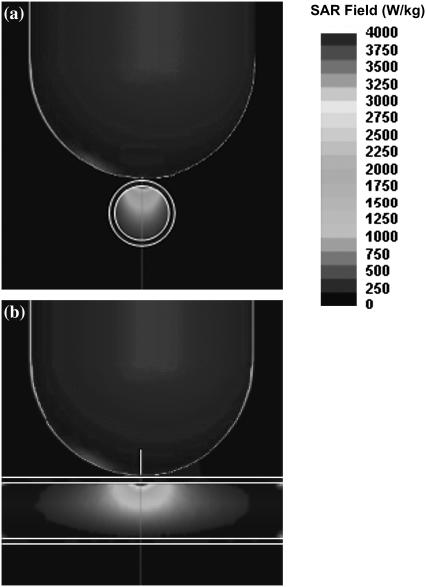
To demonstrate the spatial distribution of the microwave electric field in probe-sample assembly we performed computer simulations using the ANSOFT HFSS solver (Ansoft, Pittsburgh, PA). We considered a simplified representation of our applicator which does not include matching elements and the coax-to-waveguide adaptor (20). The numerical model assumes a dielectrically filled circular metallic waveguide with the radius of 4 mm terminated by the hemispherical metallized cap with a thin slot in the coating at the probe's apex (Fig. 2). The slot is 100-μm wide and 5.8-mm long, the dielectric is sapphire, the incident power is 250 mW, the resonance occurs at 10.2 GHz and the radiation efficiency of the probe is 10%. The microwave electric field in the incident wave is oriented perpendicular to the slot. The sample is a long glass pipette (the outer diameter is 2 mm; the wall thickness is 150 μm, ɛglass = 5.5 − j 0.16) filled with aqueous solution, ɛsolution = 65 − j 32. We present our results, as it is accepted in the biological context, using specific absorption rate (SAR) which is proportional to  . Fig. 2 shows our numerical results. We observe that the spatial distribution of the microwave field in solution is nonuniform and the maximum SAR is achieved just beneath the probe. For the 250-mW input power (the maximum power used in our experiments) the maximum SAR is 4000 W/kg.
FIGURE 2.
Numerical simulation of the SAR distribution in the probe-sample assembly at resonance frequency. (a) The hemispherical applicator with a slot aperture is mounted above the glass pipette with the aqueous solution. The cross-section of the glass pipette is shown by the white lines. The orientation of the microwave electric field is perpendicular to the slot. The size of the frame is 1 × 1 cm. (b) Side view. Note that the microwave energy penetrates a considerable part of the pipette cross-section and the highest SAR is achieved in the solution just beneath the probe.
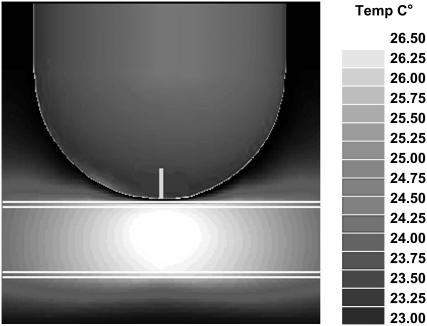
At the next step we used ANSOFT e-physics software package (Ansoft) to simulate the temperature distribution corresponding to the SAR pattern shown in Fig. 2. The ambient temperature is 23°C, the thermal conductivities of air, solution, and glass are, correspondingly, kair = 0.026 W/K-m, ksolution = 0.61 W/K-m, and kglass = 1.4 W/K-m. Since the overall temperature rise is small, we neglected air convection and heat radiation. To achieve the model of reasonable size and computation time we choose the boundary conditions for the thermal model as having a constant temperature of  This constant temperature is set at the faces of the sufficiently large parallelepiped enclosing the probe-sample assembly. In particular, the constant temperature is set at the periphery of the rectangle shown in Fig. 3. We found that the thermal time constant of the setup is 19 s. Fig. 3 shows the steady-state temperature distribution. The maximum temperature is achieved in the center of the pipette and just beneath the probe, as expected. The size of this hottest spot is 1.5–2 mm and the temperature rise there is ΔT = 3.5 K (at 250 mW input microwave power). Note that the heating of glass pipette is insignificant. This is consistent with our independent measurements (21,22).
FIGURE 3.
Numerical simulation of the temperature distribution in the probe-sample assembly based on the results of Fig. 2, front view. Note “hot” region with the size of 1.5–2 mm beneath the probe.
EXPERIMENTAL RESULTS
Temperature-dependent fluorescence of EGFP
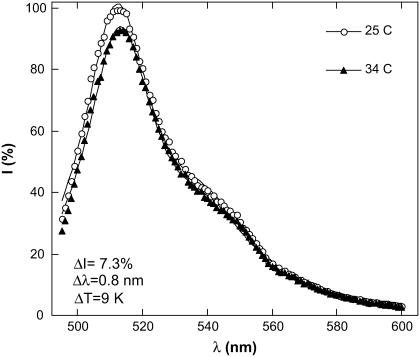
To observe the temperature dependence of the EGFP fluorescence upon conventional heating and in the absence of microwave irradiation we heated the sample using either a water heat bath or a thermal resistor (Fig. 1). The temperature was measured by the thermocouple inserted into the close vicinity of the laser beam. Fig. 4 shows our results, which were not corrected for the self-absorbance. (Our independent measurements indicate that the temperature dependence of absorbance at the excitation wavelength is very weak and does not exceed 0.1%/K in the temperature range 23–40°C.) The fluorescence spectrum under 488-nm excitation is well approximated by two Lorentzians centered at ∼510 nm and ∼540 nm. Upon increasing the temperature the fluorescence decreases and the spectrum becomes red-shifted.
FIGURE 4.
EGFP fluorescence spectrum under 488 nm excitation at different temperatures. Solid lines show an approximation of the spectrum by two Lorentzians centered at 510 nm and at 540 nm. A temperature rise from 25°C to 34°C results in the decrease in the peak intensity, ΔI = 7.3% and in a red-shift of Δλ = 0.8 nm. The intensity of the 510 nm peak at 25°C is adopted as 100%.
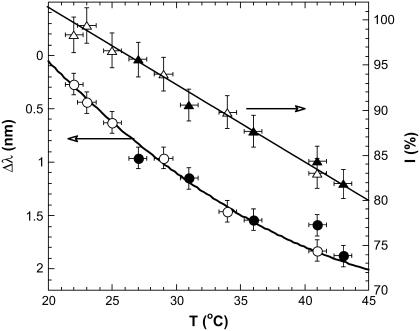
Fig. 5 displays the temperature dependence of the intensity and wavelength of the major fluorescence peak at 510 nm. The intensity almost linearly decreases upon increasing temperature with the slope 0.8–0.85%/K. Peak position monotonously decreases with temperature (red-shift) with the slope Δλ/ΔT ∼ 0.1 nm/K. The decrease of the fluorescence with increasing temperature and the red-shift of ∼0.1 nm/K are characteristic for the GFP (16,19). We obtained the same results in several subsequent heating/cooling cycles and did not observe irreversible changes. This is not surprising as the EGFP is a very stable protein with a high denaturation temperature of ∼80°C (23), while in the temperature range of interest (23–40°C), the irreversible changes in EGFP occur very slowly—at the timescale of several hours (19).
FIGURE 5.
Temperature dependence of the EGFP fluorescence. The triangles indicate I, the intensity of the strongest peak at 510 nm while the circles indicate the red-shift, Δλ. Solid symbols represent heating and open symbols represent cooling. The intensity of the 510 nm peak at 25°C is adopted as 100%.
Although the EGFP fluorescence may depend on the pH value of the buffer solution, this factor is insignificant in our experiments. Indeed, in a separate experiment we measured the pH-value of our buffer solution and found that it drops from 8.3 at 24°C to 7.9 at 40°C. Since in this range of pH-values, the EGFP fluorescence is almost constant (19,24,25), the drop of fluorescence with temperature shown in Figs. 4 and 5 cannot be attributed to the variation in the pH of the solution.
EGFP fluorescence under microwave irradiation
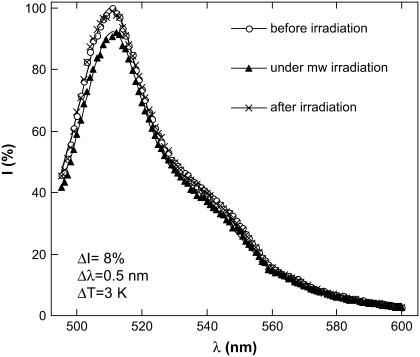
At the next step we applied microwave irradiation and measured the fluorescence and the solution temperature simultaneously. Under CW microwave exposure at fixed frequency the fluorescence intensity is diminished and the spectrum is red-shifted (Fig. 6). When the microwave is turned off the spectrum recovers to its initial shape showing that the process is reversible. Qualitatively, this is similar to conventional heating (Fig. 4). However, microwave exposure has a larger influence on the fluorescence as will be presented throughout this work. Indeed, although Figs. 4 and 6 look quite similar—in both cases ΔI ∼ 8%—the temperature rise in Fig. 6 is considerably lower than in Fig. 4 and the red-shift is also smaller.
FIGURE 6.
EGFP fluorescence spectrum under 488-nm excitation at ambient temperature. The fluorescence is shown without microwave irradiation (circles), under CW microwave exposure (triangles), and 2 min after microwave exposure (stars). The input microwave power is 250 mW, the frequency is 8.53 GHz. Solid lines show an approximation of the spectrum by two Lorentzians centered at 510 nm and at 540 nm. The microwave irradiation results in a decrease in the peak intensity, ΔI = 8% and in a red-shift of this peak, Δλ = 0.5 nm. The intensity of the 510 nm peak at 25°C is adopted as 100%.
What is the mechanism of the microwave-induced fluorescence change in EGFP? A considerable part of it arises from the heating of protein molecules through the thermal exchange with solution which strongly absorbs microwave energy. To quantify this trivial effect we measured the temperature of solution using a thermocouple. We found that under 250 mW input power at 8.53 GHz the temperature rise in the microwave-irradiated spot is ΔT ∼ 3 K. Basing on Fig. 5 we expect that this temperature rise would lead to a 3% decrease in the fluorescence intensity and to a red-shift of Δλ = 0.3 nm. However, we find from Fig. 6 that the fluorescence intensity decreases by >8% and the red-shift is Δλ = 0.5 nm.
Table 1 compares the changes of fluorescence under microwave irradiation and under conventional heating. Since under 250 mW microwave exposure the solution temperature rises by ΔT = 3 K, we chose the same value for conventional heating as well. We calculated the intensity and red-shift corresponding to this ΔT from the Fig. 5. Table 1 shows that ∼40% of the total fluorescence decrease under microwave irradiation can be attributed to conventional heating due to microwave absorption in solution, while the residual 60% represents the specific microwave effect. We conclude that the microwave effect on EGFP fluorescence is qualitatively similar to heating (intensity decreases, red-shift appears), although quantitatively it is different. The microwave field has a larger effect on EGFP fluorescence than the heating that accompanies microwave irradiation. This is a central conclusion of our study.
TABLE 1.
Comparison of the microwave and conventional heating effect on the EGFP fluorescence
| Temperature rise, ΔT (K) | Fluorescence decrease, ΔI (%) | Red-shift, Δλ (nm) | Ratio, ΔI/ΔT | |
|---|---|---|---|---|
| Conventional heating | 3 | 3 | 0.3 | 1 |
| Microwave heating (250 mW) | 3 | 8 | 0.5 | 2.6 |
The temperature rise under microwave irradiation
The above conclusion crucially depends on the reliability of the solution temperature measurement under microwave irradiation. In this section we present several ways of measuring temperature rise in solution and analyze their limitations.
Thermocouple location
A small displacement of the thermocouple from the center of the microwave-irradiated spot may lead to the error. To address this point we performed temperature measurements under microwave irradiation at different locations of the thermocouple and found that at the distance of 1 mm away from the radiating slot the temperature is almost the same as that in the irradiated spot. This is consistent with our computer simulations of the temperature distribution in the sample under microwave irradiation (Fig. 3) which shows that the maximum temperature is achieved in the 1.5 × 2 mm spot, hence the thermocouple may be displaced by 1 mm away from the laser beam.
Comparison of the microwave effect on EGFP and on the egg-white
Since the thermocouple is made of conducting wires, there is some possibility that it disturbs the microwave field in the sample. To estimate the temperature rise in solution under microwave irradiation and without using a thermocouple, we replaced the buffer solution with EGFP by the aqueous egg-white solution, which has very similar microwave and thermal properties. Since the egg-white irreversibly denaturates above 61°C it can be used as a temperature recorder, if in the process of heating the temperature elsewhere exceeds its denaturation point. We performed microwave irradiation in the geometry similar to Fig. 1 with the EGFP solution replaced by the egg-white and without laser beam. In this experiment our microwave applicator was fed using a Litton TWT power amplifier (Litton, Woodland Hills, CA). The ambient temperature is 23°C. When the input microwave power is below 5 W, the egg-white remains transparent even at prolonged exposure. When the input power exceeds 5 W, we observe a white opaque spot in the irradiated area. We conclude that the maximal temperature rise under Pin = 5 W is ΔT = 61–23 = 38 K. Since ΔT ∝ P (in the absence of phase transitions in the sample), we estimate that the maximum temperature rise under much smaller input power of Pin = 250 mW is only ΔT = 1.9 K. Table 2 compares this estimate to the results of computer simulations and direct measurements with the thermocouple. All three methods agree well.
TABLE 2.
Temperature rise in solution under 250 mW microwave irradiation using a local probe
| Temperature rise | Computer simulation | Egg-white heating | Liquid crystal indicator | Thermocouple |
|---|---|---|---|---|
| ΔT (K) | 3.5 | 1.9 | 1 < ΔT < 6 | 2.5–3 |
Estimate of the temperature rise under microwave irradiation using a liquid crystal indicator
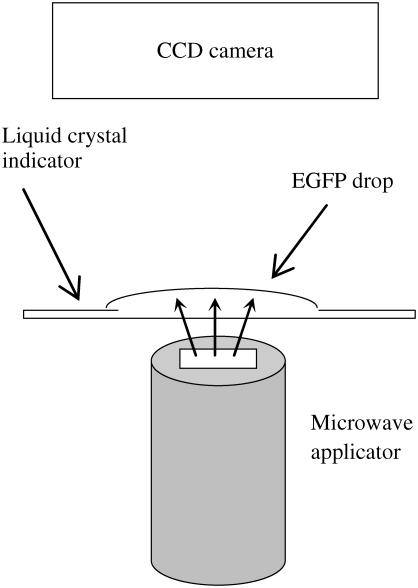
To further test our temperature measurements, we measured the temperature in the whole microwave-irradiated spot simultaneously using a liquid crystal indicator and a different setup (Fig. 7). Specifically, we took a thin sheet of commercial cholesteric liquid crystal indicator which changes its color when its temperature exceeds 25°C; we put a drop of the EGFP solution on it; and monitored the changes of color of the indicator under microwave irradiation. In such a way we can characterize the temperature distribution in the EGFP layer under localized microwave irradiation. This was also done without laser illumination.
FIGURE 7.
Schematic configuration of the setup for temperature mapping in the microwave-irradiated EGFP solution. The transparent EGFP droplet is placed on a cholesteric liquid crystal indicator. The microwave applicator is mounted from the backside of the indicator in such a way that its apex aims at the center of the drop. We observe the change of color of the liquid crystal indicator under microwave irradiation.
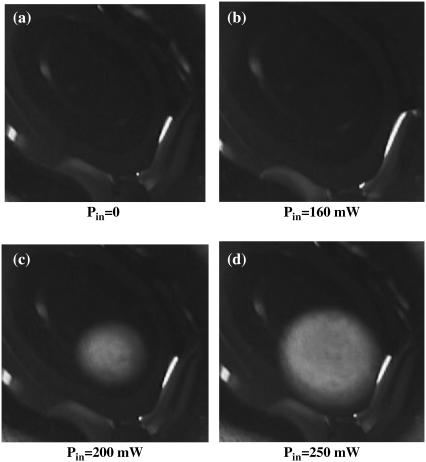
At first we verified that at an ambient temperature of 24°C and under 250 mW microwave irradiation, the color of the indicator without EGFP solution does not change. This means that the microwave absorption in the indicator itself is insignificant. We then placed a small transparent drop of EGFP solution (0.2 mm thickness, the radius of ∼1 cm) on this indicator and irradiated it from the backside using our microwave applicator. If the temperature elsewhere exceeds 25°C we should see there a bright spot. We observed the following: at small incident microwave power (160 mW) the indicator color does not change (Fig. 8 b). This means that the temperature rise does not exceed 1 K at any location. At higher incident power (200 mW) we observe a bright circular spot centered just above the applicator, as expected (Fig. 8 c). The rim of this spot indicates the region where the temperature is 25°C while the temperature inside the encircled area is higher. When we apply a higher incident power of 250 mW, the spot becomes wider (Fig. 8 d) indicating the temperature increase in the inner area of the spot. The maximal temperature is achieved in the center of the spot, namely, at the region closest to the applicators apex.
FIGURE 8.
Microwave irradiation of a transparent EGFP droplet placed on a liquid crystal temperature indicator with a temperature sensitivity of 25–30°C. The size of each frame is 2 × 2 cm2. Note the bright circular spot in the center of the image in panels c and d, indicating heating, and the absence of bright spot in panels a and b, indicating that the temperature rise everywhere in the drop is <1 K. The ambient temperature is 24°C.
At the next step we performed a similar experiment using a different liquid crystal indicator sensitive to temperature variation in the range 30–35°C. We did not observe any change in color even using our maximal microwave power of 250 mW. This means that the temperature in the EGFP drop at maximum incident microwave power nowhere exceeds 30°C. In other words, under 250 mW input power the temperature rise in the hottest spot is at least 1 K and is certainly <6 K (in fact it can be even lower, but the relatively low temperature resolution of the liquid crystal indicator does not allow to yield better estimate). This is consistent with other measurements (Table 2).
DEPENDENCE ON MICROWAVE POWER
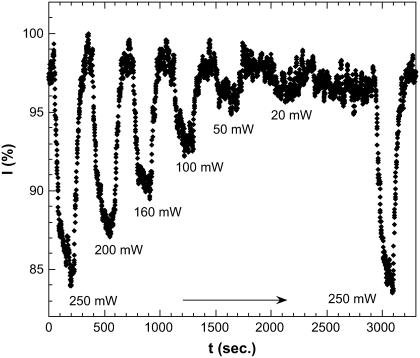
Having verified the microwave heating effects, we studied the microwave effect on the EGFP fluorescence in more details. We applied microwave irradiation at a selected input power and observed the corresponding fluorescence decay at fixed wavelength of 510 nm, which corresponds to the peak of the fluorescence spectrum (Fig. 4). Then we turned the microwave off and observed the corresponding recovery. This sequence was performed at different microwave power levels as shown in Fig. 9. The fluorescence decreases upon microwave irradiation and returns back to its original level after the irradiation is turned off, i.e., the process is reversible. The fall and rise time, taken at half-height of the fluorescence decay, is t1/2 = 22 s and does not depend on microwave power, whereas the steady-state fluorescence intensity linearly depends on microwave power. We also measured the corresponding change of temperature (not shown here) and found that the time constant for the temperature rise/drop occurred more or less on the same timescale, 22 s. This agrees well with the results of computer simulations (see text above), which yield 19 s. Incidentally, this timescale is close to the characteristic GFP folding/unfolding time under the action of chemical denaturants (26). It is also close to the characteristic time of photobleaching (27).
FIGURE 9.
Fluorescence decay/recovery upon switching on/off the microwave irradiation at 8.53 GHz. The fall and rise time, t1/2 ∼ 22 s, is independent of microwave power.
Fig. 9 also shows that the microwave effect is quite repeatable—we performed a series of experiments at varying microwave power from 250 mW to 20 mW and then returned back to the initial microwave power of 250 mW. The fluorescence decrease in the steady state in both runs with 250 mW irradiation is actually the same, 12 ± 1%. It should be noted, however, that in the long run the microwave effect on fluorescence decreases with time due to sample degradation. However, this occurs on the much longer timescale on the order of weeks.
In a different experiment we varied the incident microwave power in steps of 0.1 dBm (the dwell time is 2 s) and observed the corresponding changes in the fluorescence intensity at fixed wavelength λ = 510 nm. These measurements were done without thermocouple. If we disregard the results obtained at very small microwave power, we find that the fluorescence intensity linearly decreases with increasing microwave power and that this short-term dependence is almost reversible.
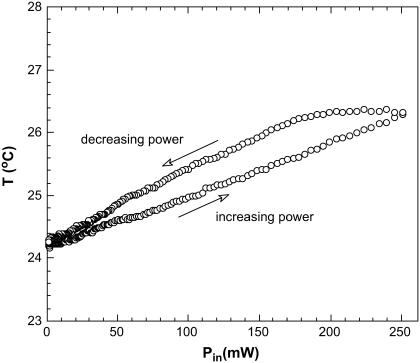
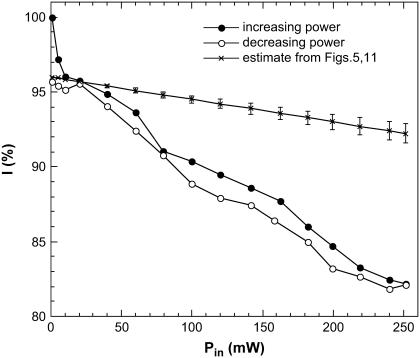
Immediately after this, and using the same measurement configuration, a thermocouple was inserted into the solution. We repeated the whole cycle and measured the temperature in the near vicinity of the microwave irradiated spot (Fig. 11). The temperature increases linearly with increasing microwave power and shows a small lag as the microwave power is decreased. Note that under maximum microwave power (250 mW) the temperature rise in the irradiated spot does not exceed 3 K. According to what we observe in Fig. 5, this could only produce a 3% decrease in fluorescence, although we did observe a much larger decrease at 12–14% (Fig. 10). This shows again that the microwave effect on fluorescence is not due to heating alone.
FIGURE 11.
Temperature rise (ΔT) of the EGFP solution under localized microwave irradiation as a function of incident microwave power. The temperature rise ΔT = 3 K is observed at maximal microwave power. If the microwave effect were only thermal this would correspond to only 3% decrease in fluorescence as compared to 12–14% shown in the Fig. 10.
FIGURE 10.
EGFP fluorescence decrease (ΔI) as a function of input microwave power. A 250-mW microwave exposure at 8.53 GHz results in a 12–14% decrease in fluorescence. Solid symbols show results for increasing microwave power, open symbols show results for decreasing power, crosses show our estimate for the fluorescence decrease due to increase in solution temperature under microwave irradiation. This estimate is based on the data illustrated in Figs. 5 and 11.
The difference between fluorescence changes arising directly from microwave irradiation and indirectly through microwave heating of the solution, can be seen in Fig. 10. Indeed, the solution temperature rise under microwave irradiation estimated from the Fig. 11 is linear in microwave power, ΔT/ΔP = 12–16 K/W. Fig. 5 shows that the intensity of the fluorescence peak decreases with temperature almost linearly, ΔI/ΔT = 0.8–0.85%/K. Due to the red-shift, the fluorescence decrease at fixed wavelength (510 nm) is stronger, ΔI510/ΔT = 1.08–1.13%/K. Therefore, the expected decrease of fluorescence at 510 nm, arising from microwave heating of solution, is ΔI/ΔP = 13–18%/W. The crosses in Fig. 10 show expected decrease in fluorescence arising from the heating of solution. It is clearly seen that the observed microwave effect (solid and open circles) is larger and statistically different from microwave heating alone.
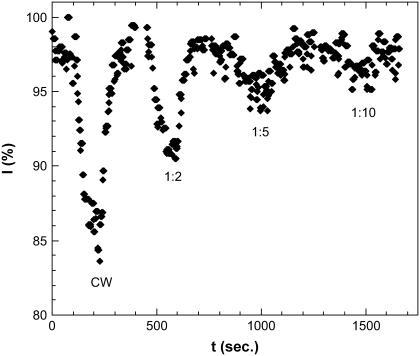
Following earlier works indicating the possible difference between the pulse and cw-microwave radiation (28), we studied the change of fluorescence under pulsed microwave irradiation. The pulse width is 1 μs, the pulse period varied from 2 to 10 μs. The microwave effect on the EGFP fluorescence decreases with increasing duty cycle (Fig. 12). We did not observe any unique effect related to the pulsed exposure as compared to the CW exposure, although at small pulsed microwave power, no effect on fluorescence has been detected.
FIGURE 12.
Fluorescence decay/recovery under 250 mW microwave irradiation in the pulse mode at various pulse duty cycles.
DEPENDENCE ON MICROWAVE FREQUENCY
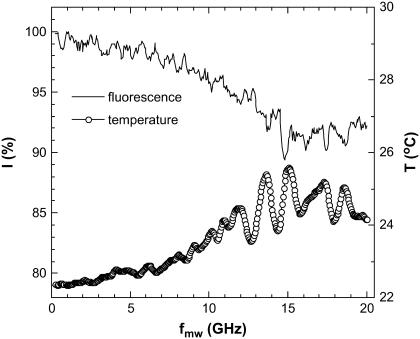
To explore the dependence on microwave frequency, we performed similar experiments using another near-field microwave applicator: a 6.5-mm long tip protruding from a semirigid coaxial cable. In comparison to our slot-based applicator, this one is less effective and unmatched, although it allows for broadband measurements. In what follows we report our initial studies with this unmatched antenna. We irradiated the sample using 250 mW incident power and varied the microwave frequency from 250 MHz to 20 GHz in steps of 50 MHz and a dwell-time of 10 s at each step. We observed the microwave effect on the temperature and on the fluorescence simultaneously (Fig. 13). Note that the dwell time at each frequency is small compared to characteristic fluorescence decay/recovery time (22 s); hence, our results show only a qualitative picture.
FIGURE 13.
Fluorescence and temperature variation under CW microwave irradiation using an unmatched coaxial antenna at Pin = 250 mW at different microwave frequencies. Oscillations with the 1.1 GHz period arise from the standing waves in the antenna-feeding cable assembly. The antenna heats the protein solution more effectively in the frequency range of 10–20 GHz where the water absorption is maximized.
Under microwave irradiation with this coaxial antenna the fluorescence decreases and the temperature of the EGFP solution rises (Fig. 13). Note that both dependences are qualitatively similar. The oscillations with 1.1 GHz period arise from the standing waves in the antenna-feeding cable assembly. The maximum microwave effect on fluorescence is observed at 10–20 GHz. This frequency range is determined by the efficiency of the antenna and by the frequency-dependent microwave absorption in the solution.
Fig. 13 yields that the ratio between the change in fluorescence and the temperature rise is ΔI/ΔT ∼ 2–3 (%/K). This is also similar to our results presented in Table 1 and indicates that the microwave effect does not depend on the applicator type. Again, this result should be compared to that of conventional heating, which amounts to ΔI/ΔT ∼ 1%/K. It seems that ΔI/ΔT is higher at lower microwave frequencies. The exact value of this ratio varies from sample to sample and decreases as the sample ages.
DISCUSSION
At the present time we do not have a clear understanding why microwave heating and conventional heating affect the EGFP fluorescence differently. In what follows we discuss several possible scenarios.
A recent overview by Hoz et al. (29) thoroughly discusses possible effects of microwave irradiation on organic molecules. The significant heating of biomolecules through the resonance excitation seems to be excluded. Indeed, although theoretical estimates indicate that there are mechanical resonances of long biomolecules in the gigahertz region (30), it has been shown that for the molecules in solution these vibrations are strongly damped (8).
Since the SAR of different molecules is not the same (31), one can conceive that there might be some temperature difference between the biomolecule and solvent. However, detailed calculations show that the thermal gradient across the biomolecule is insignificant. Indeed, the maximum steady-state temperature difference between the microwave absorbing sphere and the solution is (32)
 |
(1) |
where τ = a2/2α is the thermal response time of the sphere, a is the radius of the sphere, α is the thermal diffusivity of the sphere, q is the volumetric heating, ρ is the solution density, and cp is the specific heat of the solution. Assuming that the protein molecule is a sphere of a ∼ 1.2 nm (12), α = 1.43 × 10⁻⁷ m2/s, we find τ = 5 ps. In our experimental conditions q = 4 × 10⁷ W/m3, ρ = 1000 kg/m3, and cp = 4 × 10³ J/kg K. We find then ΔT = 5 × 10⁻¹¹ K. Clearly such a small temperature gradient cannot account for our results. If we take into account that the heat exchange of the EGFP chromophore with the surrounding media is closer to one-dimensional, then the time constant in Eq. 1 is longer than 5 ps. The fluorescence decay after short pulse excitation (33) yields that the relaxation time of the GFP molecule is <1 ns. We substitute τ = 1 ns into Eq. 1 and find ΔT = 10−8 K. This value is still very small to yield observable effects. Therefore significant thermal gradients at the molecular level are highly improbable in our experiments.
Since microwave irradiation is inhomogeneous and there is a thermal gradient (Fig. 3), we have to consider thermodiffusion. Indeed under inhomogeneous heating there is a thermal gradient which leads to the gradient of the EGFP concentration and to accompanying change in fluorescence. In the steady state,
 |
(2) |
where ST is the Soret coefficient. For low-viscosity solvent it can be found from the Einstein relation (D = kT/6πηa) as ST =1/T (34). Here, D is the diffusion coefficient, η is the solvent viscosity, and a is the radius of the EGFP molecule. Since we use the buffer solution with low concentration of glycerole (10%), its viscosity is small—η = 1.3 cP. Therefore, we substitute ΔT = 3 K and ST = 1/300 K−1 into Eq. 2 and find ΔI = 1%. This is only a small part of the observed fluorescence drop under microwave irradiation (Fig. 10).
Diffusion of fluorescing molecules should not affect our results. Indeed, the characteristic time for diffusion is l2/D, where l is the spatial scale of the experiment. Jena and Bloomfield (35) measured diffusion coefficient of EGFP in low viscosity solution and found DGFP ∼ 200 μm2/s. The spatial scale in our experiments is set by the overlap of the laser-irradiated region and the microwave-irradiated region (0.5 mm). The size of the hot-spot is on the order of 1 mm (Figs. 2 and 3). This yields the characteristic diffusion time tdiff ∼ 103 s, which considerably exceeds the characteristic time of our experiments (22 s).
The specific microwave effect that we observe here may be somehow related to microwave absorption by the water molecules attached to the EGFP barrel. Indeed, in the folded state, the EGFP contains several water molecules, which stretch from the chromophore to the barrel, as well as the layer of bound water attached to the outer surface of the barrel. The absorption band of the bound water lies at lower microwave frequencies, 1–15 GHz (36,37), as compared to the 19 GHz absorption band of pure water at room temperature. Since the frequency of our slot-based applicator is 8.53 GHz, we are closer to the absorption band of bound water than to the absorption of free water. Therefore, the bound water attached to the EGFP barrel is heated more efficiently as compared to the ambient solution. This selective heating of bound water may lead to minute conformational changes in the EGFP molecule which affect its fluorescence. The reverse effect—the change in microwave absorption of bound water under conformational changes in the biomolecule—has been reported recently (38). (Although Taylor and van der Weide (38) used the dielectric relaxation of bound water as a reporter of conformational changes in the biomolecule and did not find the effect of microwave power, it should be noted that the maximum input microwave power in their experiments—1.8 mW—is small compared to the input power of 250 mW used in our setup.)
Another candidate for the specific microwave effect in EGFP might be photochemistry, which is well documented for this compound (17,39). If there is intermediate polar state or charge transfer during photochemical reaction in EGFP, the microwave can affect it (29).
An alternative route for specific microwave effect on EGFP fluorescence in solution might be the orienting effect of the microwave electric field. Indeed under polarized excitation, the fluorescence anisotropy of the aqueous GFP solution is rather strong (12). This leads to the anisotropy of the fluorescence intensity. Microwave electric field can orient fluorescing molecules and thus it can affect the fluorescence intensity in a certain direction. Presently we are verifying this hypothesis.
CONCLUSIONS
We report on a specific microwave effect on the fluorescence of the EGFP molecules in solution, which is distinguishable from conventional heating. The effect of microwave exposure on the fluorescence is stronger than that expected from thermal physics considerations.
As this study is performed at microwave energies well above the standard exposure limits, it cannot be directly associated with health hazards pertinent to common mobile communication devices. However, our finding that the microwave effect is not identical to conventional heating points to enhanced localized effects that cannot be detected using conventional thermometry, and which should be taken into consideration, especially for biological media containing proteins with similar structure to EGFP.
Acknowledgments
We are grateful to Nathalie Balaban for the help with GFP handling, and to Tsafi Danieli and her group, Mario Lebendiker, and Benjamin Aroeti, for guiding us in EGFP preparation. We owe many thanks to Yuri Feldman, Noam Agmon, and Dan Huppert for many fruitful discussions and suggestions. We are grateful to Fadi Sakran, Oleg Popov, and Roy Ziblat for the help in experiments.
A.C. thanks the Israeli Ministry of Science and the Deutschen Forschungsgemeinschaft for the support. We are grateful to the Forschungsgemeinschaft Funk for giving us the possibility of presenting our results in the COST-281 meeting in Stuttgart. We are grateful to the participants of this meeting for the interest in our work and for the constructive critical remarks and suggestions.
References
- 1.Bohr, H., and J. Bohr. 2000. Microwave-enhanced folding and denaturation of globular proteins. Phys. Rev. E. 61:4310–4314. [DOI] [PubMed] [Google Scholar]
- 2.de Pomerai, D., C. Daniells, H. David, J. Allan, I. Duce, M. Mutwakil, D. Thomas, P. Sewell, J. Tattersall, D. Jones, and P. Candido. 2000. Non-thermal heat-shock response to microwaves. Nature. 405:417–418. [DOI] [PubMed] [Google Scholar]
- 3.Dawe, A. S., B. Smith, D. W. P. Thomas, S. Greedy, N. Vasic, A. Gregory, B. Loader, and D. I. de Pomerai. 2006. A small temperature rise may contribute towards the apparent induction by microwaves of heat-shock gene expression in the nematode Caenorhabditis elegans. Bioelectromagnetics. 27:88–97. [DOI] [PubMed] [Google Scholar]
- 4.Porcelli, M., G. Cacciapuoti, S. Fusco, R. Massa, G. d'Ambrosio, C. Bertoldo, M. DeRosa, and V. Zappia. 1997. Non-thermal effects of microwaves on proteins: thermophilic enzymes as model system. FEBS Lett. 402:102–106. [DOI] [PubMed] [Google Scholar]
- 5.Mancinelli, F., M. Caraglia, A. Abbruzzese, G. d'Ambrosio, R. Massa, and E. Bismuto. 2004. Non-thermal effects of electromagnetic fields at mobile phone frequency on the refolding of an intracellular protein: myoglobin. J. Cell. Biochem. 93:188–196. [DOI] [PubMed] [Google Scholar]
- 6.Hamad-Schifferli, K., J. J. Schwartz, A. T. Santos, S. G. Zhang, and J. M. Jacobson. 2002. Remote electronic control of DNA hybridization through inductive coupling to an attached metal nanocrystal antenna. Nature. 415:152–155. [DOI] [PubMed] [Google Scholar]
- 7.Weissenborn, R., K. Diederichs, W. Welte, G. Maret, and T. Gisler. 2005. Non-thermal microwave effects on protein dynamics? An x-ray diffraction study on tetragonal lysozyme crystals. Acta Crystallogr. D Biol. Crystallogr. 61:163–172. [DOI] [PubMed] [Google Scholar]
- 8.Adair, R. K. 2002. Vibrational resonances in biological systems at microwave frequencies. Biophys. J. 82:1147–1152. [DOI] [PMC free article] [PubMed] [Google Scholar]
- 9.Foster, K. R. 2000. Thermal and nonthermal mechanisms of interaction of radio frequency energy with biological systems. IEEE Trans. Plasma Sci. 28:15–23. [Google Scholar]
- 10.Adair, R. K. 2003. Biophysical limits on athermal effects of RF and microwave radiation. Bioelectromagnetics. 24:39–48. [DOI] [PubMed] [Google Scholar]
- 11.Gellermann, J., W. Wlodarczyk, B. Hildebrandt, H. Ganter, A. Nicolau, B. Rau, W. Tilly, H. Fahling, J. Nadobny, R. Felix, and P. Wust. 2005. Noninvasive magnetic resonance thermography of recurrent rectal carcinoma in a 1.5 Tesla hybrid system. Cancer Res. 65:5872–5880. [DOI] [PubMed] [Google Scholar]
- 12.Zimmer, M. 2002. Green fluorescent protein (GFP): applications, structure, and related photophysical behavior. Chem. Rev. 102:759–781. [DOI] [PubMed] [Google Scholar]
- 13.Heim, R., D. C. Prasher, and R. Y. Tsein. 1994. Wavelength mutations and posttranslational auto-oxidation of green fluorescent protein. Proc. Natl. Acad. Sci. USA. 91:12501–12504. [DOI] [PMC free article] [PubMed] [Google Scholar]
- 14.Guohong, Z., G. Vanessa, and S. R. Kain. 1996. An enhanced green fluorescent protein allows sensitive detection of gene transfer in mammalian cells. Biochem. Biophys. Res. Commun. 227:707–711. [DOI] [PubMed] [Google Scholar]
- 15.Cormack, B. P., R. H. Valdivia, and S. Falkow. 1996. FACS-optimized mutants of the green fluorescent protein (GFP). Gene. 173:33–38. [DOI] [PubMed] [Google Scholar]
- 16.McAnaney, T. B., X. Shi, P. Abbyad, H. Jung, S. J. Remington, and S. G. Boxer. 2005. Green fluorescent protein variants as ratiometric dual emission pH sensors. 3. Temperature dependence of proton transfer. Biochemistry. 44:8701–8711. [DOI] [PubMed] [Google Scholar]
- 17.Litvinenko, K. L., N. M. Webber, and S. R. Meech. 2003. Internal conversion in the chromophore of the green fluorescent protein: temperature dependence and isoviscosity analysis. J. Phys. Chem. A. 107:2616–2623. [Google Scholar]
- 18.Leiderman, P., D. Huppert, and N. Agmon. 2006. Transition in the temperature dependence of GFP fluorescence: from proton wires to proton exit. Biophys. J. 90:1009–1018. [DOI] [PMC free article] [PubMed] [Google Scholar]
- 19.Verkusha, V. V., I. M. Kuznetsova, O. V. Stepanenko, A. G. Zaraisky, M. M. Shavlovsky, K. K. Turoverov, and V. N. Uversky. 2003. High stability of discosoma DsRed as compared to Aequorea EGFP. Biochemistry. 42:7879–7884. [DOI] [PubMed] [Google Scholar]
- 20.Abu-Teir, M., M. Golosovsky, D. Davidov, A. Frenkel, and H. Goldberger. 2001. Near-field scanning microwave probe based on a dielectric resonator. Rev. Sci. Instrum. 72:2073–2079. [Google Scholar]
- 21.Copty, A., F. Sakran, M. Golosovsky, D. Davidov, and A. Frenkel. 2004. Low-power near-field microwave applicator for localized heating of soft matter. Appl. Phys. Lett. 84:5109–5111. [Google Scholar]
- 22.Copty, A., M. Golosovsky, D. Davidov, and A. Frenkel. 2004. Localized heating of biological media using a 1-W microwave near-field probe. IEEE. Trans. Microw. Theory. Tech. 52:1957–1963. [Google Scholar]
- 23.Bokman, S. H., and W. W. Ward. 1981. Renaturation of Aequorea green-fluorescent protein. Biochem. Biophys. Res. Commun. 101:1372–1380. [DOI] [PubMed] [Google Scholar]
- 24.Haupts, U., S. Maiti, P. Schwille, and W. W. Webb. 1998. Dynamics of fluorescence fluctuations in green fluorescent protein observed by fluorescence correlation spectroscopy. Proc. Natl. Acad. Sci. USA. 95:13573–13578. [DOI] [PMC free article] [PubMed] [Google Scholar]
- 25.Elsliger, M. A., R. M. Wachter, G. T. Hansen, K. Kallio, and S. J. Remington. 1999. Structural and spectral response of green fluorescent protein variants to changes in pH. Biochemistry. 38:5296–5301. [DOI] [PubMed] [Google Scholar]
- 26.Makino, Y., K. Amada, H. Taguchi, and M. Yoshida. 1997. Chaperonin-mediated folding of green fluorescent protein. J. Biochem. (Tokyo). 272:12468–12474. [DOI] [PubMed] [Google Scholar]
- 27.Pucadyil, T. J., and A. Chattopadhyay. 2006. Confocal fluorescence recovery after photobleaching of green fluorescent protein in solution. J. Fluoresc. 16:87–94. [DOI] [PubMed] [Google Scholar]
- 28.Laurence, J. A., P. W. French, R. A. Lindner, and D. R. McKenzie. 2000. Biological effects of electromagnetic fields—mechanisms for the pulsed microwave radiation on protein conformation. J. Theor. Biol. 206:291–298. [DOI] [PubMed] [Google Scholar]
- 29.de la Hoz, A., A. Diaz-Ortiz, and A. Moreno. 2005. Microwaves in organic synthesis. Thermal and non-thermal microwave effects. Chem. Soc. Rev. 34:164–178. [DOI] [PubMed] [Google Scholar]
- 30.Prohofsky, E. W. 2004. RF absorption involving biological macromolecules. Bioelectromagnetics. 25:441–451. [DOI] [PubMed] [Google Scholar]
- 31.Vanderstraeten, J., and A. V. Vorst. 2004. Theoretical evaluation of dielectric absorption of microwave energy at the scale of nucleic acids. Bioelectromagnetics. 25:380–389. [DOI] [PubMed] [Google Scholar]
- 32.Laurence, J. A., D. R. McKenzie, and K. R. Foster. 2003. Application of the heat equation to the calculation of temperature rises from pulsed microwave exposure. J. Theor. Biol. 222:403–405. [DOI] [PubMed] [Google Scholar]
- 33.Huppert, D., P. Leiderman, M. Ben-Ziv, L. Genosar, and L. Cohen. 2005. Excitation wavelength dependence of the proton-transfer reaction of the green fluorescent protein. J. Phys. Chem. B. 109:4241–4251. [DOI] [PubMed] [Google Scholar]
- 34.Fayolle, S., T. Bickel, S. Le Boiteux, and A. Wurger. 2005. Thermodiffusion of charged micelles. Phys. Rev. Lett. 95: 20831. [DOI] [PubMed] [Google Scholar]
- 35.Jena, S. S., and V. A. Bloomfield. 2005. Probe diffusion in concentrated polyelectrolyte solutions: effect of background interactions on competition between electrostatic and viscous forces. Macromolecules. 38:10551–10556. [Google Scholar]
- 36.Dawkins, A. W. J., N. R. V. Nightingale, G. P. South, R. J. Sheppard, and E. H. Grant. 1979. The role of water in microwave absorption by biological material with particular reference to microwave hazards. Phys. Med. Biol. 24:1168–1176. [DOI] [PubMed] [Google Scholar]
- 37.Feldman, Y., I. Ermolina, and Y. Hayashi. 2003. Time domain dielectric spectroscopy study of biological systems. IEEE Trans. Dielectr. Electr. Insul. 10:728–753. [Google Scholar]
- 38.Taylor, K. M., and D. W. van der Weide. 2005. Ultra-sensitive detection of protein thermal unfolding and refolding using near-zone microwaves. IEEE Trans. Microw. Theory Tech. 53:1576–1586. [Google Scholar]
- 39.Garcia-Parajo, M. F., J. A. Veerman, L. Kuipers, and N. F. van Hulst. 2001. Looking at the photodynamics of individual fluorescent molecules and proteins. Pure Appl. Chem. 73:431–434. [Google Scholar]


