

Abstract
Heterogeneous nuclear ribonucleoprotein (hnRNP) A2 is a trans-acting RNA-binding protein that mediates trafficking of RNAs containing the cis-acting A2 response element (A2RE). Previous work has shown that A2RE RNAs are transported to myelin in oligodendrocytes and to dendrites in neurons. hnRNP E1 is an RNA-binding protein that regulates translation of specific mRNAs. Here, we show by yeast two-hybrid analysis, in vivo and in vitro coimmunoprecipitation, in vitro cross-linking, and fluorescence correlation spectroscopy that hnRNP E1 binds to hnRNP A2 and is recruited to A2RE RNA in an hnRNP A2-dependent manner. hnRNP E1 is colocalized with hnRNP A2 and A2RE mRNA in granules in dendrites of oligodendrocytes. Overexpression of hnRNP E1 or microinjection of exogenous hnRNP E1 in neural cells inhibits translation of A2RE mRNA, but not of non-A2RE RNA. Excess hnRNP E1 added to an in vitro translation system reduces translation efficiency of A2RE mRNA, but not of nonA2RE RNA, in an hnRNP A2-dependent manner. These results are consistent with a model where hnRNP E1 recruited to A2RE RNA granules by binding to hnRNP A2 inhibits translation of A2RE RNA during granule transport.
INTRODUCTION
Intracellular trafficking of RNA molecules provides a mechanism to maximize expression of the encoded proteins in specific subcellular compartments and minimize ectopic expression in the cell. This implies that translation is inhibited during RNA transport and activated once the RNA reaches its destination, a mechanism referred to as localization-dependent translation. Several proteins involved in suppression of translation during RNA transport have been identified in Drosophila (Gavis and Lehmann, 1994; Kim-Ha et al., 1995; Rongo et al., 1995; Dahanukar and Wharton, 1996; Smibert et al., 1996, 1999; Dahanukar and Walker, 1999), and in mammalian cells (Hüttelmaier et al., 2005). However, the molecular mechanism of translation regulation during RNA trafficking has not been determined.
We have characterized a specific RNA-trafficking pathway mediated by the trans-acting trafficking factor heterogeneous nuclear ribonucleoprotein (hnRNP) A2 that binds to a characteristic 11 nucleotide (nt) cis-acting trafficking element (GCCAAGGAGCC), termed the A2 response element (A2RE), found in a variety of transported RNAs. Molecules of A2RE RNA and hnRNP A2 protein assemble into large ribonucleoprotein complexes, termed RNA granules, containing cognate RNA-binding proteins, components of the translational machinery, and molecular motors. RNA granules are transported along microtubules to distal dendrites where the RNA is localized and translation is activated (Ainger et al., 1993, 1997; Barbarese et al., 1995; Carson et al., 1997; Hoek et al., 1998; Mouland et al., 2001). The A2RE sequence was initially identified in myelin basic protein (MBP) mRNA (Ainger et al., 1993, 1997), which is preferentially localized to dendrites and myelin in oligodendrocytes (Colman et al., 1982; Zeller et al., 1985; Verity and Campagnoni, 1988; Gillespie et al., 1990). Immunostaining of mature oligodendrocytes reveals that MBP expression is higher in the myelin compartment and lower in the perikaryon (Sternberger et al., 1978; Hartman et al., 1979; Roussel and Nussbaum, 1981; Hardy et al., 1996), implying that translation of MBP RNA is suppressed during transport and activated only when the granules reach the myelin compartment (Barbarese et al., 1995).
Translation of specific mRNAs can be regulated by trans-acting RNA binding proteins that bind to cis-acting sequences in the RNAs. During erythrocyte differentiation, translation of lipoxygenase mRNA is inhibited by hnRNP E1 and hnRNP K, which bind to the RNA through a repetitive cis-acting element, termed the differentiation control element (DICE) (Ostareck et al., 1997; Reimann et al., 2002). When hnRNP E1 and K bind to the DICE sequence, recruitment of the 60S ribosomal subunit is blocked, thereby inhibiting translation. In the final stages of reticulocyte differentiation, suppression of translation of lipoxygenase mRNA is relieved when hnRNP E1 and hnRNP K dissociate from the RNA (Ostareck et al., 2001). Either hnRNP E1 or hnRNP K is sufficient to inhibit translation of DICE-containing RNA in vitro. Binding of hnRNP E1 to folate receptor, renin, and collagen I mRNAs has the opposite effect, leading to stabilization and/or enhanced translation of the bound mRNAs (Xiao et al., 2001; Persson et al., 2003; Thiele et al., 2004).
Here, we have used a combination of in vitro and in vivo approaches to analyze hnRNP E1–hnRNP A2 interactions and their roles in A2RE mRNA trafficking in neural cells.
MATERIALS AND METHODS
Yeast Two-Hybrid Analysis
Yeast two-hybrid identification of binding partners for hnRNP A2 was performed as described previously (Kosturko et al., 2005). Full-length mouse cDNA encoding hnRNP A2 was used as bait to screen the Matchmaker Pretransformed human brain cDNA library from a 37-year-old male (BD Biosciences, Franklin Lakes, NJ). Clones were screened as described in Kosturko et al., (2005) and maintained as Escherichia coli transformants and also as pure DNA. DNA sequencing was performed by the University of Connecticut Health Center Molecular Core Facility (Farmington, CT) or commercially (Acgt, Wheeling, IL). The 5′-terminal sequences were used to identify genes by a BLAST search of GenBank. Clones of interest were sequenced to their 3′ ends.
Coimmunoprecipitation of hnRNP E1 and hnRNP A2 Proteins
hnRNP E1 and hnRNP A2 proteins were synthesized by in vitro transcription-translation using a rabbit reticulocyte lysate (RRL) and [35S]methionine (Amersham Redivue in vitro translation grade; GE Healthcare, Little Chalfont, Buckinghamshire, United Kingdom). The hnRNP E1 clone identified by yeast two-hybrid analysis was copied by successive rounds of PCR to insert a T7 promoter upstream of the hemagglutinin (HA) epitope. Coimmunoprecipitation of in vitro-synthesized proteins was performed as described previously (Kosturko et al., 2005). Immunoprecipitates were analyzed by SDS-PAGE and autoradiography.
To immunoprecipitate endogenous hnRNP E1 and hnRNP A2 complexes formed in vivo, the solubilized pellet of oligodendrocytes was incubated for 1 h with rabbit anti-hnRNP E1 antibodies (Gamarnik and Andino, 1997) or with normal rabbit serum bound to agarose beads conjugated with protein A. The agarose beads/immune complexes were spun down and washed. The antigen–antibody complexes were dissociated, separated by SDS-PAGE, and transferred to membrane for Western blot analysis using mouse anti-hnRNP A2 antibodies.
To immunoprecipitate hnRNP E1 and hnRNP A2 complexes formed in RRL, the cleared RRL containing various combinations of proteins and RNA was incubated for 1 h with mouse anti-hnRNP A2 bound to protein A-conjugated agarose beads. The agarose beads/immune complexes were spun down and washed. The antigen–antibody complexes were dissociated, separated by SDS-PAGE, and transferred to membrane for Western blot analysis using rabbit anti-E1 antibodies.
Recombinant hnRNP A2 and hnRNP E1
Full-length mouse cDNA for hnRNP A2 (residues 1-341) (Brumwell et al., 2002) and N-terminal (1-189) and C terminal (189-341) subfragments of hnRNP A2, full-length human hnRNP E1 (1-356) cDNA (obtained from Dr. Mathias Hentze, European Molecular Biology Laboratory, Heidelberg, Germany), and N-terminal (1-173) and C-terminal (173-356) hnRNP E1 subfragments were amplified and cloned into the pET100/D-TOPO vector downstream of the hexahistidine-tag (Invitrogen, Carlsbad, CA). These constructs were used to transform E. coli BL21(DE3) cells grown to an A600 of 0.6 before induction with 1 mM isopropyl-1-thio-β-d-galactopyranoside. Bacteria were lysed using a French press. Lysates were centrifuged at 12,000× g for 20 min at 4°C, and supernatants were applied to a metal affinity column (Talon; BD Biosciences, San Jose, CA) equilibrated with 50 mM NaH2PO4, 400 mM NaCl, and 5 mM imidazole. Proteins were eluted from the resin by increasing the column buffer imidazole concentration to 125 mM. Purified proteins were concentrated and washed with phosphate-buffered saline (PBS) on Amicon Ultra 10,000 MWCO (Millipore, Billerica, MA), centrifugal filter devices to a final concentration of 1 mg/ml in PBS. For the C-terminal fragment of hnRNP A2, it was necessary to denature the protein in 6 M guanidinium hydrochloride before purification. The purified protein was renatured by dialysis in phosphate buffer. Purity and identity of all proteins was assessed by SDS-PAGE and by Western blot.
Sulfo-SBED Cross-linking and Biotin Transfer
Recombinant hnRNP A2 was conjugated to Sulfo-SBED using the ProFound Sulfo-SBED biotin label transfer reagent and kit from Pierce Chemical (Rockford, IL). Sulfo-SBED was dissolved in 10 μg/μl dimethyl sulfoxide, and 1 μl was added to 100 μl of hnRNP A2 stock solution (25 μM protein in PBS). The reaction was allowed to proceed in the dark for 30 min at room temperature. Residual unreacted cross-linker was removed by dialysis in 50 mM HEPES, 150 mM NaCl, pH 7.3. Conjugated hnRNP A2 (final concentration 5 μM) was mixed without any addition, or with full-length recombinant hnRNP E1 or bovine serum albumin (BSA) (Sigma-Aldrich, St. Louis, MO) (final concentration 15 μM) in a final volume of 20 μl for 1 h at room temperature in the dark. Cross-linking was initiated by exposure to a 302-nm 100-W UV lamp held 5 cm from the solutions for 5 min. Cross-linked samples were reduced by adding dithiothreitol to a final concentration of 100 mM and boiling for 5 min, which dissociates the biotin label from hnRNP A2 and leaves it attached to the cross-linked protein. Biotin-labeled proteins were separated by SDS-PAGE and either stained with Coomassie blue or blotted onto polyvinylidene difluoride (PVDF) membrane, probed with 20 ng/ml streptavidin-horseradish peroxidase for 90 min at room temperature, and developed by enhanced chemiluminescence (Pierce Chemical) to identify biotin-conjugated proteins.
Cell Culture
Primary glial cultures were prepared from the brains of postnatal day 1–3 rats. Oligodendrocytes were isolated from mixed glial cultures by the method of McCarthy and de Vellis (1980). B104 neuroblastoma cells (Schubert et al., 1974) were grown in DMEM/F-12 containing 5% fetal calf serum. Procedures for animal use were approved by the Animal Care Committee of the University of Connecticut Health Center and followed federal guidelines for research with animals.
Microinjection, Immunofluorescence, and Image Acquisition and Analysis
Microinjection of cells plated on glass-bottomed dishes (MatTek, Ashland, MA) was performed using an electronic microinjection system (Eppendorf, Hamburg, Germany). Alexa Fluor 488-conjugated UTP-labeled RNA was injected into the cytoplasmic compartment. Injected cells were examined by confocal laser scanning microscopy after fixation with 3.7% formaldehyde and immunostaining with antibodies to hnRNP E1/E2.
Cells were treated for cytoskeleton (CSK) extraction using the method of Biegel and Pachter (1991), with minor modifications (Kosturko et al., 2005). Treated cells were fixed with formaldehyde, permeabilized with detergent, incubated with a blocking reagent and successively with primary and secondary antibodies. Mouse monoclonal antibody to hnRNP A2 (EF67) (used at 1:400 dilution) was a generous gift from Dr. William Rigby (Dartmouth Medical School, Lebanon, NH) (Nichols et al., 2000). Rabbit antibodies to hnRNP E1/E2 used at 1:50 (Xiao et al., 2001) and 1:200 (Gamarnik and Andino, 1997) were generous gifts from Dr. Asok Antony (Indiana University, Bloomington, IN) and Dr. Raul Andino (University of California, San Francisco, San Francisco, CA), respectively. Both antibodies cross-react with both hnRNP E1 and hnRNP E2 because the proteins share 90% sequence homology (Leffers et al., 1995). Fluorescein-conjugated and rhodamine-conjugated secondary antibodies were purchased from Jackson ImmunoResearch Laboratories (West Grove, PA).
Dual channel confocal images were collected using a Zeiss LSM 510 confocal laser scanning microscope with a 63 × 1.4 numerical aperture (N.A.) oil immersion objective (Carl Zeiss, Thornwood, NY) by simultaneous recording in the 488- and 568-nm channels. Fluorescence intensity of granules was quantified using a specialized single granule ratiometric macro for the NIH Image 1.6 program (http://rsb.info.nih.gov/nih-image/). The mean and SD for the population of selected granules were calculated, and a paired t test was performed.
In Vitro Transcription
For localization studies, fluorescent RNA was prepared from template DNA (RTS11) consisting of the coding region of green fluorescent protein (GFP) with the 11-nucleotide A2RE sequence from MBP mRNA (previously called RTS; Ainger et al., 1997) inserted into the 3′ untranslated region (UTR).
For in vitro and in vivo translation studies, capped and polyadenylated RNA was prepared from template DNA (RTS11) with or without the A2RE sequence or the A2RE mutated sequence (A8G) inserted into the 3′ UTR. In vitro transcription and capping were performed according to the manufacturer’s instructions (Ambion, Austin, TX). Transcripts were run on gels to evaluate size and concentration before their use.
In Vivo Translation and RNA Stability Assays
In the first protocol, B104 cells were microinjected with cDNA containing the cytomegalovirus promoter and hnRNP E1 coding sequence to achieve hnRNP E1 overexpression and with capped and polyadenylated GFP RNA containing the A2RE element in its 3′ UTR (GFP-A2RE), or capped and polyadenylated GFP RNA with a mutated A2RE element, A8G, in its 3′ UTR (GFP-A8G). The hnRNP E1 plasmid (pSG5-hnRNP E1) (Ostareck et al., 1997) was obtained from Dr. Mathias Hentze. Control B104 cells were also injected with GFP-A2RE RNA or GFP-A8G RNA. Alexa Fluor 546-conjugated dextran (Invitrogen) was coinjected to identify injected cells and to quantify the volume/relative amount of mRNA injected into each cell as described previously (Kwon et al., 1999). In all cases, the RNA concentration in the injection mix was ∼100 ng/μl.
In the second protocol, B104 cells were injected with capped and polyadenylated GFP-A2RE or GFP-A8G RNA with or without recombinant hnRNP E1 protein or BSA, and with Alexa Fluor 546-conjugated dextran. GFP-A2RE RNA and GFP-A8G RNA concentrations in the injection mix were 100 and 110 ng/μl, respectively. BSA and hnRNP E1 concentrations in the injection mix were 0.1 and 0.075 μg/μl, respectively.
In both protocols, fluorescence intensities of dextran and of GFP synthesized over a 6-h time period after injection of the RNA were monitored by dual channel confocal microscopy and quantified using Adobe Photoshop (Adobe Systems, Mountain View, CA). For quantification of fluorescence intensities, a square frame of fixed dimensions was positioned over the area of the cell body, exclusive of the nucleus, to obtain two independent, nonoverlapping samples of fluorescence intensity for each cell. The mean intensity of pixels within the frame was calculated for each channel. Similarly, the frame was positioned over nonoverlapping areas outside the cell to obtain two independent measurements of background fluorescence intensity for each cell. The average value of background intensity was subtracted from the average value of cytoplasmic intensity for the green channel. The amount of GFP accumulated in each cell, expressed as 488-nm fluorescence intensity units, was plotted as a function of the amount of dextran (as a measure of injected volume of RNA) into that cell, expressed in 546-nm fluorescence intensity units.
To analyze stability of the injected RNA, a nuclear/cytoplasmic partition assay, based on the observations of Nikolov and Dabeva (1985), was used. B104 cells were injected with fluorescent cyanine (Cy)-5-UTP–labeled GFP-A2RE RNA with or without recombinant hnRNP E1 protein or RNAse A. GFP-A2RE RNA concentration in the injection mixes was 50 ng/μl and that of hnRNP E1 and RNAse A, 0.06 μg/μl and 0.2 μg/μl, respectively. The nuclear and cytoplasmic distribution of fluorescent components corresponding to labeled nucleotides and intact RNA, respectively, was monitored by fluorescence confocal microscopy over a period of 6 h.
In Vitro Translation Assay
Capped and polyadenylated RNAs encoding GFP containing either A2RE or A8G sequences were prepared as described above. RNA (150 ng/reaction) was translated using the Flexi RRL (#L4540) and Transcend tRNA (#L5061) from Promega (Madison, WI) according to the manufacturer’s instructions. In some experiments, the translation mixture also contained luciferase mRNA (250 ng/reaction) provided with the kit as an internal control. In some cases, recombinant hnRNP A2 or recombinant hnRNP E1 was added to the reaction mixture. The reaction mixture was analyzed by Western blotting using anti-biotin antibody and horseradish peroxidase-conjugated secondary antibody. The intensities of the biotin-labeled GFP band and biotin-labeled luciferase bands were measured using Adobe Photoshop software.
Fluorescence Correlation Spectroscopy (FCS)
Full-length recombinant hnRNP A2 (1-341) and N (1-189) and C (189-341) subfragments of hnRNP A2 were conjugated with Alexa Fluor 488 tetrafluorophenyl ester (Invitrogen), which has an excitation maximum at 495 nm and emission maximum at 519 nm. Full-length recombinant hnRNP E1 (1-356) and N (1-173) and C (173-356) subfragments of hnRNP E1 were conjugated with the megastokes dye DY-520XL succinimidyl ester (Dyomics, Jena, Germany), which has an excitation maximum at 520 nm and emission maximum at 664 nm. Free dye was removed by passing the conjugated proteins over a P6 gel filtration column (Bio-Rad, Hercules, CA). The number of conjugated fluorophores per molecule was two to three in each case.
Interactions between pairwise combinations of differentially labeled components were analyzed by cross-correlation FCS (Schwille et al., 1997) using the Zeiss Confocor II system (Carl Zeiss, Jena, Germany) on an inverted microscope with a Zeiss 40 × 1.2 N.A. water immersion objective with correction collar. All measurements were performed in 96-well glass-bottomed plates in 100 μl of PBS with 1% BSA. For reactions containing the C-terminal fragment of hnRNP A2 or the N-terminal fragment of hnRNP E1, NP-40 was added to a final concentration of 0.033% to minimize aggregation. Final concentrations of labeled components were 5–10 nM. Alexa Fluor 488-labeled components were detected in channel A (excitation 488 nm, emission BP 505–550 nm). DY-520XL–labeled components were detected in channel B (excitation 488 nm, emission LP 650 nm). Dual-channel fluorescence fluctuations were analyzed in 3 × 120 s scans. Autocorrelation analysis of data from individual channels was used to determine total concentrations for each component. Cross-correlation analysis of dual channel data was used to determine concentrations of bimolecular complexes containing both fluorophores. Each pairwise combination of molecules was assumed to undergo simple bimolecular association of the type A + B ⇔ AB. Apparent Kd values were calculated as shown below.
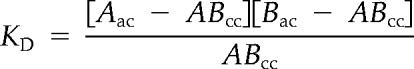 |
where Aac is the total concentration of molecule A, determined by autocorrelation analysis of data from channel A; Bac is the total concentration of molecule B, determined by autocorrelation analysis of data from channel B; and ABcc is the concentration of the AB complex, determined by cross-correlation analysis of data from channels A and B. As a positive control, the apparent Kd for binding of donkey anti-mouse IgG antibody (Alexa Fluor 488-labeled) to mouse IgG (Alexa Fluor 647-labeled) measured by cross-correlation FCS was <5 nM (the range of Kd values for antigen-antibody binding is 10−7–10−11). As a negative control, the apparent Kd for binding of BSA (Alexa Fluor 647-labeled) to hnRNP A2 (Alexa Fluor 488-labeled) was >50 nM.
Several limitations related to instrument sensitivity and reagent preparation can potentially reduce the extent of cross-correlation signal and therefore lead to underestimation of apparent Kd values measured by cross correlation FCS. With our Confocor II instrument the average number of photons detected as each labeled molecule traverses the FCS observation volume is relatively small, particularly for the green channel, which means there is a significant probability that some labeled molecules will traverse the volume without being detected, leading to reduced cross-correlation and underestimation of binding affinities. The average number of fluorophores per labeled protein molecule is also relatively small (2–3), which means that a significant proportion of molecules will be unlabeled, reducing the extent of cross correlation and leading to underestimation of the binding affinity. If some molecules are denatured, degraded, or otherwise inactivated during purification or conjugation this may reduce the extent of cross correlation leading to underestimation of binding affinities. This may be particularly problematic in the case of the C terminus of hnRNP A2 where purification required denaturation and renaturation. Because the relative contributions of these various factors are difficult to determine, the binding affinities measured by dual channel cross correlation FCS should be considered “apparent” Kd values with the understanding that they may represent underestimates of the actual binding affinities.
To prepare RNA containing a tandem array of multiple A2RE sequences for in vitro binding studies, sense GATC(GCCAAGGAGCC)6 and antisense GATC(GGCTCCTTGGC)6 oligonucleotides containing six A2RE sequences were annealed and cloned into the BamH1 site of pLITMUS 28i (New England Biolabs, Beverly, MA). One clone (pA2RE12) contained two copies of the insert in a tandem head to tail orientation. To generate A2RE RNA (285 nt) containing 12 A2RE sequences pA2RE12 DNA was linearized with StuI and transcribed with T7 polymerase (Epicenter Technologies, Madison, WI). To generate control nonA2RE RNA (149 nt) pLITMUS 28i without the insert was linearized with StuI and transcribed with T7 polymerase. Both reactions were performed in the presence of Alexa Fluor 488-5-UTP (Invitrogen), yielding labeled RNA products that were purified by MicroBio-Spin P-30 Tris RNase-free column (Bio-Rad), precipitated with 7.5 M ammonium acetate, and washed with 70% ethanol.
RESULTS
Yeast Two-Hybrid Analysis of hnRNP E1 Binding to hnRNP A2
A yeast two-hybrid screen of a human brain cDNA library using hnRNP A2 as bait identified several different binding partners for hnRNP A2 (Kosturko et al., 2005). High-stringency conditions were used to select true positive clones. To distinguish between proteins that bind specifically to hnRNP A2, plasmids from the clones of interest were used to transform yeast containing one of three different plasmids: bait (hnRNP A2), vector alone, or false bait (laminin), and the number of ADE2+HIS3+Lac z+ cotransformants was scored. Positive clones (30 from the original 50) bind to the bait better than to vector alone or to false bait. These clones were analyzed further by restriction endonuclease digestion of the PCR-amplified insert. Clones with unique digestion patterns were subjected to sequence analysis and BLAST searches. One of the clones corresponded to a nearly full-length copy of heterogeneous ribonucleoprotein (hnRNP) E1, an RNA-binding protein containing three K-homology (KH) domains (accession no. BC039742). The protein encoded by this clone, E1-25, corresponds to hnRNP E1 lacking the N-terminal 25 amino acids, representing a portion of the first KH domain. The yeast two-hybrid analysis indicates that hnRNP E1 interacts with hnRNP A2 when both proteins are overexpressed in yeast nuclei.
Coimmunoprecipitation of hnRNP E1 and hnRNP A2
To determine whether hnRNP E1 interacts with hnRNP A2 in vitro, binding of hnRNP E1-25 protein to hnRNP A2 protein was analyzed by coimmunoprecipitation using proteins synthesized by in vitro translation. [35S]Methionine-labeled hnRNP A2-c-myc fusion protein synthesized in vitro was mixed with unlabeled hnRNP E1-25-HA (hnRNP E1 bearing an HA epitope) or with a positive control protein, hnRNP A2-HA synthesized in vitro. Previous yeast two-hybrid analysis indicated that hnRNP A2 can interact with itself (Cartegni et al., 1996; Kosturko et al., 2005). After immunoprecipitation with anti-HA antibody, the complexes were analyzed by gel electrophoresis and autoradiography. Figure 1A shows that radiolabeled hnRNP A2 coprecipitated with both hnRNP E1 and with hnRNP A2. This indicates that binding can be detected between relatively small amounts of hnRNP E1 and hnRNP A2 synthesized in an in vitro translation system. Binding must be relatively tight and the off rate relatively slow for the proteins to remain bound during the multiple washing steps in the coimmunoprecipitation procedure.
Figure 1.

hnRNP E1–hnRNP A2 interaction. (A) Coimmunoprecipitation: in vitro translation products. In vitro synthesized [35S]methionine-labeled hnRNP A2 was combined with a fivefold molar excess of hnRNP A2-HA or hnRNP E1-25-HA, and the mixture was precipitated with anti-HA antibodies. The precipitates were separated by SDS-PAGE; the gel was fixed, dried, and exposed to x-ray film. (B) Coimmunoprecipitation: in vivo endogenous products. Oligodendrocyte homogenate was incubated with rabbit anti-hnRNP E1 or with normal rabbit serum (NRS). The immunoprecipitates were isolated with protein A-conjugated agarose beads, separated by SDS-PAGE, and subjected to Western blot analysis for the presence of hnRNP A2 using mouse anti-hnRNP A2. The right lane is an aliquot of the homogenate before immunoprecipitation. (C) Biotin transfer assay: hnRNP A2 (A2) conjugated with Sulfo-SBED was mixed with hnRNP E1 (E1), with BSA, or without any addition, and subjected (+) or not (−) to UV cross-linking. After reduction, the protein mixtures were analyzed by SDS-PAGE, blotted onto PVDF membrane, and probed with streptavidin-horseradish peroxidase (top). Corresponding portions were analyzed by SDS-PAGE and stained with Coomassie blue (bottom). Molecular weight markers are displayed to the left.
Western blotting of endogenous proteins present in the in vitro translation lysate (RRL) did not detect hnRNP A2 (our unpublished data) but did detect hnRNP E1 (Figure 6E). The latter did not prevent newly synthesized hnRNP E1 from binding to newly synthesized hnRNP A2. Indeed, endogenous hnRNP E1 in RRL did not bind hnRNP A2 in coimmunoprecipitation assay (Figure 6E). During the final stages of reticulocyte differentiation, suppression of translation of lipoxygenase mRNA (which is mediated by hnRNP E1 and hnRNP K) is relieved, suggesting that hnRNP E1 and/or hnRNP K in reticulocytes are modified in some manner preventing them from suppressing translation of lipoxygenase mRNA (Ostareck-Lederer et al., 2002; Ostareck-Lederer and Ostareck, 2004). It is possible that such modifications prevent binding of RRL-endogenous hnRNP E1 to newly synthesized hnRNP A2.
Figure 6.

Effect of hnRNP E1 on in vitro translation. (A) GFP-A2RE RNA (150 ng) translated in an RRL, in the absence or presence of hnRNP E1 (50, 100, 600, or 1200 nM). (B) GFP-A2RE RNA (150 ng) translated in the presence of hnRNP A2 (100 nM) and in the absence or presence of hnRNP E1 (50, 100, 600, or 1200 nM). Luciferase RNA (control) (250 ng) and GFP-A2RE RNA (150 ng) translated together in the presence of hnRNP A2 (100 nM) and in the absence or presence of hnRNP E1 (100, 200, 600, or 1200 nM). (C) GFP-A8G RNA (150 ng) translated in the presence of hnRNP A2 (100 nM) and in the absence or presence of hnRNP E1 (50, 100, 600, or 1200 nM). (D) The amount of GFP and luciferase synthesized was quantified after immunodetection, and the amount produced with RNA without any addition to the lysate was set to represent 100% translation efficiency. Bars represent standard deviations. (E) SDS-PAGE and Western blot detection with rabbit anti-hnRNP E1. Lane 1, RRL; lane 2, rhnRNP E1; lane 3, anti-hnRNP A2 immunoprecipitate of RRL containing 150 ng of A2RE RNA; lane 4, anti-hnRNP A2 immunoprecipitate of RRL containing 150 ng of A2RE RNA and recombinant hnRNP A2 (rhnRNP A2) (100 nM); lane 5, immunoprecipitate of RRL containing 150 ng A2RE RNA, recombinant hnRNP A2 (100 nM), and recombinant hnRNP E1 (1200 nM); and lane 6, anti-hnRNP A2 immunoprecipitate of recombinant hnRNP A2 (100 nM) and recombinant hnRNP E1 (1200 nM) in saline.
To determine whether hnRNP E1 associates with hnRNP A2 in vivo, antibodies to hnRNP E1 were added to a solubilized cell homogenate of cultured oligodendrocytes. The control consisted of a sample in which normal rabbit serum was added to a similar aliquot of the same cell homogenate. Immune complexes and proteins associated with them were isolated by centrifugation after binding to protein A-conjugated agarose beads. Complexes were solubilized and subjected to SDS-PAGE and Western blotting (left and middle lanes). An aliquot of homogenate before any addition (right lane) was run on the same gel. The presence of hnRNP A2 in the cell homogenate and in the immune complexes was revealed with anti-hnRNP A2 and a secondary peroxidase-conjugated antibody. Figure 1B shows that hnRNP A2 was present in homogenate (right lane), in anti-hnRNP E1 immune complexes (left lane), but not in normal rabbit serum complexes (middle lane). This suggests that oligodendrocyte-endogenous hnRNP E1 associates with hnRNP A2 in vivo, either directly or through an intermediate.
Sulfo-SBED Cross-linking/Biotin Transfer between hnRNP A2 and hnRNP E1
Demonstrating interaction between two proteins by yeast two-hybrid analysis and coimmunoprecipitation does not prove direct binding between the two proteins because both yeast nucleoplasm, oligodendrocyte cytoplasm and reticulocyte lysates contain many other proteins that could mediate indirect interaction. To determine whether hnRNP E1 binds directly to hnRNP A2, binding was analyzed using purified recombinant proteins and a cross-linking/biotin transfer assay (ProFound Sulfo-SBED; Pierce Chemical). HnRNP A2 was conjugated to Sulfo-SBED, an amine group cross-linking reagent that contains a thiol-cleavable disulfide linkage, a biotin moiety, and a photoreactive aryl azyde group. Sulfo-SBED-conjugated hnRNP A2 was incubated with either full-length recombinant hnRNP E1 or BSA as a negative control. Sulfo-SBED–conjugated hnRNP A2 was UV cross-linked to its binding partners. Subsequent reduction of the disulfide bond in Sulfo-SBED results in transfer of the biotin moiety from hnRNP A2 to its binding partner. Biotin-labeled proteins were identified by SDS-PAGE and Western blotting using horseradish peroxidase-streptavidin. Figure 1C shows that in the reaction containing Sulfo-SBED–conjugated hnRNP A2 and full-length hnRNP E1, biotin is transferred from hnRNP A2 to hnRNP E1 after UV irradiation, indicating that hnRNP E1 binds to hnRNP A2. Biotin transfer to hnRNP A2 protein was also observed in all reactions, indicating that hnRNP A2 forms homotypic oligomers, which was previously reported based on the yeast two-hybrid screen (Cartegni et al., 1996; Kosturko et al., 2005). Biotin transfer from Sulfo-SBED–conjugated hnRNP A2 to BSA was not detected. The total protein content of each reaction mixture, visualized by Coomassie blue staining of the gel, showed that concentrations for each protein were comparable in the different reactions. These results indicate that purified hnRNP E1 binds directly to purified hnRNP A2 in solution. Because the protein concentrations in the Sulfo-SBED reaction are relatively high (15 μM), binding affinities cannot be determined by this technique.
FCS Analysis of hnRNP A2 and hnRNP E1 Binding Affinities
Binding affinities between hnRNP A2 and hnRNP E1 proteins were measured using dual channel cross correlation FCS with differentially labeled proteins (Schwille et al., 1997). FCS is a method to analyze fluorescence fluctuations that occur as fluorescent particles diffuse through a small (<1-fl) observation volume. Autocorrelation analysis of the fluorescence fluctuations is used to measure concentrations and diffusion coefficients of the fluorescent molecules. Differentially labeled molecules can be analyzed simultaneously by dual-channel FCS. If two differentially labeled molecules are bound to each other as they diffuse through the FCS observation volume, correlated fluorescence fluctuations will be detected in both channels. Cross-correlation analysis is used to measure the concentration of bimolecular complexes containing both molecules. Thus, autocorrelation data for each channel separately provides a measure of total concentrations for each of the two differentially labeled molecules, whereas cross-correlation data provide a measure of the concentrations of bound proteins. The Kd for the interaction can be calculated from the concentrations of free and bound proteins, as described in Materials and Methods. Binding affinities between recombinant hnRNP E1 and recombinant hnRNP A2 and subfragments of the two proteins were measured in this way (Table 1).
Table 1.
Apparent Kd values (nanomolar) for binding between hnRNP A2, and hnRNP E1
| hnRNP E1 (1-356) (full) | hnRNP E1 (1-173) (N-terminal) | hnRNP E1 (173-356) (C-terminal) | |
|---|---|---|---|
| hnRNP A2 (1-341) (full) | 22 ± 2.1 | 16 ± 2.3 | 37 ± 4.3 |
| hnRNP A2 (1-189) (N-terminal) | 9 ± 1.3 | 16 ± 2.9 | 48 ± 3.8 |
| hnRNP A2 (189-341) (C-terminal) | 15 ± 3.4 | 10 ± 3.5 | 18 ± 4 |
Average Kd values were calculated from at least three separate experiments for each pairwise combination of proteins. Full-length hnRNP A2 and subfragments of hnRNP A2 were conjugated with Alexa Fluor 488 and measured in channel A. Full-length hnRNP E1 and subfragments of hnRNP E1 were conjugated with DY-520XL and measured in channel B.
To identify hnRNP E1 binding sites in hnRNP A2, full-length hnRNP E1 (1-356), labeled with DY-520XL, was incubated with either full-length hnRNP A2 (1-341) or N- (1-189) or C (189-341) -terminal fragments of hnRNP A2, labeled with Alexa Fluor 488. To identify hnRNP A2 binding sites in hnRNP E1, full-length hnRNP A2, labeled with Alexa Fluor 488, was incubated with either full-length hnRNP E1 or N- (1-173) or C (173-356) -terminal fragments of hnRNP E1, labeled with DY-520XL. Total concentrations of individual labeled molecules in each reaction were determined by autocorrelation analysis of data from individual channels. Concentrations of bimolecular complexes containing both molecules were determined by cross-correlation analysis of data from both channels. Apparent Kd values determined for each pairwise combination of differentially labeled molecules are shown in Table 1.
Full-length hnRNP A2 binds to full-length hnRNP E1 (apparent Kd = 22 nM). HnRNP A2 contains two separate binding sites for hnRNP E1, one site located in the N-terminal portion of the molecules and one site located in the C-terminal portion. Both the N- and C-terminal fragments of hnRNP A2 bind more strongly to the N-terminal fragment of hnRNP E1 than to the C-terminal fragment. Individual subfragments of hnRNP A2 bind hnRNP E1 slightly tighter than the full-length protein, indicating negative cooperativity between the two sites in the intact protein. Either the conformation of full-length hnRNP A2 somehow reduces affinity for binding of hnRNP E1 to the N- and C-terminal binding sites or binding of hnRNP E1 to one site interferes with binding to the other site.
HnRNP E1 also contains two separate binding sites for hnRNP A2, a strong binding site located in the N-terminal portion of the molecule and a weaker binding site located in the C-terminal portion. Both subfragments of hnRNP E1 bind more strongly to the C-terminal fragment of hnRNP A2 than to the N-terminal fragment. However, full-length hnRNP E1 binds more strongly to the N terminus of hnRNP A2 than do either the N-terminal or the C-terminal fragments of hnRNP E1 alone, suggesting positive cooperativity between the two hnRNP A2 binding sites in full-length hnRNP E1. Binding of hnRNP A2 to one site may alter the conformation of hnRNP E1 to facilitate binding to the second site, or one hnRNP A2 molecule bound to one site may dimerize with a second hnRNP A2 molecule bound to the second site, decreasing the off rate for dissociation from hnRNP E1. These results indicate that hnRNP A2 and hnRNP E1 each have two potential interaction surfaces that can mediate cooperative combinatorial molecular interactions between the two proteins. Complexes between hnRNP A2 and hnRNP E1 can form in different ways, depending on which particular interaction surfaces are involved. Furthermore, each protein contains two separate binding sites for the other protein, which means the stoichiometry of hnRNP A2::hnRNP E1 complexes can vary from 1:2 to 2:1. Because both hnRNP A2 and hnRNP E1 can also interact with other molecular partners in vivo, binding of the two proteins in live cells may be affected by other proteins if specific molecular interaction surfaces of hnRNP A2 and/or hnRNP E1 are occupied by alternative binding partners.
Intracellular Concentrations of hnRNP A2 and hnRNP E1 in Oligodendrocytes
Because the apparent Kd value for binding of hnRNP E1 to hnRNP A2 in vitro is 22 nM, we measured the concentrations of hnRNP E1 and hnRNP A2 in oligodendrocytes to determine whether the proteins are present in high enough concentrations to interact with each other in vivo. Quantitative Western blotting was performed by comparing the intensities of the hnRNP E1 and hnRNP A2 bands for known numbers of oligodendrocytes with band intensities for known amounts of purified recombinant hnRNP E1 and hnRNP A2 proteins. A similar analysis of hnRNP E1 and hnRNP A2 in B104 cells showed that they contain twice the amount of hnRNP E1 and half the amount of hnRNP A2 compared with oligodendrocytes. The concentrations of each protein in the nucleus and cytoplasm of oligodendrocytes were calculated based on immunofluorescence staining of the two proteins and estimates of nuclear and cytoplasmic volumes. The results (Table 2) indicate that concentrations of hnRNP E1 and hnRNP A2 in the cytoplasm of oligodendrocytes are in excess over the Kd for binding, which means that binding between hnRNP E1 and hnRNP A2 can occur in the cytoplasm of oligodendrocytes.
Table 2.
Nuclear and cytoplasmic hnRNP A2 and hnRNP E1 in oligodendrocytes
| Molecules/cella | Nuclear conc. (μM)b | Cytoplasmic conc. (μM)c | |
|---|---|---|---|
| hnRNP A2d | 102 × 106 | 117 | 5.9 |
| hnRNP E1e | 1.56 × 10⁶ | <0.01 | 0.26 |
a Measured by quantitative Western blotting with known numbers of cells and recombinant hnRNP A2 and hnRNP E1 as standards.
b Nuclear volume of an oligodendrocyte was estimated to be 1 pl.
c Cytoplasmic volume of an oligodendrocyte was estimated to be 9 pl.
d Nuclear:cytoplasmic partition coefficient for hnRNP A2 is 20:1 (determined by immunofluorescence confocal microscopy and subcellular fractionation).
e hnRNP E1 was not detected in the nucleus of oligodendrocytes by immunofluorescence and confocal microscopy.
Recruitment of hnRNP E1 to A2RE RNA Mediated by hnRNP A2
Because hnRNP E1 binds to hnRNP A2, which binds to A2RE RNA, it is possible that hnRNP E1 is recruited to A2RE RNA through binding to hnRNP A2. To test this possibility, recombinant hnRNP E1 labeled with Alexa Fluor 647 was incubated in the presence or absence of unlabeled recombinant hnRNP A2 with a synthetic RNA containing 12 repeats of the A2RE sequence or a control non-A2RE RNA labeled with Alexa Fluor 488. Recruitment of hnRNP E1 to RNA was measured by cross-correlation FCS (Figure 2). With non-A2RE RNA a low amount of nonspecific hnRNP E1 binding was detected with or without unlabeled hnRNP A2. With A2RE RNA hnRNP E1 recruitment was significantly enhanced in the presence of hnRNP A2, indicating that hnRNP E1 is recruited to A2RE RNA through binding to hnRNP A2. The binding curve seems sigmoidal and was fitted to the Hill equation with apparent Kd = 14.3 and Hill coefficient b = 4.7. The apparent Kd for hnRNP E1 recruitment to A2RE RNA in the presence of hnRNP A2 is comparable to the apparent Kd for binding of hnRNP E1 to hnRNP A2, suggesting that hnRNP E1 is recruited to A2RE RNA through binding to hnRNP A2 bound to A2RE sequences. Positive cooperativity indicated by the Hill coefficient may reflect cooperative binding of hnRNP E1 to N- and C-terminal binding sites on hnRNP A2 or may be an assay-specific phenomenon reflecting the fact that the test RNA contains reiterated A2RE sequences and thus can bind multiple hnRNP A2 molecules, each of which can bind hnRNP E1. Homotypic interactions between adjacent hnRNP E1 molecules recruited to the RNA could also contribute to positive cooperativity.
Figure 2.

Analysis of hnRNP A2-dependent recruitment of hnRNP E1 to A2RE RNA by cross-correlation FCS. Recombinant hnRNP E1, labeled with Alexa Fluor 647, was incubated in the presence (closed circles) or absence (open circles) of unlabeled hnRNP A2 (10 nM), with synthetic RNA containing 12 copies of the A2RE sequence (5 nM). Similarly labeled hnRNP E1 was incubated in the presence (closed triangles) or absence (open triangles) of unlabeled hnRNP A2 (10 nM), with control nonA2RE RNA (5 nM) labeled with Alexa Fluor 488. Unlabeled tRNA (250 nM) was included to reduce nonspecific binding. Recruitment of hnRNP E1 to RNA was determined by dual-channel cross-correlation FCS.
Colocalization of hnRNP E1 and hnRNP A2 in Granules in Oligodendrocytes
The binding studies described above indicate that hnRNP E1 can bind to hnRNP A2 in vitro and in vivo. To determine whether the proteins interact in neural cells, colocalization of hnRNP E1 and hnRNP A2 was analyzed in oligodendrocytes. Both hnRNP E1 and hnRNP A2 shuttle between the nucleus and the cytoplasm (Dreyfuss et al., 2002), and their interaction could potentially take place in either compartment. Immunostaining of oligodendrocytes was performed using a monoclonal anti-hnRNP A2 antibody and polyclonal anti-hnRNP E1 antibodies. The anti-hnRNP E1 antibodies cross-react with both hnRNP E1 and hnRNP E2 because these proteins are 90% homologous (Leffers et al., 1995; Gamarnik and Andino, 1997; Xiao et al., 2001). Immunostaining for hnRNP E1/E2 showed a punctate pattern throughout the soma and dendrites with little staining of the nucleus (Figure 3B). In contrast, hnRNP A2 was most abundant in the nucleus with punctate staining in the soma and dendrites (Figure 3A; Brumwell et al., 2002). Furthermore, although hnRNP A2-positive puncta were distributed uniformly throughout the oligodendrocyte dendrites, hnRNP E1/E2-positive puncta showed a nonuniform distribution with higher density of puncta in the cell body and proximal dendrites and lower density in distal dendrites.
Figure 3.

HnRNP E1/E2 association with A2RE RNA granules. Cultured oligodendrocytes were CSK-extracted, fixed, and immunostained with mouse anti-hnRNP A2 (1:200) (green channel) (A) and rabbit anti-hnRNP E1/E2 (1:50) (red channel) (B). Inset in B, high magnification of a distal portion of a dendrite. Yellow indicates spatial coincidence of green and red intensities. Cultured oligodendrocytes were microinjected with fluorescently labeled A2RE RNA (green) (D) and stained with anti-hnRNP E1/E2 (red) (E). Inset in D, high magnification of a medial portion of a dendrite. Fluorescence intensities of well-resolved granules were measured in each channel (A and B and D and E) and plotted (C and F, respectively) from a representative experiment. Each dot represents one granule. Bar, 15 μm.
To determine whether hnRNP E1/E2 was colocalized with hnRNP A2 in granules, coimmunostaining for both proteins was performed using differential fluorophores for their detection. Oligodendrocytes were first exposed to an extraction buffer to remove non-CSK–associated components (Biegel and Pachter, 1991). A high-magnification view of a distal portion of a dendrite (Figure 3B, inset) shows three populations of granules: granules containing both hnRNP E1/E2 and hnRNP A2, granules containing only hnRNP A2, and granules containing only hnRNP E1/E2. Single granule ratiometric analysis of clearly resolved granules in the dendrites (Figure 3C) indicates that hnRNP E1/E2 (green intensity) and hnRNP A2 (red intensity) are colocalized in ∼40% of the granules (>6700 granules analyzed in four independent experiments). The hnRNP A2+/hnRNP E1/E2− granule population and the hnRNP E1/E2+/hnRNP A2− granule population constituted 27 and 33%, respectively, of the total population of granules analyzed. Colocalization of hnRNP A2 and hnRNP E1/E2 in the cell body could not be analyzed because individual granules were not resolved in this compartment due to their high density. These data indicate that a subpopulation of hnRNP A2 granules in proximal and medial dendrites also contains hnRNP E1/E2.
Colocalization in the same granules does not provide evidence for direct interaction between hnRNP A2 and hnRNP E1. However, because in vitro analysis indicates that hnRNP A2 binds to hnRNP E1 it is likely that colocalization of hnRNP A2 and hnRNP E1 in the same granules is mediated by direct binding between the two proteins (see Discussion).
Colocalization of hnRNP E1 with A2RE mRNA in Granules in Oligodendrocytes
In oligodendrocytes, ∼90% of hnRNP A2-positive granules located in dendrites contain A2RE RNAs (Kosturko et al., 2005). To determine whether A2RE RNA granules also contain hnRNP E1/E2, fluorescently labeled A2RE RNA (546-nm fluorescence intensity; Figure 3D) was injected in the cell body and allowed to assemble into granules before fixing and staining for hnRNP E1/E2 (detected by 488-nm fluorescence intensity of the secondary antibody; Figure 3E). The inset in Figure 3E shows a medial portion of a dendrite where the majority of granules contains A2RE RNA and hnRNP E1/E2. Single granule ratiometric analysis of cells injected with A2RE RNA (Figure 3D) and immunostained for hnRNP E1/E2 (Figure 3E) indicates that 50% of A2RE RNA granules contain hnRNP E1/E2 (Figure 3F) (7000 granules analyzed in three independent experiments). These data indicate that hnRNP E1/E2 is associated with a subset of A2RE RNA granules, presumably recruited by binding to hnRNP A2.
Translation of A2RE mRNA Is Inhibited by hnRNP E1 In Vivo
Translation was analyzed in vivo using two protocols involving coinjection of GFP RNA into B104 neuroblastoma cells along with fluorescent dextran as a marker for the amount of RNA injected into each cell. The ratio of injected RNA to synthesized GFP provides a measure of translational efficiency. Because the amount of RNA injected into each cell is variable, translational efficiency can be measured over a range of RNA concentrations, which allows for determination of dose response and threshold or saturation effects due to under- or overexpression, respectively. Significant variability in translational efficiency was observed among different cells, which may reflect differences in the injection site or physiological differences among cells. However, if enough cells are analyzed this experimental approach can provide more information about translational efficiency in individual cells than conventional transfection/overexpression assays for in vivo translation.
In the first protocol, control B104 cells were injected with GFP-A2RE RNA, which contains a specific hnRNP A2 binding site (the A2RE sequence), or with GFP-A8G RNA, which differs from A2RE RNA by a single base change in the A2RE, eliminating specific hnRNP A2 binding. Cells injected with both RNAs exhibited comparable translational efficiencies over a range of RNA concentrations (Figure 4, A and C, respectively). In B104 cells overexpressing hnRNP E1, synthesis of GFP from GFP-A2RE RNA was reduced (Figure 4B), but synthesis of GFP from GFP-A8G RNA was not affected (Figure 4D). These data indicate that hnRNP E1 inhibits translation of A2RE RNA, presumably by binding to hnRNP A2.
Figure 4.

Effect of hnRNP E1 overexpression on translation. (A) B104 cells injected with GFP-A2RE RNA. (B) B104 cells injected with hnRNP E1 cDNA and GFP-A2RE RNA. (C) B104 cells injected with GFP-A8G RNA; (D) B104 cells injected with hnRNP E1 cDNA and GFP-A8G RNA. All RNAs were polyadenylated, and all the injection mixtures contained Alexa Fluor 546-conjugated dextran. Newly synthesized GFP was visualized in the green channel, and Alexa Fluor 546-conjugated dextran in the red channel. The average intensity in each channel was determined and plotted for each cell. Each dot represents one cell. A representative experiment is shown in which 68, 63, 48, and 64 cells were analyzed in A, B, C, and D, respectively.
In the second protocol, B104 cells were injected with GFP-A2RE RNA and hnRNP E1, or BSA as a control. In cells injected with GFP-A2RE RNA and BSA, GFP was synthesized normally (Figure 5A). However, in cells injected with GFP-A2RE RNA and hnRNP E1, GFP synthesis was reduced (Figure 5B). The ratio of GFP:RNA (0.08) was 10-fold less than in control cells, indicating that hnRNP E1 inhibits translation of A2RE RNA.
Figure 5.

Effect of added hnRNP E1 on in vivo translation. Control B104 cells were coinjected with A2RE-GFP RNA and BSA (A), GFP-A2RE RNA and hnRNP E1 (B), GFP-A8G RNA and BSA (C), and GFP-A8G RNA and hnRNP E1 (D). All RNAs were polyadenylated, and all injection mixtures contained Alexa Fluor 546-conjugated dextran. Newly synthesized GFP was visualized in the green channel, and Alexa Fluor 546-conjugated dextran in the red channel. (D) Average intensity in each channel was determined and plotted for each cell. Each dot represents one cell. A representative experiment is shown were 43, 52, 36, and 28 cells in which analyzed in A, B, C, and D, respectively. B104 cells were injected with Cy-5–labeled GFP-A2RE RNA (E, a and d), Cy-5–labeled GFP-A2RE RNA and hnRNP E1 (E, b and e), and Cy-5–labeled GFP-A2RE and RNAse A (E, c and f), and imaged 30 min (E, a–c) and 6 h (E, d–f)) after injection. The ratio of the average fluorescence intensity in the nucleus and the cytoplasm was calculated (F). The nuclear/cytoplasmic ratio of cells injected with RNA alone and RNA with hnRNP E1 was significantly smaller than that of cells injected with RNA and RNAse at both time points. Significance was assessed at p < 0.01.
In cells injected with GFP-A8G RNA and BSA (Figure 5C) or hnRNP E1 (Figure 5D) synthesis of GFP was comparable under both conditions. The ratio of GFP:RNA was 0.7 for cells injected with GFP-A8G RNA in the presence of hnRNP E1. These results indicate that hnRNP E1 inhibits translation of A2RE RNA but does not affect translation of A8G RNA. Because the A8G mutation interferes with binding of hnRNP A2 (Munro et al., 1999) and also prevents translation inhibition by hnRNP E1, this suggests that translation inhibition by hnRNP E1 requires hnRNP A2 binding.
To determine whether reduced GFP expression in the presence of hnRNP E1 was due to RNA degradation, we used a nuclear/cytoplasmic partition assay based on the observation that intact RNA is excluded from the nucleus, whereas products of RNA degradation diffuse into the nucleus (Nikolov and Dabeva, 1985; Ifrim, personal communication). Fluorescently tagged GFP-A2RE RNA injected with hnRNP E1 (Figure 5E, b and e) and without hnRNP E1 (Figure 5E, a and d) into the cytoplasm of B104 cells was excluded from the nucleus up to 6 h after injection, indicating that hnRNP E1 does not increase degradation of GFP-A2RE RNA. In both cases, the ratio of nuclear to cytoplasmic fluorescence intensity (0.39–0.55) did not vary significantly during the 6-h period (Figure 5F), but it was different from that of cells injected with GFP-A2RE RNA and RNAse (1.5–2.3). In that case, fluorescence accumulated in the nucleus (Figure 5E, c and f), indicating that the RNA was degraded by RNAse. These data indicate that reduced GFP expression in the presence of hnRNP E1 is not due to RNA degradation.
Inhibition of A2RE RNA Translation In Vitro by hnRNP E1 Is hnRNP A2 Dependent
To determine whether inhibition of translation by hnRNP E1 requires hnRNP A2, GFP-A2RE or GFP-A8G RNA was translated in vitro using an RRL system in the presence or absence of hnRNP A2 and increasing amounts of hnRNP E1 (Figure 6). The amount of RNA (150 ng) in each reaction was within the linear dose-response range (previously determined) to facilitate analysis of differences in translation efficiency (Kwon et al., 1999). The concentration range of recombinant hnRNP E1 tested was comparable to that used by Ostareck et al. (1997) in a similar assay. In the absence of hnRNP A2, hnRNP E1 had no effect on translation of GFP-A2RE RNA (Figure 6A). In the presence of hnRNP A2 (100 nM), increasing concentrations of hnRNP E1 inhibited translation. Inhibition of translation reached a maximum of ∼50% inhibition at 600 nM hnRNP E1 (Figure 6, B and D). Translation of a control RNA, luciferase (luc) RNA, was not significantly affected by the combined presence of hnRNP A2 and hnRNP E1 (Figure 6D) or by the combined presence of GFP-A2RE RNA, hnRNP A2, and hnRNP E1 (Figure 6B, double panel). When GFP-A8G RNA, which lacks specific binding to hnRNP A2 (Munro et al., 1999), was used in the assay in the presence of hnRNP A2, translation was not affected by hnRNP E1 (Figure 6, C and D), indicating that hnRNP E1 inhibition of translation of A2RE RNA is hnRNP A2 dependent. Translation of luciferase RNA in the presence of GFP-A8G RNA, hnRNP A2 and increasing amounts of hnRNP E1 remained constant (our unpublished data). RRL contains protein(s) that are recognized by antibodies to hnRNP E1/E2 and that have the apparent molecular weight of hnRNP E1 (Figure 6 E, lane 1). Immunoreactive hnRNP E1/E2 present in RRL did not precipitate with anti-hnRNP A2 antibodies in the absence or presence of recombinant hnRNP A2 (rhnRNP A2) (Figure 6E, lanes 3 and 4, respectively). In contrast, recombinant hnRNP E1 (rhnRNP E1) (Figure 6D, lane 2) coprecipitated with anti-hnRNP A2–hnRNP A2 complexes when added to RRL (Figure 6E, lane 5) or when in a saline solution with hnRNP A2 (Figure 6E, lane 6). These data suggest that hnRNP E1-like protein in RRL does not associate with hnRNP A2 and does not contribute to hnRNP A2-dependent inhibition of translation of A2RE RNA.
DISCUSSION
The results presented here indicate that hnRNP E1 binds to hnRNP A2 in vitro and is colocalized with hnRNP A2 and A2RE RNA in granules in oligodendrocytes. Sequence-specific binding of hnRNP A2 to A2RE RNA mediates recruitment of hnRNP E1, which inhibits translation of A2RE RNA in an hnRNP A2-dependent manner in vitro and in vivo.
Molecular interactions of hnRNP A2 and hnRNP E1 are complex and may involve quaternary structure. Both proteins exhibit homotypic as well as heterotypic interactions (Kim et al., 2000). The sequence of hnRNP E1 is 90% homologous to hnRNP E2, which must be present in multimeric form to bind to poliovirus RNA efficiently and permit cap-independent translation (Bedard et al., 2004). Our finding that hnRNP E1 binds to hnRNP A2 is consistent with the known properties of both proteins (Kamma et al., 1999; Makeyev and Liebhaber, 2002). HnRNP E1 and hnRNP E2 both contain three hnRNP KH domains. The N-terminal portion of hnRNP E2 (consisting of the first two KH domains and the two exons after the second KH domain) is necessary for dimerization and interaction with other hnRNPs (Kim et al., 2000). Our finding that the N-terminal subfragment of hnRNP E1 contains a high-affinity binding site for hnRNP A2 is consistent with a dimerization role for KH domains in hnRNP E1. Despite their sequence homology, hnRNP E1 and E2 have distinct functions and therefore may display different binding properties (Zhu et al., 2002).
Direct binding can be analyzed by a variety of fluorescence techniques, including fluorescence resonance energy transfer, bimolecular fluorescence complementation, and cross-correlation FCS. Each of these techniques involves analysis of binding interactions between exogenous fluorescent molecules injected or expressed in live cells. However, if intracellular concentrations of unlabeled endogenous proteins are high, fluorescently labeled exogenous molecules will interact predominantly with unlabeled endogenous molecules, thereby reducing the interactions of fluorescent molecules. Because intracellular concentrations of endogenous hnRNP A2 are extremely high, direct binding between hnRNP A2 and hnRNP E1 may be difficult to detect in live cells by fluorescent techniques.
Interaction of hnRNP E1 with hnRNP A2 seems to occur in cytoplasm where both proteins are colocalized in granules. Both proteins are believed to shuttle between the cytoplasm and the nucleus (Dreyfuss et al., 2002), but hnRNP E1/E2 was not detected in the nucleus of oligodendrocytes by immunofluorescence. This result is in accord with the observation of Gamarnik and Andino (1997) who did not detect hnRNP E1 in nuclei of HeLa cells, but contrary to that of Chkheidze and Liebhaber (2003) who did detect hnRNP E1 in the nucleus of the same cells and could not reconcile their observation with that of Gamarnik and Andino (1997). A study by Zhu et al., (2002) in brain sections reported that in neurons hnRNP E1 and E2 were detectable in the cytoplasm but not the nucleus. The subcellular distribution of hnRNP E1 may depend on its phosphorylation state, as reported for hnRNP K, which shifts from the nucleus to cytoplasm upon phosphorylation (Habelhah et al., 2001).
By analogy with other KH domain proteins (hnRNP K and ZBP), the function of hnRNP E1 may depend on its state of phosphorylation. Phosphorylation of hnRNP K and ZBP is mediated by c-src and derepresses translation of specifically silenced mRNAs by inhibiting binding of hnRNP K to the DICE sequence and ZBP to zip code sequence, respectively, in inhibited mRNAs (Ostareck-Lederer et al., 2002; Hüttelmaier et al., 2005). HnRNP E1 also exists in a phosphorylated form in vivo. The in vitro binding of the phosphorylated form to poly(rC) is significantly less than that of its nonphosphorylated form (Leffers et al., 1995). It is not known whether homotypic or heterotypic interactions of hnRNP E1 are affected by phosphorylation state. Coimmunoprecipitation data indicate that endogenous hnRNP E1 in RRL does not bind hnRNP A2 while recombinant hnRNP E1 does. These differences may be due to posttranslational modifications.
The mechanism of hnRNP A2-dependent inhibition of translation by hnRNP E1 is not known. Binding of hnRNP E1 and hnRNP K to the DICE sequence of 15-lipoxygenase mRNA inhibits translation by blocking recruitment of the 60S ribosomal subunit (Ostareck et al., 2001). Our data support a model in which hnRNP E1 is recruited to A2RE RNA by binding to hnRNP A2, which in turn is bound to the A2RE sequence. The A2RE RNA used in this study (GFP-A2RE RNA) does not contain a DICE sequence, but hnRNP E1 bound to hnRNP A2 may inhibit translation by a similar mechanism. Alternatively, hnRNP E1 could inhibit translation of A2RE RNA by inhibiting the cap-dependent translation enhancer function of hnRNP A2 (Kwon et al., 1999). However, this cannot explain the full extent of inhibition, because translation of GFP-A2RE RNA in the presence of hnRNP E1 and hnRNP A2 is less than with hnRNP E1 alone, indicating that inhibition of translation of A2RE RNA by hnRNP E1 and hnRNP A2 is greater than stimulation of translation by hnRNP A2 alone.
The extent of inhibition of translation by hnRNP E1 was greater in vivo than in vitro. Inhibition of translation of A2RE RNA in vitro reached a maximum of 50% at 600 nM hnRNP E1. Increasing the concentration of hnRNP E1 further did not result in greater inhibition. In comparison, injection or overexpression of hnRNP E1 in B104 cells inhibited translation of A2RE RNA almost completely. One possible explanation for this difference is that the concentration of hnRNP A2 (100 nM) added to the reticulocyte lysate used for in vitro translation may be subsaturating relative to the concentration of A2RE RNA (100 nM), so that some RNA molecules may not be associated with hnRNP A2 or may not have the necessary complement of hnRNP A2. Concentrations of hnRNP A2 (100 nM) and hnRNP E1 (100–1200 nM) in the in vitro assay were both greater than their Kd for binding (22 nM) in vitro. Translation inhibition was proportional to hnRNP E1 concentration up to a maximum at 600 nM, which represents a sixfold molar excess of hnRNP E1 over hnRNP A2. This suggests that either multiple hnRNP E1 molecules bind to each hnRNP A2 molecule or the in vitro translation lysate contains other components that compete with hnRNP A2 for binding to hnRNP E1. The simplest explanation is that translation in vitro is unaffected or enhanced when hnRNP A2 alone binds to A2RE RNA but inhibited when hnRNP A2::hnRNP E1 complex binds to A2RE RNA. Thus, the extent of translation inhibition is determined by the amount of hnRNP A2::hnRNP E1 bound to each A2RE RNA molecule.
Translation of A2RE RNA in vivo was almost completely inhibited by coinjecting exogenous hnRNP E1 along with the RNA. The concentration of hnRNP E1 in the injection needle was 2 μM. If the volume injected is ∼1/10 of the total cytoplasmic volume, the final intracellular concentration of injected hnRNP E1 will be 1/10 the concentration in the needle (∼200 nM). This means that the total concentration of endogenous plus injected hnRNP E1 in the cytoplasm of injected cells (∼0.5 μM) would be increased almost twofold compared with the concentration in control cells and would be comparable to the concentration of recombinant hnRNP E1 necessary to achieve 50% inhibition in the in vitro translation assay. Total cytoplasmic concentration of hnRNP A2 in control and injected cells (5.9 μM compared with 100 nM in the in vitro translation assay) is in excess over hnRNP E1 if it is all available for binding exogenous hnRNP E1. Availability of hnRNP A2 and hnRNP E1 in the neural cell cytoplasm or the reticulocyte lysate is not known, but it is probably different in the two systems, because the composition of the reticulocyte lysate differs from the composition of neural cell cytoplasm in terms of types and concentrations of molecular species present. For example, RNA binding proteins such as La autoantigen, hnRNP A1, and hnRNP A2 are either absent or present in very small amounts in reticulocyte lysate relative to mammalian nucleated cells (Meerovitch et al., 1993; Svitkin et al., 1996; this study), and their methylation or phosphorylation patterns may be different. Thus, the difference in extent of inhibition of translation in vitro and in vivo probably reflects molecular differences between reticulocyte lysate and B104 cell cytoplasm.
In other systems, inhibition of translation by hnRNP E1 and hnRNP K is reversible upon phosphorylation of hnRNP K by c-src kinase (Ostareck-Lederer et al., 2002). However, hnRNP E1 is not a substrate for c-src kinase. The recombinant hnRNP E1 used in this study presumably does not contain posttranslational modifications, but it does inhibit translation of A2RE RNA, suggesting that unphosphorylated hnRNP E1 may be the active form in translation inhibition. It is not known whether other posttranslational modifications of hnRNP E1 affect its binding to hnRNP A2 or its role in translation regulation. Translation of A2RE RNA may be activated by phosphorylation of hnRNP E1 or removal of hnRNP E1 from the RNA granules by some other mechanism. The relative paucity of hnRNP E1-containing granules in the distal dendrites suggests that hnRNP E1 is released from RNA granules when they become localized in the myelin compartment. Thus, the mechanism for localization dependent translation of A2RE RNA in oligodendrocytes may involve dissociation of hnRNP E1 from RNA granules.
ACKNOWLEDGMENTS
We thank Dr. Mathias Hentze for hnRNP E1 cDNA, Drs. A. Antony and R. Andino for the generous gifts of hnRNP E1 antibodies, and Dr. W. Rigby for the generous gift of hnRNP A2 antibodies. We thank Dr. M. Ifrim for sharing unpublished data on the RNA degradation assay. This work was supported by National Institutes of Health Grants NS-19943 (to E. B.) and NS-15190 and RR-022232 (to J.H.C.).
Abbreviations used:
- A2RE
A2 response element
- CSK
cytoskeleton
- DICE
differentiation control element
- FCS
fluorescence correlation spectroscopy
- GFP
green fluorescent protein
- hnRNP
heterogeneous nuclear ribonucleoprotein
- KH
hnRNP K homology
- MBP
myelin basic protein
- RRL
rabbit reticulocyte lysate.
Footnotes
This article was published online ahead of print in MBC in Press (http://www.molbiolcell.org/cgi/doi/10.1091/mbc.E05-10-0946) on June 14, 2006.
REFERENCES
- Ainger K., Avossa D., Diana A. S., Barry C., Barbarese E., Carson J. H. Transport and localization elements in myelin basic protein mRNA. J. Cell Biol. 1997;138:1077–1087. doi: 10.1083/jcb.138.5.1077. [DOI] [PMC free article] [PubMed] [Google Scholar]
- Ainger K., Avossa D., Morgan F., Hill S. J., Barry C., Barbarese E., Carson J. H. Transport and localization of exogenous myelin basic protein mRNA microinjected into oligodendrocytes. J. Cell Biol. 1993;123:431–441. doi: 10.1083/jcb.123.2.431. [DOI] [PMC free article] [PubMed] [Google Scholar]
- Barbarese E., Koppel D. E., Deutscher M. P., Smith C. L., Ainger K., Morgan F., Carson J. H. Protein translation components are colocalized in granules in oligodendrocytes. J. Cell Sci. 1995;108:2781–2790. doi: 10.1242/jcs.108.8.2781. [DOI] [PubMed] [Google Scholar]
- Bedard K. M., Walter B. L., Semler B. L. Multimerization of poly(rC) binding protein 2 is required for translation initiation mediated by a viral IRES. RNA. 2004;10:1266–1276. doi: 10.1261/rna.7070304. [DOI] [PMC free article] [PubMed] [Google Scholar]
- Biegel D., Pachter J. S. “In situ” translation: use of the cytoskeletal framework to direct cell-free protein synthesis. In vitro Cell. Dev. Biol. 1991;27A:75–85. doi: 10.1007/BF02630897. [DOI] [PubMed] [Google Scholar]
- Brumwell C., Antolik C., Carson J. H., Barbarese E. Intracellular trafficking of hnRNP A2 in oligodendrocytes. Exp. Cell Res. 2002;279:310–320. doi: 10.1006/excr.2002.5604. [DOI] [PubMed] [Google Scholar]
- Carson J. H., Worboys K., Ainger K., Barbarese E. Translocation of myelin basic protein requires microtubules and kinesin. Cell Motil. Cytoskeleton. 1997;38:318–328. doi: 10.1002/(SICI)1097-0169(1997)38:4<318::AID-CM2>3.0.CO;2-#. [DOI] [PubMed] [Google Scholar]
- Cartegni L., Maconi M., Morandi E., Cobianchi F., Riva S., Biamonti G. HnRNP A1 selectively interacts through its Gly-rich domain with different RNA-binding proteins. J. Mol. Biol. 1996;259:337–348. doi: 10.1006/jmbi.1996.0324. [DOI] [PubMed] [Google Scholar]
- Chkheidze A. N., Liebhaber S. A. A novel set of nuclear localization signals determine distributions of the αCP RNA-binding proteins. Mol. Cell. Biol. 2003;23:8405–8415. doi: 10.1128/MCB.23.23.8405-8415.2003. [DOI] [PMC free article] [PubMed] [Google Scholar]
- Colman D. R., Kreibich G., Frey A. B., Sabatini D. D. Synthesis and incorporation of myelin polypeptides into CNS myelin. J. Cell Biol. 1982;95:598–608. doi: 10.1083/jcb.95.2.598. [DOI] [PMC free article] [PubMed] [Google Scholar]
- Dahanukar A., Walker J. A. Smaug, a novel RNA-binding protein that operates a translational switch in Drosophila. Mol. Cell. 1999;4:209–218. doi: 10.1016/s1097-2765(00)80368-8. [DOI] [PubMed] [Google Scholar]
- Dahanukar A., Wharton R. P. The Nanos gradient in Drosophila embryos is generated by translational regulation. Genes Dev. 1996;10:2610–2620. doi: 10.1101/gad.10.20.2610. [DOI] [PubMed] [Google Scholar]
- Dreyfuss G., Kim V. N., Kataoka N. Messenger-RNA-binding proteins and the messages they carry. Nat. Rev. Mol. Cell Biol. 2002;3:195–205. doi: 10.1038/nrm760. [DOI] [PubMed] [Google Scholar]
- Gamarnik A. V., Andino R. Two functional complexes formed by KH domain containing proteins with the 5′ noncoding region of poliovirus RNA. RNA. 1997;3:882–892. [PMC free article] [PubMed] [Google Scholar]
- Gavis E. R., Lehmann R. Translational regulation of nanos by RNA localization. Nature. 1994;369:315–318. doi: 10.1038/369315a0. [DOI] [PubMed] [Google Scholar]
- Gillespie C. S., Trapp B. D., Colman D. R., Brophy P. J. Distribution of myelin basic protein and P2 mRNAs in rabbit spinal cord oligodendrocytes. J. Neurochem. 1990;54:1556–1561. doi: 10.1111/j.1471-4159.1990.tb01204.x. [DOI] [PubMed] [Google Scholar]
- Habelhah H., Shah K., Huang L., Ostareck-Lederer A., Burlingame A. L., Shokat K. M., Hentze M. W., Ronai Z. ERK phosphorylation drives cytoplasmic accumulation of hnRNP-K and inhibition of translation. Nat. Cell Biol. 2001;3:325–330. doi: 10.1038/35060131. [DOI] [PubMed] [Google Scholar]
- Hardy R. J., Lazzarini R. A., Colman D. R., Friedrich V. L. Cytoplasmic and nuclear localization of myelin basic proteins reveals heterogeneity among oligodendrocytes. J. Neurosci. Res. 1996;46:246–257. doi: 10.1002/(SICI)1097-4547(19961015)46:2<246::AID-JNR13>3.0.CO;2-0. [DOI] [PubMed] [Google Scholar]
- Hartman B. K., Agrawal H. C., Kalmbach S., Shearer W. T. A comparative study of the immunohistochemical localization of basic protein to myelin and oligodendrocytes in rat and chicken brain. J. Comp. Neurol. 1979;188:273–290. doi: 10.1002/cne.901880206. [DOI] [PubMed] [Google Scholar]
- Hoek K. S., Kidd G. J., Carson J. H., Smith R. HnRNP A2 selectively binds the cytoplasmic transport sequence of myelin basic protein mRNA. Biochemistry. 1998;37:7021–7029. doi: 10.1021/bi9800247. [DOI] [PubMed] [Google Scholar]
- Hüttelmaier S., Zenklusen D., Ledere M., Dictenberg J., Lorentz M., Meng X., Bassell G. J., Condeelis J., Singer R. H. Spatial regulation of β-actin translation by Src-dependent phosphorylation of ZBP1. Nature. 2005;438:512–515. doi: 10.1038/nature04115. [DOI] [PubMed] [Google Scholar]
- Kamma H., Horiguchi H., Wan L., Matsui M., Fujiwara M., Fujimoto M., Yazawa T., Dreyfuss G. Molecular characterization of the hnRNP A2/B1 proteins: tissue-specific expression and novel isoforms. Exp. Cell Res. 1999;246:399–411. doi: 10.1006/excr.1998.4323. [DOI] [PubMed] [Google Scholar]
- Kim J. H., Hahm B., Kim Y. K., Choi M., Jang S. K. Protein-protein interaction among hnRNPs shuttling between the nucleus and cytoplasm. J. Mol. Biol. 2000;298:395–405. doi: 10.1006/jmbi.2000.3687. [DOI] [PubMed] [Google Scholar]
- Kim-Ha J., Kerr K., Macdonald P. M. Translational regulation of oskar messenger RNA by Bruno, an ovarian RNA binding protein, is essential. Cell. 1995;81:403–412. doi: 10.1016/0092-8674(95)90393-3. [DOI] [PubMed] [Google Scholar]
- Kosturko L. D., Maggipinto M. J., D’Sa C., Carson J. H., Barbarese E. The microtubule-associated protein, TOG, binds to the RNA trafficking protein, hnRNP A2. Mol. Biol. Cell. 2005;16:1938–1947. doi: 10.1091/mbc.E04-08-0709. [DOI] [PMC free article] [PubMed] [Google Scholar]
- Kwon S., Barbarese E., Carson J. H. The cis-acting RNA trafficking signal from myelin basic protein mRNA and its cognate trans-acting ligand hnRNP A2 enhance cap-dependent translation. J. Cell Biol. 1999;147:247–256. doi: 10.1083/jcb.147.2.247. [DOI] [PMC free article] [PubMed] [Google Scholar]
- Leffers H., Dejgaard K., Celis J. E. Characterization of two major cellular poly (rC)-binding proteins, each containing three K-homologous (KH) domains. Eur. J. Biochem. 1995;230:447–453. [PubMed] [Google Scholar]
- Makeyev A., Liebhaber S. A. The poly(C)-binding proteins: a multiplicity of functions and a search fro mechanisms. RNA. 2002;8:265–278. doi: 10.1017/s1355838202024627. [DOI] [PMC free article] [PubMed] [Google Scholar]
- McCarthy K., de Vellis J. Preparation of separate astroglial and oligodendroglial cell cultures from rat cerebral tissues. J. Cell Biol. 1980;85:890–902. doi: 10.1083/jcb.85.3.890. [DOI] [PMC free article] [PubMed] [Google Scholar]
- Meerovitch K., Svitkin Y. V., Lee H. S., Lejbkowicz F., Kenan D. J., Chan E.K.L., Agol V. I., Keen J. D., Sonenberg N. La autoantigen enhances and corrects aberrant translation of poliovirus RNA in reticulocyte lysate. J. Virol. 1993;67:3798–3807. doi: 10.1128/jvi.67.7.3798-3807.1993. [DOI] [PMC free article] [PubMed] [Google Scholar]
- Mouland A. J., Xu H., Cui H., Krueger W., Munro T. P., Prasol M., Mercier J., Rekosh D., Smith R., Barbarese E., Cohen E. A., Carson J. H. RNA trafficking signals in human immunodeficiency virus type 1. Mol. Cell. Biol. 2001;21:2133–2143. doi: 10.1128/MCB.21.6.2133-2143.2001. [DOI] [PMC free article] [PubMed] [Google Scholar]
- Munro T. P., Magee R. J., Kidd G. J., Carson J. H., Barbarese E., Smith L. M., Smith R. Mutational analysis of a heterogeneous nuclear ribonucleoprotein A2 response element for RNA trafficking. J. Biol. Chem. 1999;274:34389–34395. doi: 10.1074/jbc.274.48.34389. [DOI] [PubMed] [Google Scholar]
- Nichols R. C., Wang X. W., Tang J., Hamilton B. J., High F. A., Herschman H. R., Rigby W. F. C. The RGG domain in hnRNP A2 affects sub-cellular localization. Exp. Cell Res. 2000;256:522–532. doi: 10.1006/excr.2000.4827. [DOI] [PubMed] [Google Scholar]
- Nikolov E. N., Dabeva M. D. Re-utilization of pyrimidine nucleotides during rat liver regeneration. Biochem. J. 1985;228:27–33. doi: 10.1042/bj2280027. [DOI] [PMC free article] [PubMed] [Google Scholar]
- Ostareck-Lederer A., Ostareck D. H. Control of mRNA translation and stability in haematopoietic cells: the function of hnRNPs K and E1/E2. Biol. Cell. 2004;96:407–411. doi: 10.1016/j.biolcel.2004.03.010. [DOI] [PubMed] [Google Scholar]
- Ostareck D. H., Ostareck-Lederer A., Shatsky I. N., Hentze M. W. Lipoxygenase mRNA silencing in erythroid differentiation: the 3′UTR regulatory complex controls 60S ribosomal subunit joining. Cell. 2001;104:281–290. doi: 10.1016/s0092-8674(01)00212-4. [DOI] [PubMed] [Google Scholar]
- Ostareck D. H., Ostareck-Lederer A., Wilm M., Thiele B. J., Mann M., Hentze M. W. mRNA silencing in erythroid differentiation: hnRNP K and hnRNP E1 regulate 15-lipoxygenase translation from the 3′ end. Cell. 1997;89:597–606. doi: 10.1016/s0092-8674(00)80241-x. [DOI] [PubMed] [Google Scholar]
- Ostareck-Lederer A., Ostareck D. H., Cans C., Neubauer G., Bomsztyk K., Superti-Furga G., Hentze M. W. c-Src-mediated phosphorylation of hnRNP K drives translational activation of specifically silenced mRNAs. Mol. Cell. Biol. 2002;22:4535–4543. doi: 10.1128/MCB.22.13.4535-4543.2002. [DOI] [PMC free article] [PubMed] [Google Scholar]
- Persson P. B., Skalweit A., Mrowka R., Thiele B. J. Control of renin synthesis. Am. J. Physiol. 2003;285:R491–R497. doi: 10.1152/ajpregu.00101.2003. [DOI] [PubMed] [Google Scholar]
- Reimann I., Huth A., Thiele H., Thiele B. J. Suppression of 15-lipoxygenase synthesis by hnRNP E1 is dependent on repetitive nature of LOX mRNA 3′-UTR control element DICE. J. Mol. Biol. 2002;315:965–974. doi: 10.1006/jmbi.2001.5315. [DOI] [PubMed] [Google Scholar]
- Rongo C., Gavis E. R., Lehmann R. Localization of oskar RNA regulates Oskar translation and requires Oskar protein. Development. 1995;121:2737–2746. doi: 10.1242/dev.121.9.2737. [DOI] [PubMed] [Google Scholar]
- Roussel G., Nussbaum L. Comparative localization of Wolfgram W1 and myelin basic protein in rat brain during ontogenesis. Histochem. J. 1981;13:1029–1047. doi: 10.1007/BF01002642. [DOI] [PubMed] [Google Scholar]
- Schubert D., Heinemann S., Carlisle W., Tarikas H., Kines B., Patrick J., Steinbach J. H., Culp W., Brandt B. L. Clonal cell lines from the rat central nervous system. Nature. 1974;249:224–227. doi: 10.1038/249224a0. [DOI] [PubMed] [Google Scholar]
- Schwille P., Meyer-Almes F. J., Rigler R. Dual-color fluorescence cross-correlation spectroscopy for multicomponent diffusional analysis in solution. Biophys. J. 1997;72:1878–1886. doi: 10.1016/S0006-3495(97)78833-7. [DOI] [PMC free article] [PubMed] [Google Scholar]
- Shan J., Munro T. P., Barbarese E., Carson J. H., Smith R. A molecular mechanism for mRNA trafficking in neuronal dendrites. J. Neurosci. 2003;23:8859–8866. doi: 10.1523/JNEUROSCI.23-26-08859.2003. [DOI] [PMC free article] [PubMed] [Google Scholar]
- Smibert C. A., Lie Y. S., Shilinglaw W., Henzel W. J., Macdonald P. M. Smaug, a novel and conserved protein, contributes to repression of nanos mRNA translation in vitro. RNA. 1999;5:1535–1547. doi: 10.1017/s1355838299991392. [DOI] [PMC free article] [PubMed] [Google Scholar]
- Smibert C. A., Wilson J. E., Kerr K., Macdonald P. M. Smaug protein represses translation of unlocalized nanos mRNA in the Drosophila embryo. Genes Dev. 1996;10:2600–2609. doi: 10.1101/gad.10.20.2600. [DOI] [PubMed] [Google Scholar]
- Sternberger N. H., Itoyama Y., Kies M. W., Webster H. de F. Immunocytochemical method to identify basic protein in myelin-forming oligodendrocytes of newborn rat CNS. J. Neurocytol. 1978;7:251–263. doi: 10.1007/BF01217922. [DOI] [PubMed] [Google Scholar]
- Svitkin Y. V., Ovchinnikov L. P., Dreyfuss G., Sonenberg N. General RNA binding proteins render translation cap dependent. EMBO J. 1996;15:7147–7155. [PMC free article] [PubMed] [Google Scholar]
- Thiele B.-J., Doller A., Kahne T., Pregla R., Hetzer R., Regitz-Zagrosek V. RNA-binding proteins heterogeneous nuclear ribonucleoprotein A1, E1, and K are involved in post-transcriptional control of collagen I and III synthesis. Circ. Res. 2004;95:1058–1066. doi: 10.1161/01.RES.0000149166.33833.08. [DOI] [PubMed] [Google Scholar]
- Verity A. N., Campagnoni A. T. Regional expression of myelin protein genes in the developing mouse brain: in situ hybridization studies. J. Neurosci. Res. 1988;21:238–248. doi: 10.1002/jnr.490210216. [DOI] [PubMed] [Google Scholar]
- Xiao X., Tang Y. S., Mackins J. Y., Sun X. L., Jayaram H. N., Hansen D. K., Antony A. C. Isolation and characterization of a folate receptor mRNA-binding trans-factor from human placenta. J. Biol. Chem. 2001;276:41510–41517. doi: 10.1074/jbc.M106824200. [DOI] [PubMed] [Google Scholar]
- Zeller N. K., Behar T. N., Dubois-Dalcq M. E., Lazzarini R. A. The timely expression of myelin basic protein gene in cultured rat brain oligodendrocytes is independent of continuous neuronal influences. J. Neurosci. 1985;5:2955–2962. doi: 10.1523/JNEUROSCI.05-11-02955.1985. [DOI] [PMC free article] [PubMed] [Google Scholar]
- Zhu Y., Sun Y., Mao X. O., Jin K. L., Greenberg D. A. Expression of poly(C)-binding proteins is differentially regulated by hypoxia and ischemia in cortical neurons. Neuroscience. 2002;110:191–198. doi: 10.1016/s0306-4522(01)00522-x. [DOI] [PubMed] [Google Scholar]