Abstract
A microarray with sequences from the annotated open reading frames (ORFs) in Salmonella enterica subspecies 1, serovar Typhimurium was supplemented with annotated chromosomal ORFs from serovar Typhi that are divergent from Typhimurium (>10% DNA sequence divergence). This non- redundant array was used to (i) measure changes in gene copy number in DNA from actively growing versus stationary Typhi and (ii) to reveal the transcriptional response of Typhi to peroxide, a stress similar to that experienced when they are phagocytosed by macrophages. In S.enterica subspecies 1, pairs of genomes differ in the presence or absence of ∼10% of their genes. An array twice the size of that needed to cover all ORFs for one genome could carry close homologs of all the ORFs for 10 genomes. Non-redundant DNA arrays could be constructed for any group of closely related organisms that differ by the presence and absence of a few genes.
INTRODUCTION
Salmonella cause tens of millions of cases of food poisoning or typhoid each year (1–3) resulting in hundreds of thousands of deaths. The chromosomes of Salmonella enterica serovars Typhimurium (STM) LT2 and Typhi (STY) CT18 have been sequenced, and currently contain 4489 and 4599 annotated open reading frames (ORFs), respectively (4,5). Of all STY CT18 ORFs, 3888 ORFs share homologs in STM LT2 with >90% DNA sequence identity over the entire gene, and almost all of these genes have >97% identity over at least one stretch of 100 bp. Overall, there are 3999 STY CT18 genes that have an STM LT2 representative fulfilling one of these two sequence similarity criteria. Previously, we built an array of annotated ORFs from S.enterica serovar Typhimurium LT2 (6) that currently represents 4442 genes and gene fragments (including 104 pSLT plasmid genes). Overall coverage of the genome is 96.6%. Here we show that it was possible to make an array that can be used for expression analysis in both Typhimurium and Typhi by supplementing the LT2 array with the few hundred genes from Typhi that do not have a close homolog in Typhimurium.
MATERIALS AND METHODS
Array fabrication
Details of the construction of the backbone version of the Salmonella array were described previously (7). Minor changes were applied as follows: PCR products were purified using the MultiScreen PCR 96-well Filtration System (Millipore, Bedford, MA), and eluted in 30 µl of sterile water. Subsequently, the products were dried, resuspended in 15 µl 50% DMSO, and 5 µl were rearrayed into 384-well plates for printing. This backbone array was complemented by CT18 specific genes as follows.
Selection of Typhi CT18 genes. Each annotated Typhi ORF was scanned against the Typhi CT18 and Typhimurium LT2 genome in a sliding 100 base window. All genes that had at least one 90% match over 100 bp in Typhimurium were removed. From most of the remaining genes, those segments over 100 bp that had >80% homology with another Typhi gene (paralogous regions) were excluded from amplification. When an entire CT18 annotated gene remained after these selection processes, the full-length ORF was amplified. If only gene fragments remained then the largest fragment was selected for primer screening using default parameters in Primer 3 (http://www-genome.wi.mit.edu/cgi-bin/primer/primer3.cgi/ primer3_www.cgi) and requesting the largest compatible PCR product.
PCR. Primers were manufactured by Illumina (San Diego, CA). PCR was performed as described (8), using Typhi CT18 gDNA as template. All PCR products were purified using the MultiScreen PCR 96-well Filtration System (Millipore, Bedford, MA). Products were twice visually scored for presence, purity and size after agarose gel electrophoresis, resuspended in 50% DMSO and subsequently arrayed into 384-well plates (ABgene, Epsom, Surrey, UK) using Biomek-FX robotics (Beckman-Coulter, Fullerton, CA).
A complete set of the sequences for the successful PCR products is given in the Supplementary Material. Products were printed onto UltraGAPS slides (Corning, Inc., Corning, NY). The spotter and software used were from GeneMachines, San Carlos, CA (Omnigrid and Gridder 2.0).
Preparation of genomic DNA probes
Genomic DNA of S.enterica serovar Typhimurium strain LT2, and the Typhi strains CT18 and TY2 was prepared from fresh overnight culture or from bacteria in logarithmic growth phase (OD600 = 0.25–0.4) using the GenElute Bacterial Genomic DNA Kit (Sigma, St Louis, MO). Cells were grown in Luria broth at 37°C. The harvested nucleic acid was labeled using Cy3- and Cy5-dCTP (Amersham, Piscataway, NJ) and Klenow enzyme as previously described (8). Probes were purified using the QIAquick PCR purification kit (Qiagen, Valencia, CA) as suggested by the manufacturer, eluted in 1 mM Tris–HCl pH 8.0, dried down and resuspended in 10 µl sterile water.
Preparation of cDNA probes
A 10 ml overnight culture of S.enterica serovar Typhi strain TY2 was used to inoculate 500 ml of Luria broth and grown at 37°C, with shaking to an OD600 of 0.6. The culture was split into two flasks and fresh hydrogen peroxide (H2O2) was added to the experimental sample to a final concentration of 1 mM. The flasks were incubated further at 37°C, with shaking, and 35 ml samples were removed from control and experimental cultures 5, 10, 30 and 60 min after the addition of the H2O2 to the latter. Samples were transferred into chilled Oakridge tubes containing 6 ml of 5% phenol/95% ethanol, and cells were collected by centrifugation at 8000 g for 10 min at 4°C. Cells were lysed, RNA was collected, purified and DNase treated according to a hot phenol method previously described (9). Cy3- and Cy5-dye-linked dUTP was directly incorporated during reverse transcription from total RNA to synthesize labeled cDNA probes, following the method described by Pat Brown (http://cmgm.stanford.edu/pbrown/protocols/4_Ecoli_RNA.txt), with the following modifications: 50 µg of total RNA and 2.4 µg of random hexamers were resuspended in 30 µl of water, and subsequently the amounts and volumes of all components were doubled compared to the Brown protocol. Furthermore, 2 µl of RNAsin (F.Hoffmann-La Roche Ltd, Basel, Switzerland) was added to the reverse transcription, and the reaction incubated at 42°C for 2 h. After the first hour of incubation, further 2 µl of Superscript II reverse transcriptase were added. Probes were purified using the QIAquick PCR purification kit (Qiagen, Valencia, CA), and eluted in 1 mM Tris–HCl pH 8.0. Subsequently, probes were dried down and resuspended in 10 µl sterile water.
Hybridization and data acquisition
Immediately before use, the probes were mixed with equal volumes of 2× hybridization buffer containing 50% formamide, 10× SSC and 0.2% SDS, and boiled for 5 min. Probes were hybridized to the Salmonella array overnight at 42°C using a hybridization chamber (Corning) submerged in water. Protocols suggested by the manufacturer for hybridizations in formamide buffer (http://www.corning.com/Lifesciences/ technical_information/techDocs/gaps_ii_manual_protocol_5_ 02_cls_gaps_005.pdf) were applied for pre-hybridization, hybridization and post-hybridization wash processes. Scans were performed on a ScanArray 5000 Laser scanner (Packard BioChip Technologies, Billerica, MA) using ScanArray 2.1 software.
Data analysis
Signal intensities were quantified using the QuantArray 3.0 software package (Packard BioChip Technologies, Billerica, MA). Unless noted otherwise, two slides (each containing triplicate arrays) were hybridized reciprocally to Cy3- and Cy5-labeled probes per experiment. Spots were analyzed by adaptive quantitation, and local background was subsequently subtracted from the recorded spot intensities. Ratios of the contribution of each spot to total signal in each channel were calculated (data normalization). Negative values (i.e., local background intensities higher than spot signal) were considered no data. The median of the six ratios per gene was recorded. Genes displaying low hybridization signals were excluded before graphical representation: when comparing different genomes (Fig. 1), the lowest 10% of gene specific signals were determined for each channel, and 124 cases where both genomes gave signals in the lowest 10% were excluded from the graph. When comparing genomes of the same species (Fig. 2), signals that were in the lowest 5% on both genomes were excluded. For cDNA probes, ratios and standard deviations were calculated between the two conditions (e.g., experiment versus control). Genes with signals less than two standard deviations above background in both conditions were considered as not detected. The significance of differential expression, relative to control, was assessed using Cyber-T (10).
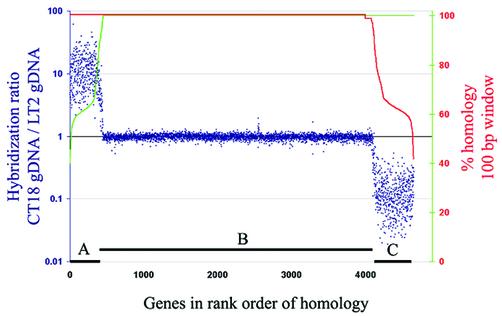
Figure 1.
Hybridization specificity of the array: percent identity plot. Data are sorted according to homology of array elements to STM LT2 genes (green line, increasing), and homology to STY CT18 genes (red line, decreasing), over a sliding 100 bp window. The three classes of genes are: (A) CT18 specific genes; (B) genes shared by CT18 and LT2; (C) LT2 specific genes. Thresholds defining the three classes: 97% identity in a 100 bp window, plus 90% over the entire fragment. Elements that did not fit both thresholds and genes with an >90% identical paralog were excluded. See Materials and Methods for details.
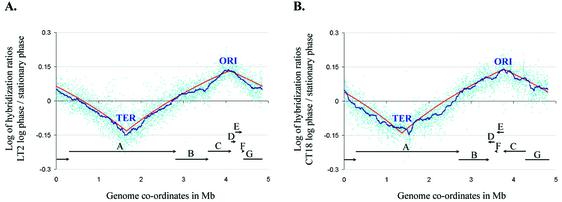
Figure 2.
Gene copy number changes during replication. Data for each gene are plotted in cyan in genome sequence order, starting at thrL. (A) Log of hybridization ratios for Typhimurium LT2 grown to log phase versus stationary phase. (B) Log of hybridization ratios for Typhi CT18, log phase versus stationary phase. The seven inter-rrn clusters are each marked by a horizontal bar with an arrow to indicate relative orientation. Red curve, ideal replication behavior assuming a uniform rate of DNA synthesis from ORI to TER. Blue curve, median of log ratios for the nearest 100 genes.
Accession numbers
The array platform and raw dataset for this manuscript were deposited in the public database: http://www.ncbi.nlm.nih. gov/geo/ as accession numbers GPL224, GSM3164– GSM3181 (GSE113–GSE115) and GSM3190–GSM3213 (GSE116).
RESULTS
Adding Typhi genes to the Typhimurium array
On the Typhimurium array, 3877 STY genes were represented by elements that have significant homology to an STM LT2 gene (>90% identity over the whole gene or 97% identity over a 100 bp window). To minimize potential problems with cross-hybridization by paralogs (other closely related genes in the same genome) the sequences of the Typhi-specific genes (>10% divergent from Typhimurium) to be added were checked for any segments of over 100 bases in length that were paralogous with >80% identity in the Typhi genome. The genes or gene fragments cleared of paralogous sequences were PCR amplified from CT18 and elements representing 471 STY genes were added to the array. Overall coverage of the Typhi CT18 genome was 94.5% (4348 genes).
The resulting microarray was probed with labeled genomic DNA from the two sequenced strains, Typhimurium LT2 and Typhi CT18. Of all the genes represented on the array, five elements had hybridization patterns that were not consistent with expectations and were excluded. The remaining products hybridized as expected and were used in subsequent analyses. Figure 1 shows the hybridization ratios in order of similarity over the most identical 100 bp window. Genes with multiple homologous copies and orthologous regions in either genome or with only partial overlaps were not plotted but behaved as expected for their class.
Measuring small changes in copy number
Microarrays have been used to map replication in yeast (11). We performed a similar experiment in Salmonella to demonstrate that PCR products from orthologs in one serovar can be used to report subtle differences in nucleic acid levels among experimental samples from another serovar. First, two separate DNA samples from Typhimurium LT2, harvested at log phase with shaking and at stationary phase, were hybridized to the array. The median ratios for these two samples were plotted in the order in which the genes appear in the Typhimurium genome. The resulting plot represents the relative increase in gene copy number near the origin of replication in the genome of the culture in logarithmic growth phase (Fig. 2A). A similar experiment was performed using Typhi CT18 DNA (Fig. 2B). The position of genes relative to the origin are scrambled in CT18 relative to LT2, due to multiple recombination events in the ribosomal clusters (12). Yet, when sorted for position in the appropriate genome, a very similar curve indicative of copy number is generated for both serovars. Interestingly, there are some possible areas of abnormal replication velocity indicated by deviations from the ideal curve. As these areas of deviant replication are well supported by many adjacent genes, this observation will be worthy of further research. Deviations from the ideal replication kinetics are more profound in Typhi CT18. We speculate that these might be caused by phage replication within the genome, or may be associated with the known structural instabilities of Typhi genomes, which results in the gene order in CT18 being highly atypical of the Escherichia coli/Salmonella clade (12). Nevertheless, this experiment shows that subtle differences (ratios of <1.5) in experimental samples from one serovar, Typhi, are generally measurable using a microarray consisting of homologs from another serovar, Typhimurium.
Differential gene expression induced by peroxide
Previously, we demonstrated the use of the Typhimurium component of these arrays to measure gene content in all the subspecies of Salmonella (7), and gene expression in Typhimurium (13,14). To demonstrate the use of the non-redundant array to study differential gene expression in Typhi, we chose peroxide treatment, a stress inflicted by the host when these bacteria enter macrophage during the infection process (15). This is a well studied system in E.coli and has been extensively characterized in Salmonella by methods other than microarrays. The genes shown to be regulated in previous studies can therefore be used to verify the microarray results. These experiments require an internal control for spot and hybridization variability. We used two controls and three fluorescent labels: one fluorophore for the treated RNA (sample), one for RNA from an untreated Typhi TY2 culture and a third one for genomic Typhi DNA. The results were similar with both controls so only data using the RNA control is presented, for brevity.
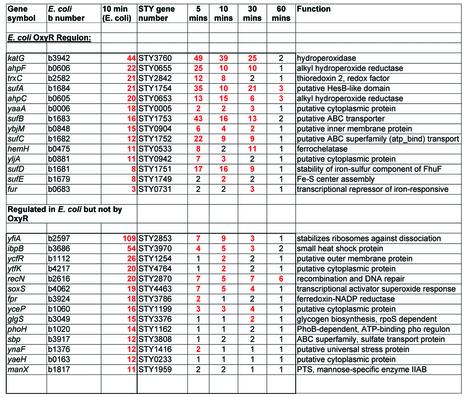
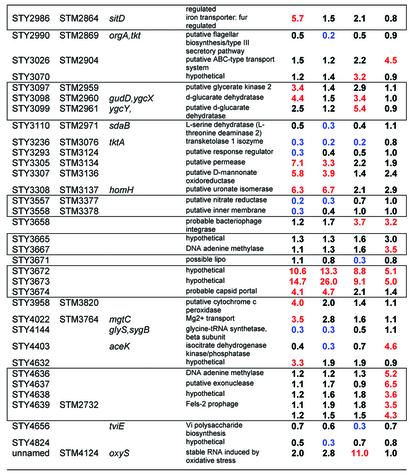
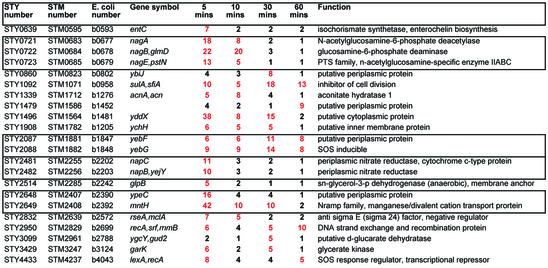
Cells growing in log phase in Luria broth were treated with 1 mM peroxide and samples were taken after 5, 10, 30 and 60 min incubation. Tables 1–3 present a summary of the data obtained from replicate experiments and six arrays with dye switching per experiment. The data was first cross-referenced to regulatory data from microarrays for E.coli grown to a similar density in the same media and treated with the same amount of peroxide (16). Of the genes shared by Typhi and E.coli, there were 28 genes previously reported (16) as most markedly induced after 10 min in E.coli. Almost all of these genes were similarly induced in Typhi (Table 1). Many additional genes that are shared by both genomes were found to be induced in Typhi but not reported as induced in E.coli microarray experiments (16). There were 22 genes of this class that were induced in Typhi by at least 4-fold (Table 2). Some of these genes, such as those involved in the SOS response, were previously reported to be important in the peroxide response (17 and references therein). However, most were not previously known to be regulated by peroxide, such as the nag operon involved in the uptake and metabolism of N-acetylglucosamine, and the nap operon encoding nitrate reductase. Two genes of no known function, yddX and ypeC, are among the top 10 induced genes in Typhi. The induction of sulA, an inhibitor of cell division, is accompanied by down regulation of almost all genes involved in replication and protein synthesis (not shown; see Supplementary Material).
Table 1. Genes known to be peroxide induced in E.coli.
Ratios rounded to the nearest integer. Red indicates >2-fold induction.
Regulation data in E.coli is taken from Zheng et al. (16).
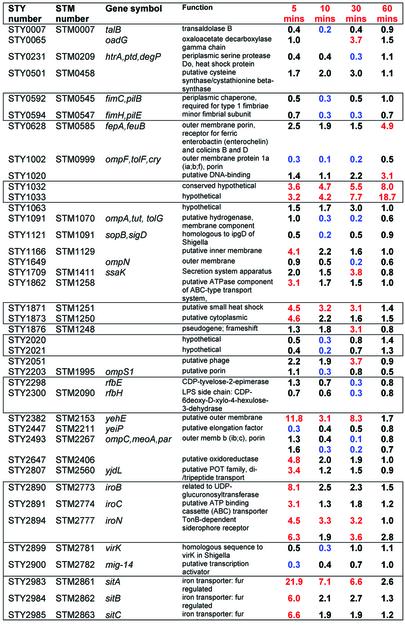
Table 3. Peroxide regulated Salmonella-specific genes.
Red indicates >3-fold induction. Blue indicates >3-fold reduction. Boxes enclose genes that are adjacent in the genome. STY2493, STY2894 and STY4639 are represented by two different amplifications on the array, and values for both spots are presented.
Table 2. Additional peroxide-induced genes shared by Salmonella and E.coli.
Ratios rounded to the nearest integer. Red indicates >4-fold induction.
Boxes indicate genes that are adjacent in the genome.
Finally, many genes were induced in Typhi that did not have a homolog in E.coli. The 77 genes of this class that are >3-fold regulated, up or down, during the time course are listed in Table 3. Repressed genes at some point in the time course include fim (fimbrae), rfb (LPS side chain synthesis), and the virulence-related genes, virK and mig-14. Induced genes include iro (iron transporter) and sit (metal transporter). The results also confirm the recent discovery of MntH as an important component of H2O2 resistance and virulence in Salmonella (18). Transcripts for sit, which is involved in Mn transport at high pH, and mntH, which is involved in Mn transport at low pH (19), are both induced by peroxide in our experiments at pH 7.0. This experiment also presents the first analysis of a microarray time-course of a bacterial transcriptional response to peroxide. Interestingly, regulation of a few genes appears to be sustained for 30 min or more. In some cases, regulation reaches its peak only after 30 min, exemplified by STY1032 and STY1033.
Overall, this peroxide treatment experiment was consistent with previous data and, in addition, demonstrates that a common stress experienced in nature by both of these related species elicits a response that has many unique aspects in each organism. Furthermore, the utility of the non-redundant array to monitor gene expression in Typhi was demonstrated using homologs from serovar Typhimurium.
DISCUSSION
From previous work on genome content (4,5,7,20) it can be expected that Typhimurium will have orthologs for about 90% of the genes in any other serovar in Salmonella subspecies I, the subspecies with all the major mammalian pathogens. Thus, an array about twice the size of that used to encompass the Typhimurium LT2 ORFs can be expected to provide coverage for about 10 genomes.
It is not necessary for expression studies to be limited to strains used to generate the sequences placed on the array. If PCR products from Typhimurium genes can reliably measure gene expression of close homologs in Typhi, then these PCR products can also reliably measure gene expression of close homologs in other Salmonella. Certain obvious caveats must be acknowledged, such as the fact that not all the genes in another strain may be represented on the array, and therefore non-homologous DNA present in the test strain will go unnoticed. Phage and plasmid genes as well as hypervariable surface antigens are likely to fail to be adequately represented. Also, it is not possible to confirm a hybridization to be due to an ortholog rather than a close paralog. In addition, reliably equal hybridization only occurs if sequence identities are at least 97% over a sliding 100 bp window within a gene. Therefore, it is possible that certain homologs in query strains will not be detected during comparative genome hybridization if they display a higher than average sequence divergence. This fact is well illustrated by rfbV and rfbX, the products of which are involved in LPS side chain biosynthesis. Due to different host ranges this operon is under strong selective pressure within the salmonellae, and consequently rfbV and rfbX homologs were not detected in Typhi by the homologous Typhimurium genes present on the array, and were supplemented as Typhi specific genes. Nevertheless, with these limitations in mind, it is possible to determine which close homologs are represented on the array by using the genome of the strain to be studied as the reference during hybridization. As genes from other strains are added to the array, coverage for unsequenced strains should increase.
As with conventional microarray analysis, amplifications and deletions of genome regions in test strains can easily be detected using a non-redundant array such as the one described in this paper. While the amplified or deleted sequences can readily be identified, the location of these abberant regions on the genomes of the tested strain cannot be revealed by microarray analysis alone. However, in concert with powerful methods like physical genome mapping, and long range PCR, much information about the genome structure and organization of test strains can be gained without expensive sequencing efforts.
There are a number of issues still outstanding with regards to the use of non-redundant arrays. For example, one variation on multi-genome arrays is to use long oligonucleotides instead of PCR products. This has the advantage of being simple, of hybridizing to only one strand, and less likely to hybridize to paralogs if designed correctly. However, for our purposes oligonucleotide arrays have two disadvantages. First, by PCR amplification of full ORFs wherever possible, we created a resource of such full-length genes. Second, oligos are typically 70 bases or less (21–23) and are presumably more sensitive to sequence divergence than longer PCR products, which may detect genes over a greater range of divergence than oligonucleotides. Nevertheless, as the price of oligos continues to fall, this avenue will become increasingly attractive, adding further power to the concept of non-redundant arrays for multiple genomes. It will be important to compare the performance of PCR products and oligonucleotide arrays for the represented genomes as well as related genomes that are unrepresented on these arrays.
In summary this manuscript describes the performance analysis of a microarray that relies on homologs from the genome of one organism to measure DNA content and gene expression in another moderately diverged strain. The array is supplemented with genes from the second strain that are missing in the first strain, allowing coverage of unique and/or diverged genes. This type of array should also be applicable to unsequenced strains to monitor close DNA homologs and for studying RNA levels of homologs. Such non-redundant arrays should have wide utility for groups of related organisms that differ from each other by moderate divergence at orthologous genes and have a few percent of genes that are unique between strains and which are added to the array.
SUPPLEMENTARY MATERIAL
Supplementary Material is available at NAR Online. Table A, description of array elements on the microarray platform. Table B, processed datasets for all experiments.
Acknowledgments
ACKNOWLEDGEMENTS
We thank Toan Nguyen for technical assistance and John Welsh and Ken Sanderson for helpful comments. This work was supported, in part, by NIH grant AI34829 (M.M.) and the generosity of Mr Sidney Kimmel.
REFERENCES
- 1.Chalker R.B. and Blaser,M.J. (1988) A review of human salmonellosis: III. Magnitude of Salmonella infection in the United States. Rev. Infect. Dis., 10, 111–124. [DOI] [PubMed] [Google Scholar]
- 2.Todd E. (1990) Epidemiology of foodborne illness: North America. Lancet, 336, 788–790. [DOI] [PubMed] [Google Scholar]
- 3.Cooke E.M. (1990) Epidemiology of foodborne illness: UK. Lancet, 336, 790–793. [DOI] [PubMed] [Google Scholar]
- 4.McClelland M., Sanderson,K.E., Spieth,J., Clifton,S.W., Latreille,P., Courtney,L., Porwollik,S., Ali,J., Dante,M., Du,F. et al. (2001) Complete genome sequence of Salmonella enterica serovar Typhimurium LT2. Nature, 413, 852–856. [DOI] [PubMed] [Google Scholar]
- 5.Parkhill J., Dougan,G., James,K.D., Thomson,N.R., Pickard,D., Wain,J., Churcher,C., Mungall,K.L., Bentley,S.D., Holden,M.T. et al. (2001) Complete genome sequence of a multiple drug resistant Salmonella enterica serovar Typhi CT18. Nature, 413, 848–852. [DOI] [PubMed] [Google Scholar]
- 6.McClelland M., Sanderson,K.E., Spieth,J., Clifton,S.W., Latreille,P., Courtney,L., Porwollik,S., Ali,J., Dante,M., Du,F. et al. (2001) Complete genome sequence of Salmonella enterica serovar Typhimurium LT2. Nature, 413, 852–856. [DOI] [PubMed] [Google Scholar]
- 7.Porwollik S., Wong,R.M. and McClelland,M. (2002) Evolutionary genomics of Salmonella: gene acquisitions revealed by microarray analysis. Proc. Natl Acad. Sci. USA, 99, 8956–8961. [DOI] [PMC free article] [PubMed] [Google Scholar]
- 8.Porwollik S., Wong,R.M., Sims,S.H., Schaaper,R.M., DeMarini,D.M. and McClelland,M. (2001) The ΔuvrB mutations in the Ames strains of Salmonella span 15 to 119 genes. Mutat. Res., 483, 1–11. [DOI] [PubMed] [Google Scholar]
- 9.von Gabain A., Belasco,J.G., Schottel,J.L., Chang,A.C. and Cohen,S.N. (1983) Decay of mRNA in Escherichia coli: investigation of the fate of specific segments of transcripts. Proc. Natl Acad. Sci. USA, 80, 653–657. [DOI] [PMC free article] [PubMed] [Google Scholar]
- 10.Long A.D., Mangalam,H.J., Chan,B.Y., Tolleri,L., Hatfield,G.W. and Baldi,P. (2001) Improved statistical inference from DNA microarray data using analysis of variance and a Bayesian statistical framework. Analysis of global gene expression in Escherichia coli K12. J. Biol. Chem., 276, 19937–19944. [DOI] [PubMed] [Google Scholar]
- 11.Raghuraman M.K., Winzeler,E.A., Collingwood,D., Hunt,S., Wodicka,L., Conway,A., Lockhart,D.J., Davis,R.W., Brewer,B.J. and Fangman,W.L. (2001) Replication dynamics of the yeast genome. Science, 294, 115–121. [DOI] [PubMed] [Google Scholar]
- 12.Ng I., Liu,S.L. and Sanderson,K.E. (1999) Role of genomic rearrangements in producing new ribotypes of Salmonella typhi. J. Bacteriol, 181, 3536–3541. [DOI] [PMC free article] [PubMed] [Google Scholar]
- 13.Wilson J.W., Ramamurthy,R., Porwollik,S., McClelland,M., Hammond,T., Allen,P., Ott,C.M., Pierson,D.L. and Nickerson,C.A. (2002) Microarray analysis identifies Salmonella genes belonging to the low-shear modeled microgravity regulon. Proc. Natl Acad. Sci. USA, 99, 13807–13812. [DOI] [PMC free article] [PubMed] [Google Scholar]
- 14.Wilson J.W., Ott,C.M., Ramamurthy,R., Porwollik,S., McClelland,M., Pierson,D.L. and Nickerson,C.A. (2002) Low-shear modeled microgravity alters the Salmonella enterica serovar Typhimurium stress response in an RpoS-independent manner. Appl. Environ. Microbiol., 68, 5408–5416. [DOI] [PMC free article] [PubMed] [Google Scholar]
- 15.Vazquez-Torres A. and Fang,F.C. (2001) Oxygen-dependent anti-Salmonella activity of macrophages. Trends Microbiol., 9, 29–33. [DOI] [PubMed] [Google Scholar]
- 16.Zheng M., Wang,X., Templeton,L.J., Smulski,D.R., LaRossa,R.A. and Storz,G. (2001) DNA microarray-mediated transcriptional profiling of the Escherichia coli response to hydrogen peroxide. J. Bacteriol., 183, 4562–4570. [DOI] [PMC free article] [PubMed] [Google Scholar]
- 17.Konola J.T., Sargent,K.E. and Gow,J.B. (2000) Efficient repair of hydrogen peroxide-induced DNA damage by Escherichia coli requires SOS induction of RecA and RuvA proteins. Mutat. Res., 459, 187–194. [DOI] [PubMed] [Google Scholar]
- 18.Kehres D.G., Janakiraman,A., Slauch,J.M. and Maguire,M.E. (2002) Regulation of Salmonella enterica serovar Typhimurium mntH transcription by H2O2, Fe2+ and Mn2+. J. Bacteriol., 184, 3151–3158. [DOI] [PMC free article] [PubMed] [Google Scholar]
- 19.Kehres D.G., Janakiraman,A., Slauch,J.M. and Maguire,M.E. (2002) SitABCD is the alkaline Mn2+ transporter of Salmonella enterica serovar Typhimurium. J. Bacteriol., 184, 3159–3166. [DOI] [PMC free article] [PubMed] [Google Scholar]
- 20.Edwards R.A., Olsen,G.J. and Maloy,S.R. (2001) Comparative genomics of closely related salmonellae. Trends Microbiol., 10, 94–99. [DOI] [PubMed] [Google Scholar]
- 21.Lipshutz R.J., Fodor,S.P., Gingeras,T.R. and Lockhart,D.J. (1999) High density synthetic oligonucleotide arrays. Nature Genet., 21, 20–24. [DOI] [PubMed] [Google Scholar]
- 22.Hughes T.R., Mao,M., Jones,A.R., Burchard,J., Marton,M.J., Shannon,K.W., Lefkowitz,S.M., Ziman,M., Schelter,J.M., Meyer,M.R. et al. (2001) Expression profiling using microarrays fabricated by an ink-jet oligonucleotide synthesizer. Nat. Biotechnol., 19, 342–347. [DOI] [PubMed] [Google Scholar]
- 23.Relogio A., Schwager,C., Richter,A., Ansorge,W. and Valcarcel,J. (2002) Optimization of oligonucleotide-based DNA microarrays. Nucleic Acids Res., 30, e51. [DOI] [PMC free article] [PubMed] [Google Scholar]
Associated Data
This section collects any data citations, data availability statements, or supplementary materials included in this article.


