Abstract
Recent studies have implicated reduced thiols (cysteine −SH) in the function of individual cell surface proteins. Studies presented here demonstrate that the overall level of reduced thiols on cell surface molecules differs on individual subsets of peripheral blood mononuclear cells and that these levels can be manipulated in vitro by altering the level of intracellular glutathione (iGSH). To quantitate cell surface thiols, we have developed a Hi-D (11-color) fluorescence-activated cell sorter method in which we covalently couple a fluorescent molecule, Alexa-maleimide, to free (reduced) –SH groups on proteins or other molecules exposed on the cell surface (exofacial membrane). In addition, to reveal changes in cell surface thiol levels in response to various in vitro treatments, we used a pair of fluorescent Alexa dyes with distinct excitation and emission spectra to stain the cells before and after treatments. These in vitro studies demonstrate that decreasing iGSH, by specifically inhibiting its synthesis, decreases cell surface molecule thiols (csm−SH) and that preventing loss of iGSH also prevents loss of csm−SH. However, examination of peripheral blood mononuclear cell subsets tested immediately after isolation from healthy or HIV-infected subjects failed to reveal a similar relationship between internal iGSH and csm−SH. Although there is a relatively wide variation between individuals in both csm−SH and iGSH, there is no correlation between median iGSH and csm−SH compared for 22 healthy and 36 HIV-infected subjects. Collectively, our findings indicate that local environment plays a greater role in determining the redox status of cell surface molecules than the internal redox status of the cells.
Despite the oxidizing nature of extracellular environment, the presence of reduced thiol (−SH) groups on certain cell surface proteins are supported by the cell surface microenvironment (1, 2). The maintenance of −SH groups on these proteins is mediated by the shuffling of electrons between proteins containing redox active residues, which involves both oxidation/reduction couples and disulfide interchanges (1, 2). Cell surface proteins that have −SH groups include protein disulfide isomerase, thioredoxin, and the well known T cell surface molecule, CD4 (1–3).
The functional importance of −SH on cell surface molecule thiols (csm−SH) is reflected, for example, by the role proposed for surface protein disulfide isomerase in transfer of nitric oxide (NO) from extracellular S-nitrosothiols into the cytosol (4). In addition, −SH on CD4 and gp120 has been implicated in the entry of HIV in T cells and hence in the regulation of HIV infection of T cells (5, 6).
Glutathione (GSH), a cysteine-containing tripeptide (γ-glutamylcysteinylglycine), and its oxidized dimer GSSG, play a key role in regulating the intracellular redox balance and the status of −SH groups on proteins and other molecules. Via GSSG, thioredoxin, glutaredoxin, glutathione peroxidases, and other enzymes in the GSH system, GSH regulates the activity of enzymes and transcription factors by controlling whether the −SH group remains reduced and hence free or whether it is covalently coupled to GSH (or NO) (7–10).
The functional importance of intracellular GSH (iGSH) homeostasis is underscored by the large number of human diseases and conditions in which GSH is depleted and in which replenishing GSH is beneficial (e.g., refs. 11–17). Of relevance to HIV studies presented here, iGSH levels tend to decrease as HIV disease progresses (14, 15), and low GSH level in subjects with advanced HIV disease predict poor survival and impact T cell function. Most importantly, several studies show that GSH can be replenished in HIV infection, and a key study shows that T cell function is improved by treatment with N-acetylcysteine (NAC), a cysteine pro-drug that provides the cysteine needed to produce the cysteine-containing GSH (14, 18, 19).
In studies presented here, we introduce high-dimensional (11-color) flow cytometry (Hi-D FACS) (20) assays that measure csm−SH on individual cells in peripheral blood mononuclear cell (PBMC) subsets and can detect changes in csm−SH that occur after in vitro treatment of the cells. In this assay, we stain cells with fluorescent Alexa dyes linked to maleimide, which binds to free SH and thus enables covalent coupling of the Alexa to csm−SH on the cell surface.
To simply measure the amount of csm−SH on cells, we stain with a single Alexa-maleimide (ALM). However, to measure changes in csm−SH after in vitro treatments, we use a pair of ALM reagents with distinct excitation and emission spectra, Alexa 488 and Alexa 594, and stain cells before treatment with one reagent and after treatment with the other. These reagents were also chosen because they are compatible with the use of up to nine other fluorochrome-coupled reagents that can be used later to stain cells for subset-defining surface markers.
With this assay in studies presented here, we examine the relationship between iGSH and csm−SH in PBMCs. We first present data showing that treating PBMCs in vitro to decrease iGSH also decreases csm−SH. However, we also present data from a cross-sectional study of healthy and HIV-infected subjects that shows that iGSH and csm−SH levels are not correlated in freshly isolated PBMCs. Because the in vitro data are readily explained by indirect influence of iGSH on csm−SH, we interpret the collective findings presented here as indicating that redox conditions in the local environment play a greater role in determining the redox status of cell surface molecules than the internal redox status of the cells.
Materials and Methods
Biological and Chemical Reagents.
Monochlorobimane (MCB), Cascade blue, ALM-594, and ALM-488 were purchased from Molecular Probes. All Abs were obtained from PharMingen as purified Abs, which we conjugated to fluorochromes in our laboratory. Tandem conjugation protocols for Cy5PE, Cy5.5PE, and Cy7PE, and Cy5.5APC and Cy7APC have been published at www.drmr.com/abcon. R-Phycoerythrin (PE) and allophycocyanin (APC) were purchased from ProZyme (San Leandro, CA). FITC was purchased from Pierce. Cy5, Cy5.5, and Cy7 were purchased from Amersham Pharmacia. N-Ethylmaleimide (NEM), buthionine sulfoximine (BSO), and GSSG were purchased from Sigma.
Subjects.
Seven to 10 ml of peripheral blood was drawn from HIV-infected or healthy volunteers. The protocol for human blood sampling was approved by the Stanford Medical Center Internal Review Board.
PBMC Isolation.
PBMCs were obtained from 7–10 ml of blood drawn <2 h before initiation of the experiment. Unless otherwise indicated, PBMCs were isolated by gradient centrifugation on Ficoll-Hypaque (Amersham Pharmacia). In some experiments, the Ficoll step was eliminated to enable complete recovery of PBMC subsets, particularly neutrophils.
Staining Medium.
RPMI medium 1640 containing Hepes (hRPMI) and phenol red, supplemented with FCS, azide, and probenecid, was used as staining medium throughout the procedure. The pH was carefully adjusted to 7.4 to optimize staining of csm−SH and iGSH. Probenecid (2.5 mM; Sigma) was added to prevent outflow of the fluorescent MCB conjugate (GSB) that revealed iGSH.
Staining for iGSH.
MCB staining for iGSH was performed as described (21–23) and also described on http://herzenberg.stanford.edu. Briefly, 2–5 × 10⁶ cells were stained with 40 μM MCB at room temperature for precisely 20 min. Cells were chilled by addition of ice-cold FBS at 0°C to stop the enzyme-dependent staining reaction. Cells were then washed and maintained at 4°C during the remaining treatments. As indicated previously, 2.5 mM probenecid was added to the staining medium to prevent outflow of the fluorescent MCB conjugate (GSB) during the MCB staining step and thereafter.
iGSH Normalization to Correct for Measurement Variation Between Experiments.
iGSH levels were expressed relative to iGSH levels measured in the same experiment for a standard PBMC preparation (21–23). The standard PBMC preparation was isolated by Ficoll gradient centrifugation from a 500-ml blood sample from a healthy individual, aliquotted, and maintained in liquid nitrogen until just before use. Aliquots of the same standard were used for all normalizations carried out in this study.
Alexa Staining for csm−SH.
The protocol for surface thiol measurements was developed for this study. After MCB staining, 2–5 × 10⁶ cells were washed with ice-cold media, and 5 μM ALM-594 was added in cell suspension and incubated for 15 min on ice. Cells were then extensively washed and kept at 4°C. Alexa is a charged molecule that does not penetrate cells. However, to additionally ensure that active or passive Alexa uptake was prevented, cells were stained on ice.
Two-Step Alexa Staining for Short-Term Changes in Cell Surface csm−SH.
To measure potential alterations of csm−SH after in vitro treatments that perturbed cellular redox status, we used a two-step staining protocol with a pair of ALM dyes (ALM-488 and -594) with distinct excitation and emission spectra. For short-term experiments (e.g., 15-min treatments with NAC), we stained cells initially as above with ALM-594, put the cells in culture for the requisite time, and then stained with ALM-488 to quantitate levels of new thiols that were revealed. Thus, in these experiments, we obtain two measures for csm−SH that were able to be visualized by FACS on the same cell, one measure before and one after the treatment.
Staining with mAbs to Identify Lymphocyte Subsets.
After completing the staining for iGSH and csm−SH, the PBMCs were stained with a mixture of mAbs conjugated to different fluorochromes and detecting PBMC subset markers (23–26). Reagents detecting up to nine cell surface markers (CD3, CD4, CD8, CD62L, CD45RA, CD11a, CD20, CD16, CD56, and CD5) were combined by using fluorochromes that did not interfere with the iGSH and csm−SH measurements. Each subset marker was used in a saturating concentration predetermined for that specific reagent. The staining was carried out on ice for 15 min. Stained cells were then washed, resuspended in staining media, and data were acquired with the Hi-D FACS instrument described in the next section. Fluorescence compensation data were obtained by separately incubating and analyzing anti-Ig “beads” (courtesy of Alan Stall, BD–PharMingen, San Diego), which capture fluorochrome-coupled mAbs, with each of the fluorochrome-coupled Ab reagents used in the study.
Hi-D FACS Analysis.
The 11-color data acquisition was performed on a modified FACStarPlus (Becton Dickinson,) with MoFlo electronics (Cytomation, Fort Collins, CO). Data for samples and compensation controls were collected and stored with facs-desk software for future analysis. Compensation and analysis of data were performed offline with flowjo (Tree Star, San Carlos, CA) software.
Statistics.
Statistical evaluation of the data were carried out with the jmp statistics package (SAS Institute, Cary, NC) operating on Macintosh and Windows computers.
Manipulation of PBMC Redox Status.
Ficoll-isolated PBMCs were obtained from healthy donors less than 1 h before initiation of the experiment. Cells were incubated with additions in RPMI media 1640 supplemented with glutamine and antibiotics in 24-well plates at 37°C and 5% CO2. Incubation time varied as indicated. To determine immediate effects of reduction, oxidation, or glutathionylation of csm−SH, cells were treated with 1 mM NAC or 1 mM GSSG for 15 min on ice. To decrease iGSH by inhibiting GSH synthesis, PBMCs were incubated for 24 h with 250 μM BSO.
Results
FACS Staining for Free Thiols on csm−SH.
Previous studies with endothelial and fibrosarcoma cells (2) have shown that there are at least 15 cell surface proteins that may contain free −SH groups, depending on the redox status of the cells. To measure the overall level of these proteins and other −SH-containing molecules on PBMC subsets and to determine the relationship of these molecules to iGSH levels, we have developed a Hi-D FACS assay based on staining PBMCs with reagent combinations that allow simultaneous measurement of iGSH, csm−SH, and typical subset-defining mAbs.
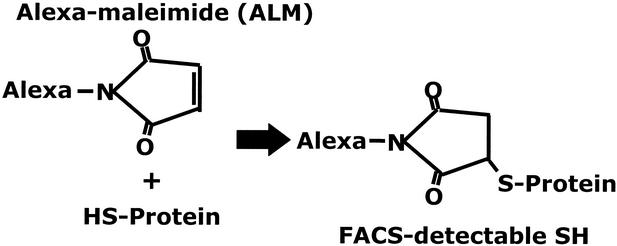
To stain csm−SH, we have taken advantage of the availability of ALM reagents. Maleimide is a nucleophilic molecule that couples covalently to free −SH groups. It is an efficient reagent for reacting with thiols and is generally considered to be highly specific for thiol groups.
Alexa dyes coupled to maleimide (ALMs) do not interfere with the efficiency of the maleimide–thiol reaction. Because they are charged molecules, they do not enter cells. Furthermore, they show no toxicity at levels used here for cell staining. Thus, because ALMs can be readily detected by FACS, they can be used to reveal the overall thiol levels present on the cell surface. Finally, because ALM excitation and emission spectra (Fig. 1) allow ALM-488 and ALM-594 to be detected independently of each other and of fluorochromes typically coupled to mAbs for Hi-D FACS studies, both ALMs can be used to reveal surface thiols on PBMC subsets (Figs. 1 and 2).
Figure 1.
FACS detection of cell staining with ALM-488 and ALM-594. ALM staining was detected with the Hi-D 13-parameter FACS in the Stanford Shared FACS Facility. Alexa-488 is excited by an argon-ion laser at 488 nm, whereas the Alexa-594 is excited by dye laser at 600 nm. The Alexa-488 emission is detected by using the band-pass filter of 530 ± 30 nm, and the Alexa-594 is detected by a 630 ± 22-nm band-pass filter.
Figure 2.
Mechanism of ALM reaction. ALM reacts with csm−SH via the maleimide portion of the ALM molecule. The reaction results in a covalently bound fluorescent conjugate that is detectable by FACS (see Fig. 1). ALM is a nontoxic charged molecule that does not enter cells at the concentrations used for staining.
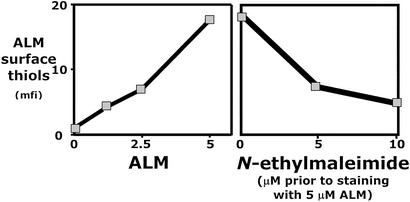
Staining with graded amounts of ALM shows that ALM staining does not saturate within the range of nontoxic concentrations. However, because the binding of ALM to lymphocytes essentially levels off at 5 μM (Fig. 3), we used this concentration for lymphocytes. Because ALM staining is inhibited by NEM (Fig. 3), we conclude that ALM is binding specifically to the targets to which NEM binds and hence that ALM is specifically binding to thiol groups on cell surface molecules.
Figure 3.
Specific labeling of csm−SH by using ALM. (Left) Titration of ALM-594 on lymphocyte subsets. (Right) NEM inhibits ALM binding to lymphocytes when the lymphocytes are preincubated for 15 min with NEM, washed twice, and then stained with ALM.
At present, we can state that the cell surface molecules that have free thiol groups are not small molecules that can be readily removed, because extensive “washing” with staining medium either before or after staining does not effectively change the staining level (data not shown).
Oxidation Decreases and Reduction Increases csm−SH.
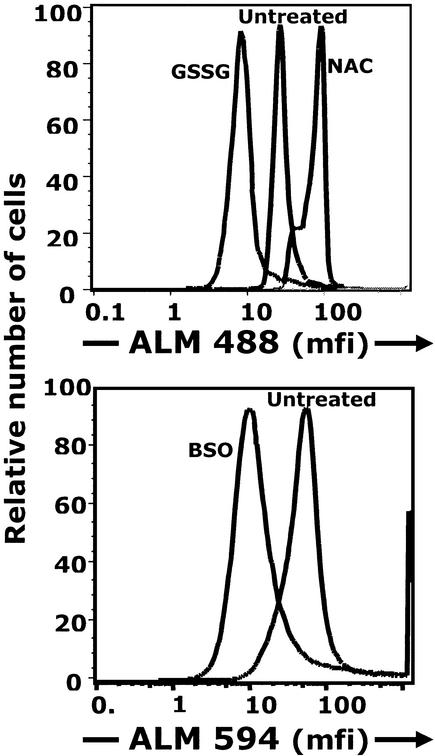
Short-term treatment at 4°C with 1 mM GSSG, which reacts with free −SH groups on proteins to form “mixed” GSH-protein disulfides, predictably blocks reactive cell surface thiols and decreases csm−SH (Fig. 4). In contrast, csm−SH is increased by short-term treatment with 1 mM NAC, which acts directly to reduce protein disulfides (Fig. 4). Similarly, csm−SH is increased by DTT treatment (data not shown).
Figure 4.
Manipulation of cellular redox status alters csm−SH. (Upper) Lymphocytes isolated from PBMCs were stained with ALM-594 before treatment and then treated for 15 min with either an oxidizing agent (GSSG) or a reducing agent (NAC) for 15 min on ice. Treated cells were then stained with ALM-488 and reagents to detect lymphocyte surface markers and analyzed by Hi-D FACS. (Lower) Cells were treated with BSO, which inhibits GSH synthesis. Cells were treated for 24 h in vitro, stained with ALM-594 and subset-detecting reagents, and analyzed by Hi-D FACS.
Depleting iGSH Decreases csm−SH.
Under the conditions used here, culturing does not significantly alter iGSH (<1% decrease). However, in vitro treatment of PBMCs with 250 μM BSO decreases the iGSH by 10%. Under these conditions, csm−SH also decreases ≈5-fold (Fig. 4).
csm−SH Levels on Major PBMC Subsets.
We examined csm−SH on naïve and several memory T cell subsets defined by the following markers: CD3, CD4, CD8, CD62L, CD45RA, CD11a, CD20, CD16, CD56, and CD5. In addition, we examined csm−SH on B cell subsets defined as CD3− CD20+, and CD5+ or CD5−.
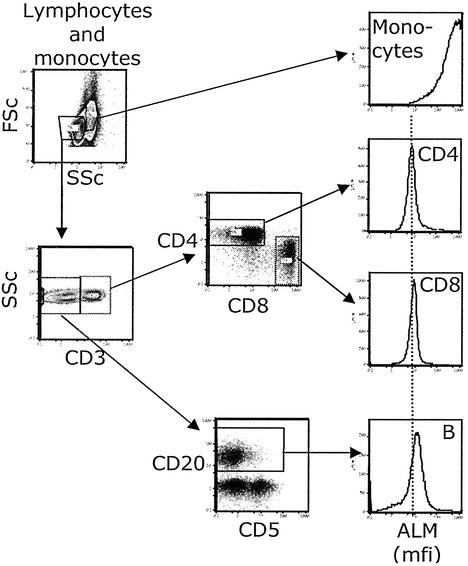
Overall, we find a close correlation between csm−SH on all T lymphocyte subsets in a given individual (data not shown). However, we find significant csm−SH differences between the major lymphocyte subsets in that B (Fig. 5) and NK cells (CD3−C16+CD56+) (data not shown) express higher csm−SH than T cells.
Figure 5.
csm−SH levels in lymphocyte subsets in freshly isolated PBMCs. PBMCs were stained for surface thiols and reagents to detect monocytes and lymphocyte subsets. Contour plots and arrows show the gating scheme used to define the subsets for which histograms are shown.
Histograms showing ALM staining (csm−SH) for PBMC subsets from a representative individual are presented in Fig. 5. The fluorescence signal obtained when monocytes and neutrophils are stained with 5 μM ALM is above accurate detection at our usual FACS setting. In contrast, 0.5 μM ALM yields a signal in measurable range for these cells, with the neutrophil signal being ≈10-fold greater than monocytes (data not shown). Because the monocyte signal at 5 μM ALM is still on scale (although above the accurately quantifiable range), we have included the 5 μM monocyte staining data along with the lymphocyte subset data in Fig. 5.
iGSH Does Not Predict csm−SH in Vivo.
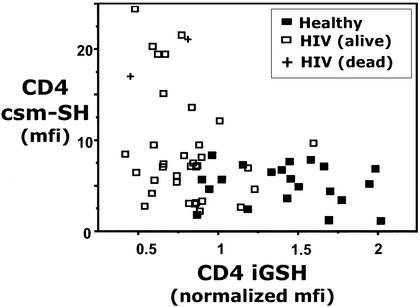
The concomitant fall in iGSH and csm−SH observed in the in vitro BSO treatment studies suggests that iGSH and csm−SH would be positively correlated in vivo. However, studies of iGSH and csm−SH in CD4 T cells from 22 healthy and 36 HIV-infected individuals paradoxically fail to reveal a positive correlation for these two measurements (Fig. 6).
Figure 6.
csm−SH and iGSH levels in CD4 T cells in PBMCs freshly isolated from healthy or HIV-infected subjects. mfi, median fluorescence intensity. Normalized iGSH, iGSH normalized to a standard iGSH-containing sample (see Materials and Methods).
Note that by combining the data for healthy and HIV-infected subjects, we were able to consider data over a wide range of iGSH levels (because many HIV-infected people have low iGSH). Nevertheless, there was no evidence of positive correlation. In fact, there was an apparent negative correlation between these variables, because very high csm−SH levels were observed in some HIV-infected subjects with very low iGSH. Interpretation of this finding, however, is confounded, because these individuals also have very low CD4 T cell counts and are generally in poor health. Because no correlation was observable within the healthy subject data, we conservatively conclude that iGSH and csm−SH show no relationship in vivo.
Discussion
In this study, we introduced a Hi-D FACS assay for measuring free thiols on csm−SH lymphocyte and other PBMCs. This assay takes advantage of the recent availability of fluorescent Alexa dyes that are covalently bound to maleimide, a well known nucleophilic molecule widely used to react with −SH groups on proteins and other molecules. ALM reagents are commonly used to make Alexa-labeled mAbs for use in FACS, fluorescence microscope, and other fluorescence-based studies. However, to our knowledge, studies presented here are a new use of ALM for labeling cell surface thiols.
With this assay, we have examined changes in csm−SH on human PBMCs treated in vitro to alter cellular redox status and have compared csm−SH levels on freshly isolated PBMCs from healthy and HIV-infected subjects. Curiously, results from these two types of studies do not seem to agree with respect to the mechanism regulating csm−SH.
In the in vitro studies, we showed that csm−SH decreases when the cells are treated with glutathione disulfide (GSSG), which oxidizes the thiols and results in the creation of mixed disulfides (e.g., protein-S-S-glutathione). In addition, we showed that csm−SH levels increase when cells are treated with a chemical reducing agent, DTT, or with NAC, a cysteine pro-drug that is used clinically to replenish GSH (depleted by acetaminophen overdose) but acts primarily as a reducing agent under the short-term culture conditions used here. Thus, as expected, csm−SH decreases when cells are treated (in vitro) with oxidizing agents and increases when cells are treated with reducing agents.
Consistent with these findings, csm−SH is decreased when cells are treated overnight with BSO, whose only known function is to inhibit GSH synthesis and thereby decrease iGSH (which causes oxidative stress). This finding would seem to indicate that iGSH regulates csm−SH. However, it is quite possible the csm−SH decrease is an indirect consequence of iGSH decrease, i.e., the csm−SH may reflect the release of GSSG from cells, which occurs under oxidative stress. As we have shown, GSSG binds to csm−SH and thus decreases csm−SH staining. Thus, GSSG release may explain the csm−SH decrease in response to BSO treatment.
Although this explanation is less direct than simply considering csm−SH to be controlled by iGSH, it is attractive because it reconciles our failure to find a correlation between iGSH and csm−SH in treated and freshly isolated PBMCs. In essence, this interpretation suggests that factors other than iGSH regulate csm−SH in vivo. These factors may include a variety of oxidants, reductants, and oxido-reductases (e.g., thioredoxin, thioredoxin reductase, glutaredoxin, etc.) present in blood (27–32). The oxido-reductases, in particular, can be expected to play a key role in determining surface thiol levels and thus most likely explain the differences observed between subjects in the in vivo studies presented here. Thus, we conclude that redox influences in the local environment play a greater role in determining the redox status of cell surface molecules than the internal redox status of the cells.
Acknowledgments
We thank Dr. Stephen De Rosa for thoughtful advice and help. We thank Drs. A. Zolopa and M. Harbour of the Stanford Positive Care Clinic, who played a key role in the clinical aspect of the project. We also thank Dr. David Parks for help with Hi-D FACS and John Mantovani for dedicated administrative assistance. The project was supported in part by National Institutes of Health Grant EB-00231. B.S. was supported by Swedish Cancer Society Fellowship 4500-B01-01SSA.
Abbreviations
- csm−SH
cell surface molecule thiols
- ALM
Alexa-maleimide
- GSH
reduced glutathione
- GSSG
oxidized GSH
- iGSH
intracellular GSH
- BSO
buthionine sulfoximine
- NAC
N-acetylcysteine
- FACS
fluorescence-activated cell sorter
- Hi-D FACS
11-color FACS
- PBMC
peripheral blood mononuclear cell
- MCB
monochlorobimane
- NEM
N-ethylmaleimide
References
- 1.Jiang X M, Fitzgerald M, Grant C M, Hogg P J. J Biol Chem. 1999;274:2416–2423. doi: 10.1074/jbc.274.4.2416. [DOI] [PubMed] [Google Scholar]
- 2.Donoghue N, Yam P T, Jiang X M, Hogg P J. Protein Sci. 2000;9:2436–2445. doi: 10.1110/ps.9.12.2436. [DOI] [PMC free article] [PubMed] [Google Scholar]
- 3.Matthias L J, Yam P T, Jiang X M, Vandegraaff N, Li P, Poumbourios P, Donoghue N, Hogg P J. Nat Immunol. 2002;3:727–732. doi: 10.1038/ni815. [DOI] [PubMed] [Google Scholar]
- 4.Ramachandran N, Root P, Jiang X M, Hogg P J, Mutus B. Proc Natl Acad Sci USA. 2001;98:9539–9544. doi: 10.1073/pnas.171180998. [DOI] [PMC free article] [PubMed] [Google Scholar]
- 5.Gallina A, Hanley T M, Mandel R, Trahey M, Broder C C, Viglianti G A, Ryser H J. J Biol Chem. 2002;277:50579–50588. doi: 10.1074/jbc.M204547200. [DOI] [PubMed] [Google Scholar]
- 6.Ryser H J, Levy E M, Mandel R, DiSciullo G J. Proc Natl Acad Sci USA. 1994;91:4559–4563. doi: 10.1073/pnas.91.10.4559. [DOI] [PMC free article] [PubMed] [Google Scholar]
- 7.Fratelli M, Demol H, Puype M, Casagrande S, Eberini I, Salmona M, Bonetto V, Mengozzi M, Duffieux F, Miclet E, et al. Proc Natl Acad Sci USA. 2002;99:3505–3510. doi: 10.1073/pnas.052592699. [DOI] [PMC free article] [PubMed] [Google Scholar]
- 8.Casagrande S, Bonetto V, Fratelli M, Gianazza E, Eberini I, Massignan T, Salmona M, Chang G, Holmgren A, Ghezzi P. Proc Natl Acad Sci USA. 2002;99:9745–9749. doi: 10.1073/pnas.152168599. [DOI] [PMC free article] [PubMed] [Google Scholar]
- 9.Ghezzi P, Romines B, Fratelli M, Eberini I, Gianazza E, Casagrande S, Laragione T, Mengozzi M, Herzenberg L A. Mol Immunol. 2002;38:773–780. doi: 10.1016/s0161-5890(01)00114-6. [DOI] [PubMed] [Google Scholar]
- 10.Stamler J S, Lamas S, Fang F C. Cell. 2001;106:675–683. doi: 10.1016/s0092-8674(01)00495-0. [DOI] [PubMed] [Google Scholar]
- 11.Spada C, Treitinger A, Reis M, Masokawa I Y, Verdi J C, Luiz M C, Silveira M V, Michelon C M, Avila-Junior S, Gil D O, Ostrowskyl S. Clin Chem Lab Med. 2002;40:452–455. doi: 10.1515/CCLM.2002.077. [DOI] [PubMed] [Google Scholar]
- 12.Badaloo A, Reid M, Forrester T, Heird W C, Jahoor F. Am J Clin Nutr. 2002;76:646–652. doi: 10.1093/ajcn/76.3.646. [DOI] [PubMed] [Google Scholar]
- 13.Rank N, Michel C, Haertel C, Lenhart A, Welte M, Meier-Hellmann A, Spies C. Crit Care Med. 2000;28:3799–3807. doi: 10.1097/00003246-200012000-00006. [DOI] [PubMed] [Google Scholar]
- 14.De Rosa S C, Zaretsky M D, Dubs J G, Roederer M, Anderson M, Green A, Mitra D, Watanabe N, Nakamura H, Tjioe I, et al. Eur J Clin Invest. 2000;30:915–929. doi: 10.1046/j.1365-2362.2000.00736.x. [DOI] [PubMed] [Google Scholar]
- 15.Herzenberg L A, De Rosa S C, Dubs J G, Roederer M, Anderson M T, Ela S W, Deresinski S C. Proc Natl Acad Sci USA. 1997;94:1967–1972. doi: 10.1073/pnas.94.5.1967. [DOI] [PMC free article] [PubMed] [Google Scholar]
- 16.Akerlund B, Tynell E, Bratt G, Bielenstein M, Lidman C. J Infect. 1997;35:143–147. doi: 10.1016/s0163-4453(97)91578-4. [DOI] [PubMed] [Google Scholar]
- 17.Akerlund B, Jarstrand C, Lindeke B, Sonnerborg A, Akerblad A C, Rasool O. Eur J Clin Pharmacol. 1996;50:457–561. doi: 10.1007/s002280050140. [DOI] [PubMed] [Google Scholar]
- 18.Bannai S. Biochim Biophys Acta. 1984;779:289–306. doi: 10.1016/0304-4157(84)90014-5. [DOI] [PubMed] [Google Scholar]
- 19.Bannai S, Christensen H N, Vadgama J V, Ellory J C, Englesberg E, Guidotti G G, Gazzola G C, Kilberg M S, Lajtha A, Sacktor B, et al. Nature. 1984;311:308. doi: 10.1038/311308b0. (lett.). [DOI] [PubMed] [Google Scholar]
- 20.Herzenberg L A, Parks D, Sahaf B, Perez O, Roederer M. Clin Chem. 2002;48:1819–1827. [PubMed] [Google Scholar]
- 21.Staal F J, Roederer M, Israelski D M, Bubp J, Mole L A, McShane D, Deresinski S C, Ross W, Sussman H, Raju P A, et al. AIDS Res Hum Retroviruses. 1992;8:305–311. doi: 10.1089/aid.1992.8.305. [DOI] [PubMed] [Google Scholar]
- 22.Staal F J, Roederer M, Herzenberg L A. Proc Natl Acad Sci USA. 1990;87:9943–9947. doi: 10.1073/pnas.87.24.9943. [DOI] [PMC free article] [PubMed] [Google Scholar]
- 23.Roederer M, Staal F J, Osada H, Herzenberg L A. Int Immunol. 1991;3:933–937. doi: 10.1093/intimm/3.9.933. [DOI] [PubMed] [Google Scholar]
- 24.Mitra D K, De Rosa S C, Luke A, Balamurugan A, Khaitan B K, Tung J, Mehra N K, Terr A I, O'Garra A, Herzenberg L A, Roederer M. Int Immunol. 1999;11:1801–1810. doi: 10.1093/intimm/11.11.1801. [DOI] [PubMed] [Google Scholar]
- 25.Roederer M, De Rosa S C, Watanabe N, Herzenberg L A. Semin Immunol. 1997;9:389–396. doi: 10.1006/smim.1997.0097. [DOI] [PubMed] [Google Scholar]
- 26.Roederer M, Herzenberg L A. Int Immunol. 1996;8:1–11. doi: 10.1093/intimm/8.1.1. [DOI] [PubMed] [Google Scholar]
- 27.Soderberg A, Sahaf B, Rosen A. Cancer Res. 2000;60:2281–2289. [PubMed] [Google Scholar]
- 28.Soderberg A, Sahaf B, Holmgren A, Rosen A. Biochem Biophys Res Commun. 1998;249:86–89. doi: 10.1006/bbrc.1998.9053. [DOI] [PubMed] [Google Scholar]
- 29.Sahaf B, Soderberg A, Spyrou G, Barral A M, Pekkari K, Holmgren A, Rosen A. Exp Cell Res. 1997;236:181–192. doi: 10.1006/excr.1997.3699. [DOI] [PubMed] [Google Scholar]
- 30.Sahaf B, Rosen A. Antioxid Redox Signal. 2000;2:717–726. doi: 10.1089/ars.2000.2.4-717. [DOI] [PubMed] [Google Scholar]
- 31.Nakamura H, De Rosa S C, Yodoi J, Holmgren A, Ghezzi P, Herzenberg L A. Proc Natl Acad Sci USA. 2001;98:2688–2693. doi: 10.1073/pnas.041624998. [DOI] [PMC free article] [PubMed] [Google Scholar]
- 32.Nakamura H, Vaage J, Valen G, Padilla C A, Bjornstedt M, Holmgren A. Free Radical Biol Med. 1998;24:1176–1186. doi: 10.1016/s0891-5849(97)00429-2. [DOI] [PubMed] [Google Scholar]


