

Abstract
The effect of intralysosomal proteolysis of near-infrared fluorescent (NIRF) self-quenched macromolecular probe (PGC-Cy5.5) has been previously reported and used for tumor imaging. Here we demonstrate that proteolysis can be detected noninvasively in vivo at the cellular level. A codetection of GFP fluorescence (using two-photon excitation) and NIRF was performed in tumor-bearing animals injected with PGC-Cy5.5. In vivo microscopy of tumor cells in subdermal tissue layers (up to 160 µm) showed a strong Cy5.5 dequenching effect in GFP-negative cells. This observation was corroborated by flow cytometry, sorting, and reverse transcription polymerase chain reaction analysis of tumor-isolated cells. Both GFP-positive (81% total) and GFP-negative (19% total) populations contained Cy5.5-positive cells. The GFP-negative cells were confirmed to be host mouse cells by the absence of rat cathepsin mRNA signal. The subfraction of GFP-negative cells (2.5–3.0%) had seven times higher NIRF intensity than the majority of GFP-positive or GFP-negative cells (372 and 55 AU, respectively). Highly NIRF-positive, FP-negative cells were CD45- and MAC3-positive. Our results indicate that: 1) intracellular proteolysis can be imaged in vivo at the cellular level using cathepsin-sensitive probes; 2) tumor-recruited cells of hematopoetic origin participate most actively in uptake and degradation of long-circulating macromolecular probes.
Keywords: tumor, cathepsin, microscopy confocal, fluorescent probe, indocyanine
Introduction
In vivo optical imaging techniques are increasingly used to study tumor microenvironment noninvasively using either endogenous expression of fluorescent proteins [2–5], bioluminescence [6], or intravenously administered fluorescent reporters [7–10]. Whereas the vast majority of studies have been done using intravital microscopy, more recently, macroscopic imaging techniques have become available to noninvasively study tumors or detect them in a clinical setting [11,12]. Irrespective of the mode of specific signal detection (absorption [13,14] or fluorescence), it has become clear that reporter probes could play an important role in extending the capabilities of optical imaging.
Optical imaging in living animals and humans dictates the use of near-infrared fluorochromes. The use of near-infrared fluorescence (NIRF) reporters in vivo has an inherent advantage in that: 1) tissues and blood have a high transmittance in the near-infrared range (700–850 nm) as opposed to the visible light; and 2) lower interference of scattered excitation far-red light. As a result, the fluorescence signal excited in the deeper layers of tissue than in the case of visible light fluorescence can potentially be acquired (reviewed in Ref. [11]). A number of nonspecific [9], targeted [15–17], and enzyme-activatable reporter probes [1,18–20] have previously been developed for cancer imaging. The observation that fluorochromes can be efficiently quenched and dequenched is the underpinning principle of mRNA-sensing beacons [21,22] and peptide-based protease reporter probes [19,20]. Our laboratory has been interested in the synthesis and application of a number of protease-specific imaging probes. One lead compound with high likelihood of clinical development is a cathepsin B-sensing NIRF probe [1]. This NIRF probe was originally designed using a biocompatible protected graft copolymer (PGC), which had been tested clinically [23]. The PGC has a long circulation time, resulting in accumulation in tumors [24,25] while being nonimmunogenic [26].
The prototype probe has been used to detect early breast tumors [27] and, more recently, gastrointestinal tumors [28]. The probes have been shown to unequivocally improve the detection of tumors and facilitate detection of early dysplastic lesions [28]. Cathepsin B is involved in several key processes of tumor progression including 1) extracellular matrix remodeling [29,30]; 2) invasion and metastasis [31,32]; and 3) in vivo tumor cell endocytosis [1]. Therefore, we decided to further identify the cell types that participate in enzymatic dequenching of fluorescence of cathepsin B-specific probes. In particular, the contributions of tumor cells and host stromal cells to probe activation had not been investigated, yet form a critical part in understanding how the self-quenched probes work in vivo. We used confocal intravital microscopy to visualize proteolytic activity in 9L tumor cells constitutively expressing green fluorescent protein (GFP) and host-derived (GFP-negative) cells to differentiate the roles of tumor and tumor-recruited cells in the effect of NIRF dequenching.
Materials and Methods
Synthesis of PGC-Cy5.5
Macromolecular probe, a graft copolymer of poly-l-lysine and methoxy polyethylene glycol, was prepared as described in Ref. [25] with modifications. Methoxy polyethylene glycol succinate (molecular weight 5 kDa; Shearwater Polymers, Birmingham, AL) was covalently attached to poly-l-lysine (15–35.5 kDa) using activation with water-soluble carbodiimide in the presence of sulfosuccinimide (Pierce, Rockford, IL) as described in Ref. [25]. Under chosen conditions, this synthetic step results in a 25% modification of free amino groups. The graft copolymer was purified from the excess of MPEGs using ultrafiltration on UFP cartridge with a cut-off of 100 kDa (A/G Technology, Framingham, MA). The graft copolymer was then further modified with the monoreactive Cy5.5 N-hydroxysuccinimide ester (Amersham-Pharmacia Biotech, Piscataway, NJ) as in Ref. [1]. Briefly, 1 mg of PGC was dissolved in 200 µl of 0.05 M NaHCO3, pH 8.7, and added to dried contents of Cy5.5 NHS modification vial (Amersham-Pharmacia Biotech). This amount of Cy5.5 dye, formulated by the manufacturer for antibody modification, resulted in desirable modification yield. Three hours later, PGC-Cy5.5 probe was purified by two sequential spins on BioGel P30 minicolumns (Bio-Rad, Hercules, CA) saturated with BSA and equilibrated with sterile phosphate-buffered saline (PBS). The amount of Cy5.5 attached to PGC and/or injected intravenously was verified using spectrophotometry at 675 nm, assuming e=250,000 M-1 cm-1. Control preparation of PGC (noncleavable) was prepared using poly-d-lysine and MPEG-SPA attached to N-e-lysine groups through non-cleavable bonds (Shearwater Polymers). Dequenching of the probe was tested by measuring fluorescence increase (λex 675/λem 694) in a mixture containing 10 µg of PGC-Cy5.5 and 100 U of trypsin (10 µg) in 1 ml of PBS, pH 7.0, at 37°C. In some experiments, bovine pancreatic trypsin inhibitor (200 U) was added to the polymer to test enzyme specificity. HPLC analysis of PGC-Cy5.5 was performed using SEC-5 (Rainin Instruments, Woburn, MA) gel permeation column eluted with 0.05 M sodium phosphate, pH 6.8.
Cell Culture
Stably transfected rat gliosarcoma 9L-GFP-34-1 line [3,33] was propagated in Dulbecco's modified Eagle's medium (DMEM; Cellgro; Mediatech, Washington, DC), with 10% FBS and 1% penicillin/streptomycin (Cellgro; Mediatech) and 1 mg/ml G418 (Sigma, St. Louis, MO).
Animal Model Female nu/nu mice (MGH Radiation Oncology breeding facilities, n=10, total of five independent experiments) were anesthesized using ketamine (80 mg/kg) and xylazine (12 mg/kg). 2x10⁵ cells in 25 µl of serum-free cell culture medium were injected subcutaneously into posterior aspect of the ear pinna. Tumors reached the size of 3 to 4 mm in diameter on 10th to 14th day after the inoculation. Animals were injected with 0.25 mg of PGC-Cy5.5 (200 nmol of Cy5.5/kg) intravenously in a volume of 100 µl of PBS. In 6 or 12 hours postinjection, animals were anesthesized and subjected to imaging as described below.
Near-Infrared Imaging
Optical reflectance imaging was performed using a previously described system [18]. The imaging set-up consisted of a light-tight box equipped with a 150-Whalogen lamp and an excitation filter set suitable for Cy5.5 excitation (610–650 nm; Omega Optical, Brattleboro, VT). Excitation light was homogeneously distributed over the field of view (FOV) using light diffusers. Fluorescence was detected by a 12-bit monochrome CCD camera (Kodak, Rochester, NY) equipped with a f/1.2 12.5- to 75-mm zoom lens and an emission 700-nm longpass filter (Omega Optical). The animals were imaged in supine position with tumors facing the glass surface. Images were digitally acquired as TIFF files and processed using commercially available software (IP Lab Spectrum; Signal Analytics, Vienna, VA).
Confocal and Two-Photon Imaging Set-Up
Confocal and two-photon imaging set-up consisted of a scanning laser microscope with a spinning polygon for the fast scanning axis and a galvanometer-mounted mirror for the slow axis [34]. A mode-locked titanium:sapphire laser (Coherent Mira, ∼100 mW at 820 nm) was used for two-photon excitation of the GFP, and a HeNe laser (17 mW at 633 nm, Model 1144P; Uniphase, San Jose, CA) was used for excitation of the Cy5.5 probe. The laser beam was focused to a diffraction-limited spot at the sample using a x30, 0.9 NA water immersion objective lens (LOMO Optics, Germantown, MD). The FOV was 400x300 µm. The fluorescence photons were collected by the same objective lens, and spectrally separated by a dichroic filter. The green (two-photon-excited) fluorescence was detected with a photomultiplier tube (Hamamatsu Model HC-124-2) without descanning. The red (one-photon-excited) fluorescence was descanned and separated from the excitation by a bandpass filter (Omega XF 3076) and detected by an avalanche photodiode (Hamamatsu Model C5460). Both scanning and image acquisition were computer-controlled (National Instruments 1408 and Scion Image VG-5) to produce variable frame rates from 5 to 30 Hz. Additional frame averaging was performed by using NIH Image software to increase sensitivity. The animals were anesthesized using ketamine-xylazine mixture and imaged in supine position with ear tumors facing a glass coverslip placed over the water immersion objective. The contact between the skin and glass was achieved by applying a gel with a refractive index of 1.34 onto a skin surface. First, the skin surface was identified using reflectance mode imaging. Next, the GFP-positive tumor cells were imaged in the two-photon (green) channel. Optical sections were acquired in 15- to 20-µm steps down to ∼150 to 200 µm from the skin surface, using an objective lens mounted on a micrometer-driven stage. After this stage, the titanium:sapphire laser was blocked, the HeNe excitation beam was unblocked, and the one-photon fluorescence (red channel) was acquired. The depth and the FOV were kept the same for the one- and two-photon scans in order to facilitate image analysis. Fluorescence coregistration within the same optical section was verified using a cell culture sample prepared using WTK1 lymphoblast cells stained with DiD (plasma membrane) and monobromobimane, a GSH-sensitive probe (cytoplasm). DiD fluorescence (red) was excited with one photon at 633 nm and monobromobimane fluorescence (green) was excited in a two-photon mode at 800 nm.
Flow Cytometry and Fluorescence Microscopy
Tumor cells were isolated from excised tumors using collagenase/hyaluronidase digestion. Briefly, tumors were minced in small (1–2 mm) fragments and treated with collagenase (1800 U/ml) and hyaluronidase (1220 U/ml) in Hank's solution containing 20 µg/ml DNAse I and 2 mM MgCl2, pH7.0, for 30 minutes at 37°C. Tissue fragments were disaggregated using pipetting. Isolated cells were washed by passing through a 2-ml step of 40% Histopaque-1077 in HBSS by sedimenting at 1000g for 10 minutes. Cells were washed again in HBSS (800g, 10 min) and kept on ice before sorting. After blocking with 1% BSA in PBS, cells were incubated in the presence of Fc block (anti-CD16/CD32 dilution 1:50; Pharmingen, San Diego, CA) and one of the following rat monoclonal antibodies: anti-CD45, anti-CD31 (PECAM-1), anti-VCAM-1, anti-MAC3 (Pharmingen) diluted 1:100, washed and incubated with phycoerythrin-labeled anti-rat IgG (Pharmingen) (dilution 1:50). Flow cytometry (FACSCalibur; Beckton Dickinson, San Jose, CA) was performed using samples with or without the first antibody.
Sorting of nonfixed cell isolates into GFP-negative and GFP-positive subfractions was performed using Becton Dickinson fluorescence-activated sorter. Isolated fractions were immediately processed for RNA isolation and reverse transcription polymerase chain reaction (RT-PCR). Fluorescence microscopy was performed using an inverted microscope (Zeiss Axiovert 100 TV, Wetzlar, Germany) fitted with a XF-100 (fluorescein) and XF48 (near-infrared) filter sets (Omega Optical). Images were acquired using a Photometrics CH250 CCD (Photometrics, Tucson, AZ) with image acquisition and storage controlled by IP Lab Spectrum software (Signal Analytics).
RT-PCR Analysis
Total RNA was isolated from 0.75x10⁵ to 1x10⁵ cells using the Absolutely RNA RT-PCR Miniprep Kit (Stratagene, LaJolla, CA) according to manufacturer's recommendations. RT-PCR was performed using Titan One Tube RT-PCR Kit (Roche, Mannheim, Germany). Ten nanograms of total RNA was used for one reaction. The cDNA preparations obtained using RNA templates isolated from nonfluorescent and fluorescent cells were subjected to PCR analysis for cathepsin B and cathepsin H mRNA expression using primers allowing to account for allogenicity (i.e., to differentiate between host and tumor xenograft). The following four pairs of cathepsin-specific primers were used: 1) mouse cathepsin B 5′-GGAAGGGTTGCGTTCGGTGAGG; 3′-GCAGGTTCGGTCAGAAATGGC; 2) mouse cathepsin H* 5′-AGCTCGGTGGAGTACAACC; 3′-GCAACAGCTTTTTGGGGGTTGAATC; 3) rat cathepsin B* 5′-GGAAAGGG TTGGGTTCAGCG; 3′-GCAGATTCGGTCAGACATG; 4) rat cathepsin H 5′-CGAGGGAGTACAGCCACAGG; 3′-CGCG ACGGCCTTTTCTGGGTTGAATTTGC. Beta-actin specific primers were used to account for overall levels of mRNA expression and to normalize PCR signals. Primers indicated by an asterisk are 100% species-specific. RT-PCR for beta-actin, mouse and rat cathepsin H, and rat cathepsin B were performed at the following conditions: 50°C-30 minutes, 1 cycle; 94°C-3 minutes, 1 cycle; 94°C-30 seconds, 65°C-45 seconds, 30 cycles; 69°C-1 minute, 69°C-10 minutes, 1 cycle. Annealing temperature for mouse cathepsin B in the reaction was changed to 67°C. PCR products were analyzed by agarose electrophoresis; results were digitized using Kodak CD40 camera (as 16-bit TIFF) and analyzed using IP Lab Spectrum software.
Enzymatic Activity Assay
Tree hundred thousand cells were lysed in 30 µl of 1% Triton X-100, 10 mM DTT, 10 mM potassium acetate, pH 6.0, for 10 minutes and the lysate was added directly to a cuvette containing 460 µl of 0.4 mM N-Cbz-Arg-Arg-7-amino-4-methylcoumarin (Bachem AG, Bubendorf, Switzerland), 0.1 M potassium acetate, 0.05 M NaCl, 20 mM Mes, 1 mM EDTA, pH 6.0. Kinetics of product release (7-amino-4-methylcoumarin) was acquired at λex 320 nm/λem 420 nm. The enzyme activity was determined using initial reaction rate values and converted into enzymatic activity units using cathepsin B (343 U/mg; CN Biosciences, La Jolla, CA) as a standard.
Image Analysis
Eight- or 16-bit TIFF images obtained using a CCD were subjected to segmentation for determining coregistration of GFP and NIRF signal in the same cells within a single confocal slice. Green fluorescence images (GFP fluorescence) were segmented using IP Lab Spectrum software using segment area limitations to account for single cells only. The obtained segment layer was overlaid over a corresponding NIRF image. Fluorescence within segments was then measured and distribution of fluorescence in 10 individual cells was plotted as a histogram.
Results
PGC-Cy5.5 Dequenching In Vitro
Initially, PGC-Cy5.5 probe cleavage was tested in vitro to determine the degree of self-quenching and the ability of proteases to release the fluorescence due to the enzymatic cleavage of the lysine-containing backbone polymer. For PGC-Cy5.5 used in the study, NIRF increased 35 to 40 times after the treatment with trypsin, a model serine protease capable of degrading poly-lysine, or dithiotreitol-activated cathepsin B. The NIRF increase was blocked by 96% to 97% in the presence of specific enzyme inhibitors. Size exclusion HPLC analysis showed a time-dependent decrease of high-molecular-weight PGC-Cy5.5 peak in the presence of trypsin. Control PGC-Cy5.5 with a poly-d-lysine backbone was not cleavable by trypsin or cathepsin B.
Imaging of PGC-Cy5.5 Cleavage in Tumor Xenografts
Animals injected subdermally in the ear with 9L-GFP tumor cells developed 3- to 4-mm tumors within 10 days. Mice received an intravenous injection of self-quenched Cy5.5-labeled PGC probe at 6 or 12 hours prior to imaging. Animals were subjected to macroscopic NIR and GFP fluorescence imaging [18] to colocalize tumor-specific GFP marker expression and NIR fluorescent probe dequenching (Figure 1). All ectopic 9L-GFP tumors showed a strong GFP expression. Dequenching of PGC-Cy5.5 probe was most prominent in larger tumors (with a diameter of 3–4 mm) at 12 hours after injection. Tumor/background signal ratio measured using region-of-interest fluorescence intensity measurements varied between 3 and 4. At the earlier time point (6 hours postinjection), measured NIRF signal never exceeded 1.5-fold over the background signal measured in areas where tumor was absent. Fluorescence was nearly absent in small poorly vascularized tumor nodules within the same ear (Figure 1). Histological examination of excised tumors showed no extensive necrosis.
Figure 1.
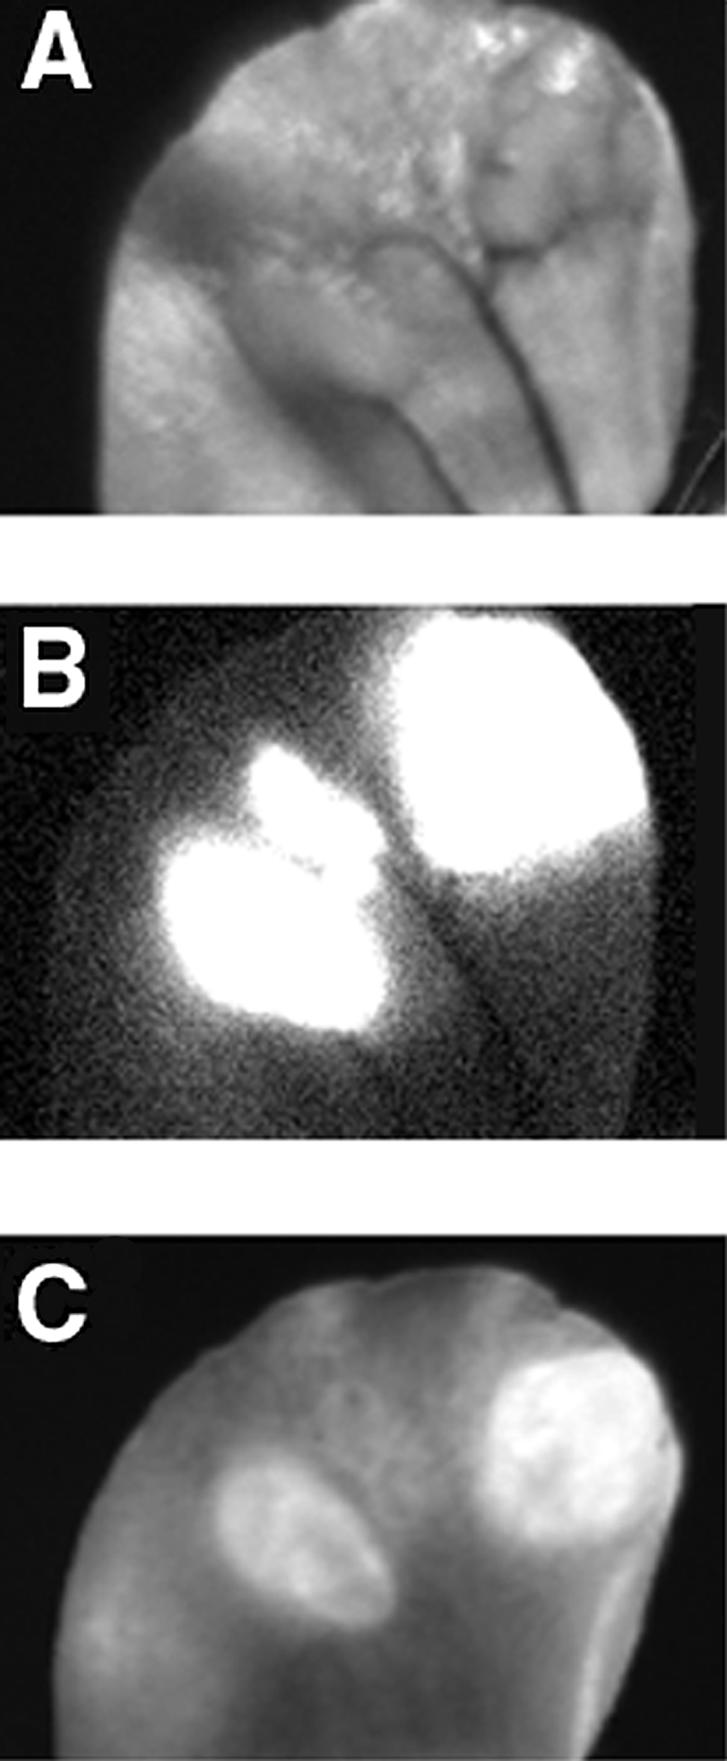
Macroscopic reflectance fluorescent imaging of 9L-GFP gliosarcoma in mouse ear model. (A) Visible light image. (B) Expression of tumor GFP marker protein in tumors. (C) NIRF image demonstrating PGC-Cy5.5 probe cleavage. A total of three individual nodules are visible. Cy5.5 dequenching was observed in two larger tumors.
In Vivo Microscopy
Animals with verified NIRF dequenching were subjected to a transdermal confocal two-photon microscopy using a set-up described in Materials and Methods. In preliminary experiments, a double-stained preparation of cells (WTK1 cells stained with DiD and monobromobimane; Figure 2) was used to verify colocalization of fluorescence using single-photon and double-photon excitation modes in the same optical section. The overlapped image (Figure 2, image C) demonstrated a high degree of coincidence of one- and two-photon fluorescence signals within the same optical section.
Figure 2.

The verification of one- and two-photon colocalization using an in vivo imaging system. WTK1 lymphoblast cells were stained with DiD (A, plasma membrane) and monobromobimane, a GSH-sensitive probe (B, cytoplasm). DiD fluorescence (red) was excited with one photon at 633 nm and monobromobimane fluorescence was excited with two photons at 800 nm. Image (C) shows superimposed images (A) and (B).
In vivo, using a double-channel fluorescence registration, the dequenching of PGC-Cy5.5 could be observed individually in populations of tumor and tumor accessory cells because only gliosarcoma cell cytoplasm fluorescence was excitable in two-photon mode. Both green fluorescent (Figure 3, arrow) and GFP accessory cells demonstrated NIRF dequenching corresponding to cellular endocytotic compartment (Figure 3). At all time points, no NIR fluorescence was detectable within microvessels supplying tumors. The imaging of tumor cells in subdermal tissue layers showed that near-infrared signal was detectable at 6 hours postintravenous administration 20 to 100 µm deep from the skin surface. At 12 hours, NIR fluorescence appeared significantly brighter and the dequenching could be observed in deeper layers of tissue (up to 160 µm). Generally, at this time point, few GFP-positive cells had NIR fluorescence. Merged images showed coregistration of both fluorescent labels in some GFP-positive cells (arrow, yellow signal). The majority of cells showing the most prominent NIR fluorescence (i.e., dequenching of Cy5.5 label) were GFP-negative. Image segmentation analysis performed using eight images obtained in three animals in two independent experiments showed the presence of different NIRF-positive cell populations in tumors including a low-fluorescent cell population (73% of total GFP-positive cells; fluorescence intensity <55 AU) and a high-fluorescent cell population (7% of GFP positive cells; fluorescence intensity >100 AU) (Figure 4).
Figure 3.

Confocal in vivo microscopy of 9L-GFP tumor after PGC-Cy5.5 intravenous injection. The images are superimposed GFP fluorescence (green, two-photon mode excitation) and Cy5.5 NIRF (red, single-photon excitation). The images were acquired at the different depths (0–160 µm from the skin surface) shown in the lower right corner. The arrow points to GFP-positive cells showing a strong Cy5.5 NIRF signal (yellow on superimposed image, 100 µm).
Figure 4.

Confocal microscopy image analysis showing the distribution of NIRF in GFP-positive cell population (a total of 156 cells) within a confocal slice (n=4). Fluorescence intensities were determined after image segmentation and analysis as described in Materials and Methods.
Analysis of Isolated Tumor Cell Populations
To corroborate observations made using confocal microscopy in subdermal tumor tissue layers with the whole tumor cell FACS analysis, tumors were resected and individual tumor cells were isolated using a collagenase/hyaluronidase treatment. Fluorescence of isolated cells was then analyzed using flow cytometry (Figure 5). Both green fluorescent (81% total) and nonfluorescent cells (19% total) were also fluorescent in the far-red wavelength range (FL4 channel). A subfraction of GFP-negative cells (2.5–3%) showed a significantly higher NIRF intensity — 370 AU — compared to fluorescence intensity of 55 AU (CV 30–33%) measured in the majority of cells of GFP-positive or GFP-negative cells (Figure 5). The fractions of GFP-negative (mouse host) and GFP-positive (rat gliosarcoma) cells were isolated using fluorescence-activated sorting and subjected to RT-PCR analysis for the purpose of: 1) performing comparative analysis of cathepsin B and H expression in these subfractions; and 2) determining whether the GFP-negative and GFP-positive fractions corresponded to mouse stromal and rat gliosarcoma cells. The latter experiment can reveal a potential cross-contamination and determine potential loss of GFP marker by rat 9L-GFP cells in vivo. An RT-PCR analysis using highly species-specific primer set for rat cathepsin B showed the absence of rat mRNA in GFP-negative cells (Figure 6; lanes1 and 2; Table 1). Mouse cathepsin B mRNA gave a strong specific signal after the amplification (Table 1). The ratio of PCR signals (normalized by β-actin signal) for cathepsin B in mouse cells to rat cathepsin B was equal to 3.5. To compare the expression levels of catalytically active enzyme in both cell types, we performed enzyme activity measurements using lysates prepared from FACS-sorted cells and cathepsin B-specific substrate. The measured enzyme activity in mouse was 3.6 times higher than in tumor rat cells, suggesting a good correlation with RT-PCR data (Table 1). Interestingly, cathepsin H mRNA expression was higher in rat 9L cells than in the stromal mouse cells, and the level of expression of this enzyme was higher in rat cells than that of cathepsin B.
Figure 5.

Flow cytometry analysis of cells isolated from 9L-GFP tumors (A,B) obtained from animals injected with PGC-Cy5.5, 24 hours before cell harvesting. (A) A histogram showing fluorescence intensity of GFP-positive and GFP-negative cell populations. (B) Cy5/GFP dot graph showing subpopulations of highly positive cells in upper left (shown in a square window) and right quadrants.
Figure 6.

NIRF microscopy of cells isolated from 9L-GFP tumors. (A) GFP. (B) NIRF. (C) Merged images. A GFP-negative, highly NIRF-positive cell with a large NIRF intracellular compartment is indicated by an arrow.
Table 1.
Analysis of Cathepsin B and H Expression in Cells Isolated from 9L-GFP Tumor Xenograft.*
| Cell Type | Primer Specificity | Amplified Fragment Size (bp) | Normalized Signal Intensity | Specific Cathepsin B Activity (U/ml cells)* |
| GFP-positive | Rat cathepsin B | 162 | 101.8 | 0.015 |
| Rat cathepsin H | 529 | 143.5 | ||
| Mouse cathepsin B** | 160 | 117.2 | ||
| Mouse cathepsin H | 532 | 14.1 | ||
| GFP-negative | Rat cathepsin B | 162 | 5.8 | 0.058 |
| Rat cathepsin H | 529 | 7.6 | ||
| Mouse cathepsin B** | 160 | 354.3 | ||
| Mouse cathepsin H | 532 | 44.8 | ||
Specific activity was determined using a fluorescent substrate as described in Materials and Methods.
Primers specific for mouse cathepsin B are not species-specific.
As determined by flow cytometry, cells with high NIRF were CD45-positive and macrophage differentiation antigen (MAC3)-positive, but VCAM-1- and CD31-negative (Table 2). Microscopic examination of tumor-isolated cells showed that with NIRF, dequenching activity was present in both tumor cells and GFP-negative cells (Figure 7, A – C). The cells with no detectable GFP fluorescence (Figure 7, A and B, arrow) had large NIR fluorescent compartment and appeared significantly brighter than GFP-positive tumor cells.
Table 2.
Identification of Cell Subpopulations in 9L-GFP Tumor Isolates Using Cell Surface Markers.
| Primary Antibody* | GFP-Negative Cells (19% Total) | GFP-Positive Cells (9L-GFP) | ||
| % Total Cell Number | % Highly NIRF-Positive Cells** | % Total Cell Number | % Highly NIRF-Positive Cells** | |
| CD31 | 0.52 | 0 | 0.1 | 0 |
| CD45 | 3.3±0.4 | 50 | 0.9±0.1 | 30 |
| CD62E | 0.2 | 0 | 0.1 | 0 |
| CD106 | 2.3±0.2 | 0 | 0.9±0.1 | 4 |
| MAC3 | 5.5±0.5 | 80 | 1.2±0.4 | 50 |
| Control | 0.1 | 0 | 0 | 0 |
Cells were fixed, FcR-blocked, and treated with primary antibody (1:50 diluted) followed by anti-rat IgG2a-phycoerythrin (1:50 dilution).
Percent of cell in the population with FL4 (far-red channel) fluorescence higher than 100 AU.
Figure 7.

RT-PCR analysis of total RNA isolated from GFP-(lanes 1, 3, 5, 7, 9) and GFP-negative cells (lanes 2, 4, 6, 8, 10). cDNA was amplified using primers specific for: 1) rat cathepsin B (lanes 1 and 2); 2) rat cathepsin H (lanes 3 and 4); 3) beta-actin (lanes 5 and 6); 4) mouse cathepsin B (lanes 7 and 8); mouse cathepsin H (lanes 9 and 10). S, standards.
Discussion
Tumor-associated proteases have received much attention as potential targets for therapeutic and imaging drugs within tumor microenvironments. The role of proteases in tumor progression, invasion, migration, angiogenesis, and metastasis has been subjected to extensive research (reviewed in). Specifically, protease expression and resultant extracellular matrix remodeling are regulated by complex interactions between extracellular matrix components and cells populating the tumor, including mesenchymal and hematopoetic stromal cells [38]. Recent development of biocompatible, enzyme-specific reporter probes afforded in vivo sensing of specific proteolytic activity useful for tumor detection [1], transgene imaging [19], and efficacy testing of MMP-2 inhibitors [20]. Detection of proteolytic activity using PGC-enhanced fluorescent imaging allowed to differentiate between normal and neoplastic tissue in vivo [1,18,39]. The explanation of underlying phenomenon is in the sequence of events preceding catalytic release of NIRF self-quenched fluorophores. Tumor vessels supplying proliferating neoplastic tissue with nutrients are known to have much higher endothelial permeability than normal blood vessels [40–42]. Furthermore, tumor interstitial volume is higher than in normal tissues [43,44]. These factors act synergistically, resulting in a “passive” accumulation of graft copolymers in tumors [24,45]. The tumoral accumulation (3–5% of injected dose per gram of tissue [45]) is, in part, due to the ability of macromolecules to circulate for long periods of time (T1/2=20–30 hours [26]) and resultant persistence of concentration gradient across tumor endothelium. Cells comprising the tumor mass subsequently internalize a fraction of PGC-Cy5.5 that accumulated in the interstitial compartment. Tumor cells are capable of active pinocytosis of a variety of macromolecules and colloids in vivo and in vitro [46,47]. For example, we previously reported the effect of tumor cell endocytosis of dextrancoated iron oxide nanoparticles that are internalized in tumor cells through fluid uptake pathway [48]. However, tumors harbor numerous tumor-recruited and stromal cells supplying the tumor with growth factors and participating in extracellular matrix remodeling (reviewed in Ref. [49–51]).
Monocytes, resident macrophages, and dendritic cells that may infiltrate the tumor may exhibit a very high level of solute internalization due to macropinocytosis [52,53]. Due to a high proteolytic activity in endocytotic compartment of phagocytic cells, the input of these cells in the total tumoral solute uptake can be substantial. The propensity of growing tumors to attract nontumor cells may vary considerably and depends on local secretion of chemokines [54] as well as on the tumor cell apoptosis rate. Therefore, we set forth to investigate whether tumor-recruited cells might have a role in previously observed NIRF dequenching in vivo [1]. A recently described multiphoton intravital laser scanning microscopy (MPLSM) [55] is a powerful in vivo technique allowing for real-time imaging of cells in vivo in natural microenvironment. In our work, we used a similar approach. A custom-built microscopy set-up allowed confocal and two-photon fluorescence microscopy of tumor cells using a direct transdermal illumination of the tumor. A significant advantage of the system is in that it does not require any additional tissue perturbation (e.g., glass window implantation). With high resolution, we successfully imaged tumor cells proliferating in subdermal tissue layers (20–160 µm deep from the skin surface; Figure 3). Remarkably, these imaging experiments suggested that the strongest NIRF signal resulting from Cy5.5 dequenching originated in GFP-negative cells (Figures 3 – 5). The validity of this observation was tested using flow cytometry of cell preparations isolated from tumors. Flow cytometry showed that both GFP-positive and GFP-negative populations contained predominantly Cy5.5-positive cells (Figure 5). However, a minor fraction of GFP-negative cells (2.5–3.0% total) showed a seven-times-higher fluorescence intensity than the majority of GFP-positive or GFP-negative cells. This observation confirms microscopy data indicating that GFP-negative subpopulation of cells contains a higher fraction of cells that degrade PGC-Cy5.5 and release NIR fluorescent signal if compared to GFP-positive tumor cells. The fraction of GFP-negative cells consisted almost exclusively of host (mouse) cells, which was proven by RT-PCR analysis using primers specific for rat or mouse cathepsin mRNA (Figure 6, Table 1). Direct measurement of enzymatic activity in GFP-negative cells and GFP-positive 9L cells sorted from tumor tissue also indicated that enzymatic activity of cathepsin B was higher in stromal cells than in gliosarcoma cell population (Table 1). The majority of highly NIRF-positive, GFP-negative cells were CD45- and MAC3-positive (Table 2) and contained brightly fluorescent intracellular vesicles (Figure 7), suggesting that optical imaging probe was actively degraded by monocyte/macrophage/dendritic cell populations residing in the tumor.
In conclusion, we demonstrated that noninvasive confocal and two-photon microscopy could be used as imaging modality for investigating physiology of peripherally located tumors at the cellular level in intact animals. Our data indicate that tumor-associated proteolysis can be imaged in vivo on the cellular level during tumor progression. The further progress in novel probe design would allow elucidation of the role of individual cell populations in tumor growth as well as the function of cellular proteases during cancer progression.
Acknowledgements
The authors acknowledge Doug Olson for helping with fluorescence-activated cell sorting, Anna Moore for providing 9L-GFP cells for this study, Alexander Petrovsky for help with animal models, Hye Won Kang for assistance with tumor cell isolation, and Jennifer Allport-Anderson for the advice regarding the antibody use.
Abbreviations
- GFP
green fluorescent protein
- NIRF
near-infrared fluorescence
- PGC
protected graft copolymer
References
- 1.Weissleder R, Tung CH, Mahmood U, Bogdanov A., Jr In vivo imaging of tumors with protease-activated near-infrared fluorescent probes. Nat Biotechnol. 1999;17:375–378. doi: 10.1038/7933. [DOI] [PubMed] [Google Scholar]
- 2.Chishima T, Miyagi Y, Wang X, Yamaoka H, Shimada H, Moossa AR, Hoffman RM. Cancer invasion and micrometastasis visualized in live tissue by green fluorescent protein expression. Cancer Res. 1997;57:2042–2047. [PubMed] [Google Scholar]
- 3.Moore A, Marecos E, Simonova M, Weissleder R, Bogdanov AJ. Novel gliosarcoma cell line expressing green fluorescent protein: a model for quantitative assessment of angiogenesis. Microvasc Res. 1998;56:145–153. doi: 10.1006/mvre.1998.2102. [DOI] [PubMed] [Google Scholar]
- 4.Fukumura D, Xavier R, Sugiura T, Chen Y, Parks EC, Lu N, Selig M, Nielson G, Taksir T, Jain RK, Seed B. Tumor induction of VEGF promoter activity in stromal cells. Cell. 1998;94:715–725. doi: 10.1016/s0092-8674(00)81731-6. [DOI] [PubMed] [Google Scholar]
- 5.Yang M, Baranov E, Li XM, Wang JW, Jiang P, Li L, Moossa AR, Penman S, Hoffman RM. Whole-body and intravital optical imaging of angiogenesis in orthotopically implanted tumors. Proc Natl Acad Sci USA. 2001;98:2616–2621. doi: 10.1073/pnas.051626698. [DOI] [PMC free article] [PubMed] [Google Scholar]
- 6.Edinger M, Sweeney TJ, Tucker AA, Olomu AB, Negrin RS, Contag CH. Noninvasive assessment of tumor cell proliferation in animal models. Neoplasia. 1999;1:303–310. doi: 10.1038/sj.neo.7900048. [DOI] [PMC free article] [PubMed] [Google Scholar]
- 7.Sakatani K, Kashiwasake-Jibu M, Taka Y, Wang S, Zuo H, Yamamoto K, Shimizu K. Noninvasive optical imaging of the subarachnoid space and cerebrospinal fluid pathways based on near-infrared fluorescence. J Neurosurg. 1997;87:738–745. doi: 10.3171/jns.1997.87.5.0738. [DOI] [PubMed] [Google Scholar]
- 8.Licha K, Riefke B, Ntziachristos V, Becker A, Chance B, Semmler W. Hydrophilic cyanine dyes as contrast agents for near-infrared tumor imaging: synthesis, photophysical properties and spectroscopic in vivo characterization. Photochem Photobiol. 2000;72:392–398. doi: 10.1562/0031-8655(2000)072<0392:hcdaca>2.0.co;2. [DOI] [PubMed] [Google Scholar]
- 9.Becker A, Riefke B, Ebert B, Sukowski U, Rinneberg H, Semmler W, Licha K. Macromolecular contrast agents for optical imaging of tumors: comparison of indotricarbocyanine-labeled human serum albumin and transferrin. Photochem Photobiol. 2000;72:234–241. doi: 10.1562/0031-8655(2000)072<0234:mcafoi>2.0.co;2. [DOI] [PubMed] [Google Scholar]
- 10.Ntziachristos V, Yodh AG, Schnall M, Chance B. Concurrent MRI and diffuse optical tomography of breast after indocyanine green enhancement. Proc Natl Acad Sci USA. 2000;97:2767–2772. doi: 10.1073/pnas.040570597. [DOI] [PMC free article] [PubMed] [Google Scholar]
- 11.Hawrysz D, Sevick-Muraca E. Developments toward diagnostic breast cancer imaging using near-infrared optical measurements and fluorescent contrast agents. Neoplasia. 2000;2:388–417. doi: 10.1038/sj.neo.7900118. [DOI] [PMC free article] [PubMed] [Google Scholar]
- 12.Tromberg B, Shah N, Lanning R, Cerussi A, Espinoza J, Pham T, Svaasand L, Butler J. Non-invasive in vivo characterization of breast tumors using photon migration spectroscopy. Neoplasia. 2000;2:26–40. doi: 10.1038/sj.neo.7900082. [DOI] [PMC free article] [PubMed] [Google Scholar]
- 13.Gaudette RJ, Brooks DH, DiMarzio CA, Kilmer ME, Miller EL, Gaudette T, Boas DA. A comparison study of linear reconstruction techniques for diffuse optical tomographic imaging of absorption coefficient. Phys Med Biol. 2000;45:1051–1070. doi: 10.1088/0031-9155/45/4/318. [DOI] [PubMed] [Google Scholar]
- 14.Holboke MJ, Tromberg BJ, Li X, Shah N, Fishkin J, Kidney D, Butler J, Chance B, Yodh AG. Three-dimensional diffuse optical mammography with ultrasound localization in a human subject. J Biomed Opt. 2000;5:237–247. doi: 10.1117/1.429992. [DOI] [PubMed] [Google Scholar]
- 15.Neri D, Carnemolla B, Nissim A, Leprini A, Querze G, Balza E, Pini A, Tarli L, Halin C, Neri P, Zardi L, Winter G. Targeting by affinity-matured recombinant antibody fragments of an angiogenesis associated fibronectin isoform. Nat Biotechnol. 1997;15:1271–1275. doi: 10.1038/nbt1197-1271. [DOI] [PubMed] [Google Scholar]
- 16.Becker A, Hessenius C, Licha K, Ebert B, Sukowski U, Semmler W, Wiedenmann B, Grotzinger C. Receptor-targeted optical imaging of tumors with near-infrared fluorescent ligands. Nat Biotechnol. 2001;19:327–331. doi: 10.1038/86707. [DOI] [PubMed] [Google Scholar]
- 17.Bugaj JE, Achilefu S, Dorshow RB, Rajagopalan R. Novel fluorescent contrast agents for optical imaging of in vivo tumors based on a receptor-targeted dye-peptide conjugate platform. J Biomed Opt. 2001;6:122–133. doi: 10.1117/1.1352748. [DOI] [PubMed] [Google Scholar]
- 18.Mahmood U, Tung CH, Bogdanov A, Jr, Weissleder R. Near-infrared optical imaging of protease activity for tumor detection. Radiology. 1999;213:866–870. doi: 10.1148/radiology.213.3.r99dc14866. [DOI] [PubMed] [Google Scholar]
- 19.Tung CH, Mahmood U, Bredow S, Weissleder R. In vivo imaging of proteolytic enzyme activity using a novel molecular reporter. Cancer Res. 2000;60:4953–4958. [PubMed] [Google Scholar]
- 20.Bremer C, Tung CH, Weissleder R. In vivo molecular target assessment of matrix metalloproteinase inhibition. Nat Med. 2001;7:743–748. doi: 10.1038/89126. see comments. [DOI] [PubMed] [Google Scholar]
- 21.Dubertret B, Calame M, Libchaber AJ. Single-mismatch detection using gold-quenched fluorescent oligonucleotides. Nat Biotechnol. 2001;19:365–370. doi: 10.1038/86762. [DOI] [PubMed] [Google Scholar]
- 22.Marras SA, Kramer FR, Tyagi S. Multiplex detection of single-nucleotide variations using molecular beacons. Genet Anal. 1999;14:151–156. doi: 10.1016/s1050-3862(98)00018-7. [DOI] [PubMed] [Google Scholar]
- 23.Callahan RJ, Bogdanov A, Jr, Fischman AJ, Brady TJ, Weissleder R. Preclinical evaluation and phase I clinical trial of a 99mTc-labeled synthetic polymer used in blood pool imaging. AJR, Am J Roentgenol. 1998;171:137–143. doi: 10.2214/ajr.171.1.9648777. [DOI] [PubMed] [Google Scholar]
- 24.Bogdanov AA, Jr, Martin C, Bogdanova AV, Brady TJ, Weissleder R. An adduct of cis-diamminedichloroplatinum(II) and poly(ethylene glycol)poly(L-lysine)-succinate: synthesis and cytotoxic properties. Bioconjgate Chem. 1996;7:144–149. doi: 10.1021/bc950089b. [DOI] [PubMed] [Google Scholar]
- 25.Marecos E, Weissleder R, Bogdanov A., Jr Antibody-mediated versus nontargeted delivery in a human small cell lung carcinoma model. Bioconjugate Chem. 1998;9:184–191. doi: 10.1021/bc970146w. [DOI] [PubMed] [Google Scholar]
- 26.Bogdanov AA, Jr, Weissleder R, Frank HW, Bogdanova AV, Nossif N, Schaffer BK, Tsai E, Papisov MI, Brady TJ. A new macromolecule as a contrast agent for MR angiography: preparation, properties, and animal studies. Radiology. 1993;187:701–706. doi: 10.1148/radiology.187.3.8497616. [DOI] [PubMed] [Google Scholar]
- 27.Bremer C, Tung C, Bogdanov A, Moore A, Weissleder R. Imaging of differential protease expression in breast cancers for detection of aggressive tumor phenotypes. Radiology. 2001 doi: 10.1148/radiol.2223010812. (in press) [DOI] [PubMed] [Google Scholar]
- 28.Marten K, Bremer C, Khazaie K, Tung C, Weissleder R. Detection of dysplastic intestinal adenomas using enzyme sensing molecular beacons. Gastroenterology. 2002;122:406–414. doi: 10.1053/gast.2002.30990. [DOI] [PubMed] [Google Scholar]
- 29.Crawford HC, Matrisian LM. Tumor and stromal expression of matrix metalloproteinases and their role in tumor progression. Invasion Metastasis. 1994;14:234–245. [PubMed] [Google Scholar]
- 30.Nelson AR, Fingleton B, Rothenberg ML, Matrisian LM. Matrix metalloproteinases: biologic activity and clinical implications. J Clin Oncol. 2000;18:1135–1149. doi: 10.1200/JCO.2000.18.5.1135. [DOI] [PubMed] [Google Scholar]
- 31.Sloane BF, Dunn JR, Honn KV. Lysosomal cathepsin B: correlation with metastatic potential. Science. 1981;212:1151–1153. doi: 10.1126/science.7233209. [DOI] [PubMed] [Google Scholar]
- 32.Moin K, Demchik L, Mai J, Duessing J, Peters C, Sloane BF. Observing proteases in living cells. Adv Exp Med Biol. 2000;477:391–401. doi: 10.1007/0-306-46826-3_40. [DOI] [PubMed] [Google Scholar]
- 33.Wheeler K, Tel N, Williams M, Sheppard S, Levin V, Kabra P. Factors influencing the survival of rat brain tumor cells after in vitro treatment with 1,3-bis(2-chloroethyl)-1-nitrosourea. Cancer Res. 1975;35:1464–1469. [PubMed] [Google Scholar]
- 34.Rajadhyaksha M, Anderson R, Webb R. Video-rate confocal scanning laser microscope for imaging human tissues in vivo. Appl Opt. 1999;38:2105–2115. doi: 10.1364/ao.38.002105. [DOI] [PubMed] [Google Scholar]
- 35.Koblinski JE, Ahram M, Sloane BF. Unraveling the role of proteases in cancer. Clin Chim Acta. 2000;291:113–135. doi: 10.1016/s0009-8981(99)00224-7. [DOI] [PubMed] [Google Scholar]
- 36.Dano K, Romer J, Nielsen BS, Bjorn S, Pyke C, Rygaard J, Lund LR. Cancer invasion and tissue remodeling — cooperation of protease systems and cell types. APMIS. 1999;107:120–127. doi: 10.1111/j.1699-0463.1999.tb01534.x. [DOI] [PubMed] [Google Scholar]
- 37.DeClerck YA, Imren S, Montgomery AM, Mueller BM, Reisfeld RA, Laug WE. Proteases and protease inhibitors in tumor progression. Adv Exp Med Biol. 1997;425:89–97. doi: 10.1007/978-1-4615-5391-5_9. [DOI] [PubMed] [Google Scholar]
- 38.Stetler-Stevenson WG, Aznavoorian S, Liotta LA. Tumor cell interactions with the extracellular matrix during invasion and metastasis. Annu Rev Cell Biol. 1993;9:541–573. doi: 10.1146/annurev.cb.09.110193.002545. [DOI] [PubMed] [Google Scholar]
- 39.Tung CH, Bredow S, Mahmood U, Weissleder R. Preparation of a cathepsin D sensitive near-infrared fluorescence probe for imaging. Bioconjugate Chem. 1999;10:892–896. doi: 10.1021/bc990052h. [DOI] [PubMed] [Google Scholar]
- 40.Kohn S, Nagy JA, Dvorak HF, Dvorak AM. Pathways of macromolecular tracer transport across venules and small veins. Structural basis for the hyperpermeability of tumor blood vessels. Lab Invest. 1992;67:596–607. [PubMed] [Google Scholar]
- 41.Feng D, Nagy JA, Dvorak AM, Dvorak HF. Different pathways of macromolecule extravasation from hyperpermeable tumor vessels. Microvasc Res. 2000;59:24–37. doi: 10.1006/mvre.1999.2207. [DOI] [PubMed] [Google Scholar]
- 42.Netti PA, Hamberg LM, Babich JW, Kierstead D, Graham W, Hunter GJ, Wolf GL, Fischman A, Boucher Y, Jain RK. Enhancement of fluid filtration across tumor vessels: implication for delivery of macromolecules. Proc Natl Acad Sci USA. 1999;96:3137–3142. doi: 10.1073/pnas.96.6.3137. [DOI] [PMC free article] [PubMed] [Google Scholar]
- 43.Jain R. Delivery of molecular medicine to solid tumors. Science. 1996;271:1079–1080. doi: 10.1126/science.271.5252.1079. [DOI] [PubMed] [Google Scholar]
- 44.Jain R. Vascular and interstitial barriers to delivery of therapeutic agents in tumors. Cancer Metastasis Rev. 1990;9:253–266. doi: 10.1007/BF00046364. [DOI] [PubMed] [Google Scholar]
- 45.Bogdanov A, Jr, Wright SC, Marecos EM, Bogdanova A, Martin C, Petherick P, Weissleder R. A long-circulating co-polymer in “passive targeting” to solid tumors. J Drug Target. 1997;4:321–330. doi: 10.3109/10611869708995848. [DOI] [PubMed] [Google Scholar]
- 46.Mohler J, Sharief Y. Flow cytometric assay of pinocytosis: correlation with membrane ruffling and metastatic potential in the Dunning R-3327 rat prostatic adenocarcinoma model. Cytometry. 1993;14:826–831. doi: 10.1002/cyto.990140716. [DOI] [PubMed] [Google Scholar]
- 47.Veithen A, Cupers P, Baudhuin P, Courtoy PJ. v-Src induces constitutive macropinocytosis in rat fibroblasts. J Cell Sci. 1996;109:2005–2012. doi: 10.1242/jcs.109.8.2005. [DOI] [PubMed] [Google Scholar]
- 48.Moore A, Marecos E, Bogdanov A, Jr, Weissleder R. Tumoral distribution of long-circulating dextran-coated iron oxide nanoparticles in a rodent model. Radiology. 2000;214:568–574. doi: 10.1148/radiology.214.2.r00fe19568. [DOI] [PubMed] [Google Scholar]
- 49.Basset P, Okada A, Chenard MP, Kannan R, Stoll I, Anglard P, Bellocq JP, Rio MC. Matrix metalloproteinases as stromal effectors of human carcinoma progression: therapeutic implications. Matrix Biol. 1997;15:535–541. doi: 10.1016/s0945-053x(97)90028-7. [DOI] [PubMed] [Google Scholar]
- 50.Ono M, Torisu H, Fukushi J, Nishie A, Kuwano M. Biological implications of macrophage infiltration in human tumor angiogenesis. Cancer Chemother Pharmacol. 1999;43(Supplement):S69–S71. doi: 10.1007/s002800051101. [DOI] [PubMed] [Google Scholar]
- 51.Shapiro SD. Diverse roles of macrophage matrix metalloproteinases in tissue destruction and tumor growth. Thromb Haemostasis. 1999;82:846–849. [PubMed] [Google Scholar]
- 52.Racoosin EL, Swanson JA. Macrophage colony-stimulating factor (rM-CSF) stimulates pinocytosis in bone marrow-derived macrophages. J Exp Med. 1989;170:1635–1648. doi: 10.1084/jem.170.5.1635. [DOI] [PMC free article] [PubMed] [Google Scholar]
- 53.Racoosin EL, Swanson JA. Macropinosome maturation and fusion with tubular lysosomes in macrophages. J Cell Biol. 1993;121:1011–1020. doi: 10.1083/jcb.121.5.1011. [DOI] [PMC free article] [PubMed] [Google Scholar]
- 54.Fukumura D, Xavier R, Suguira T, Chen Y, Parks EC, Lu N, Selig M, Nielson G, Taksir T, Jain RK, Seed B. Tumor induction of VEGF promoter activity in stromal cells. Cell. 1998;94:715–725. doi: 10.1016/s0092-8674(00)81731-6. [DOI] [PubMed] [Google Scholar]
- 55.Brown EB, Campbell RB, Tsuzuki Y, Xu L, Carmeliet P, Fukumura D, Jain RK. In vivo measurement of gene expression, angiogenesis and physiological function in tumors using multiphoton laser scanning microscopy. Nat Med. 2001;7:864–868. doi: 10.1038/89997. [DOI] [PubMed] [Google Scholar]