Abstract
PURPOSE
To investigate prospectively the feasibility of using optical tomography with ultrasonographic (US) localization to differentiate malignant from benign breast masses and to compare optical tomography with color Doppler US.
MATERIALS AND METHODS
The study was approved by the local internal review board committee and by the Human Subjects Research Review Board of Army Medical Research and Materiel Command. Signed informed consent was obtained, and the study was HIPAA compliant. Between May 2003 and March 2004, 65 consecutive women (mean age, 51 years; age range, 24–80 years) with 81 breast lesions underwent US-guided biopsy and were scanned with a combined imager. The hand-held probe, which consisted of a centrally located US transducer surrounded by near-infrared sensors, was used to simultaneously acquire coregistered US images and optical data. The lesion location obtained at US was used to guide optical imaging reconstruction. Light absorption was measured at two wavelengths. From these measurements, tumor angiogenesis was assessed on the basis of calculated total hemoglobin concentration. A Student t distribution was used to calculate the statistical significance of mean maximum and mean average hemoglobin concentrations obtained in malignant and benign lesion groups, and P < .001 was considered to indicate a statistically significant difference.
RESULTS
Biopsy results revealed eight early stage invasive carcinomas (malignant group) and 73 benign lesions (benign group). The mean maximum and mean average hemoglobin concentrations in the malignant group were 122 μmol/L ± 26.8 (± standard deviation) and 88 μmol/L ± 24.5, respectively. The mean maximum and mean average hemoglobin concentrations in the benign group were 55 μmol/L ± 24.8 and 38 μmol/L ± 17.4, respectively. Both the maximum and average total hemoglobin concentrations were significantly higher in the malignant group compared with the benign group (P < .001). When a maximum hemoglobin concentration of 95 μmol/L was used as the threshold value, the sensitivity, specificity, positive predictive value, and negative predictive value of optical tomography were 100%, 96%, 73%, and 100%, respectively, and the sensitivity, specificity, positive predictive value, and negative predictive value of color Doppler US were 63%, 69%, 19%, and 94%, respectively.
CONCLUSION
Findings indicate that optical tomography with US localization is feasible for differentiating benign and early stage malignant breast lesions.
Abbreviation: FWHM = full width at half maximum
Large numbers of breast biopsies are performed that yield benign results (1). The use of ultrasonography (US) as an adjunct to conventional mammography decreases the number of benign biopsy results by enabling reliable differentiation of simple cysts from solid lesions (2–4). The US features of a solid lesion alone, however, are frequently not reliable enough to obviate biopsy (5,6).
Tumor angiogenesis is known to be critical for the autonomous growth and spread of breast cancers (7,8). Tumor angiogenesis is a complex process that involves both the incorporation of existing host blood vessels into the tumor and the creation of tumor microvessels. This process is moderated by means of tumor angiogenesis factors (9). In principle, the altered hemodynamics that accompany tumor angiogenesis provide a basis for discriminating between malignant and benign breast masses at color Doppler US (10). The diagnostic value of color Doppler US in obviating biopsy, however, has been limited (11,12).
Optical tomography, a new technique that employs diffused light in the near-infrared spectrum, provides functional images of tumor angiogenesis and tumor hypoxia. This technique has recently been investigated in several clinical pilot studies (13–19). When a single optical wavelength is used, the optical absorption, which is related to tumor angiogenesis, can be measured. When multiple appropriately selected wavelengths are used, the optical absorptions at these wavelengths can be measured, and the proportions of oxyhemoglobin and deoxyhemoglobin can be calculated. Total hemoglobin concentration and tumor hypoxia can be calculated from oxyhemoglobin and deoxyhemoglobin distributions, which are highly correlated with lesion malignancy (20). Because the intense scattering that is caused by the tissue limits the imaging resolution and lesion localization, optical tomography has not been widely used in clinical studies. Coregistration of optical tomography with US or magnetic resonance (MR) imaging has shown promise in overcoming these problems (17,19,21). The use of a flexible light guide that consists of optical fibers makes optical imaging compatible with many other imaging modalities and allows for simultaneous imaging with identical geometric conditions. Information on lesion structure that is provided by other modalities can be used to assist optical imaging reconstruction and thereby reduce location uncertainty and improve the quantification accuracy of light.
A prior study on optical tomography demonstrated that, by using the a priori information on lesion location provided by coregistered US, the total hemoglobin concentration in two early stage invasive cancers was twofold higher than that of a small group of benign lesions (19). Thus, the purpose of our study was to investigate prospectively the feasibility of using optical tomography with US localization to differentiate malignant from benign breast masses and to compare optical tomography with color Doppler US.
MATERIALS AND METHODS
Patients and US
The study protocol was approved by the local internal review board committee and by the Human Subjects Research Review Board of Army Medical Research and Materiel Command. Signed informed consent was obtained from all patients. The study was compliant with the Health Insurance Portability and Accountability Act. From May 2003 to March 2004, eligible patients were initially referred for US-guided biopsy, and the lesions were identified with US at the time of the study. Patients with lesions that were not visible at US were not studied. Three such patients, however, were included in the study because the location of the lesions was well estimated at either conventional mammography or MR imaging by one of the authors (E.B.C., A.A.C., or H.S.V.). The final study group consisted of 65 consecutive women (mean age, 51 years; age range, 24–80 years) with 81 lesions. Eight additional patients were excluded from the final study group. One patient did not have a lesion that was visible at US after careful examination, and the optical data of two patients were not recorded appropriately owing to equipment failure. Two patients had lesions that were located close to dark nipples, and optical images showed nipple artifacts located at nipple-shadowing positions seen at US. Three patients had small dense breasts, and the poor probe-to-tissue contact produced image artifacts.
US examinations were performed with spatial image compounding and a 15-MHz linear transducer (15L8 Sequoia; Acuson, Mountain View, Calif). On the basis of US, conventional mammographic, and/or MR imaging findings, one of the authors (E.B.C., A.A.C., or H.S.V., all certified radiologists with 6–20 years experience in US of the breast) scored each lesion before biopsy by using the Breast Imaging Reporting and Data System, or BI-RADS, classification. Category 1 lesions were classified as normal, category 2 as benign, category 3 as probably benign, category 4 as suspicious for malignancy, and category 5 as highly suspicious for malignancy. For color Doppler US measurements, any persistent color Doppler signals were considered to represent blood vessels. The location of the vessels with respect to the lesion was documented as either peripheral to the lesion, inside the lesion, or both.
Near-Infrared System and Optical Imaging Method
The hand-held hybrid probe consisted of a commercially available US transducer, which was located in the middle of the probe, and near-infrared source-detector light guides (optical fibers), which were distributed at the periphery of the probe (Fig 1). The technical aspects of the near-infrared imager have been previously described in detail (22). Briefly, the imager consisted of 12 pairs of dual wavelength (780-nm and 830-nm) laser diodes that were used as light sources, and the outputs of the diodes were coupled to the probe through optical fibers. On the receiving side, eight photomultiplier tubes were used to detect diffusely scattered light from the tissue, and eight optical fibers were used to couple the detected light to the photomultiplier tubes. The outputs of the laser diodes were amplitude modulated at 140 MHz, and the detector outputs were demodulated to 20 kHz. Eight detection signals and one reference signal were simultaneously amplified, sampled, and acquired into a personal computer (Dimension XPS B800; Dell, Round Rock, Tex). The entire data acquisition took about 3–4 seconds, which was fast enough to obtain data from all patients. For each patient, US images and optical measurements were simultaneously acquired before biopsy, which was performed at multiple locations, including the lesion site, a normal symmetric region of the affected breast, and a normal region of the contralateral breast in the same quadrant as the lesion. Two normal areas—that is, one area of the affected breast and one area of the contralateral breast—were chosen to ensure that one of the normal areas could provide a better reference for tissue homogeneity. The final reference data set was selected on the basis of the linear fitting result of the received amplitude and phase profiles. The scattered field that was used for optical imaging reconstruction was calculated as the difference between measurements obtained at the lesion site and those obtained at the reference site.
Figure 1.
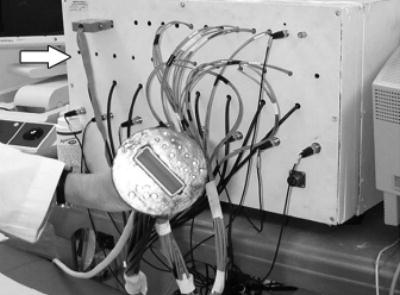
Picture of combined probe and frequency domain near-infrared imager (arrow). Commercial US probe is located at center of combined probe, and optical source and detector fibers are distributed at periphery of probe. Because diffused photons launched from a source and received by a detector travel in a curved path, lesions underneath US probe can be imaged with high sensitivity.
One author (Q.Z.) performed optical imaging. Details of the dual-mesh optical imaging reconstruction algorithm have been described previously (21,23). Briefly, the near-infrared reconstruction uses US localization of lesions. The reconstruction algorithm then segments the imaging volume into a finer grid in the lesion region identified at US and into a coarser grid in nonlesion regions. To account for the possibility of larger angiogenesis extension in lesions identified at US, we used a much larger region of interest for mapping lesions on the finer grid. For all optical images, a 0.5 × 0.5 × 0.5-cm imaging grid was used for the lesion, and a 1.5 × 1.5 × 1.0-cm grid was used for the background. The maximum and average total hemoglobin concentrations of the lesion were measured. Averages were computed inside the lesion, with the total hemoglobin concentration calculated within 50% of the maximum value (ie, within the full width at half maximum [FWHM] region) (see Appendix for additional details).
Because the hand-held probe could be easily rotated or translated, at least three coregistered US and near-infrared data sets were acquired at the lesion location, and the corresponding optical absorption maps, as well as the distribution of the total hemoglobin concentration, were reconstructed by using coregistered US.
Statistical Analysis
For statistical analysis, sensitivity was calculated as TP/(TP + FN), specificity as TN/(TN + FP), positive predictive value as TP/(TP + FP), and negative predictive value as TN/(TN + FN), where TP represents the number of true-positive findings, TN represents the number of true-negative findings, FP represents the number of false-positive findings, and FN represents the number of false-negative findings. Information obtained at biopsy was used as the reference standard. A Student t distribution was used to calculate the statistical significance of the mean maximum and mean average hemoglobin concentrations obtained in the malignant group and the benign group. Commercially available statistical software (SAS, version 8.2; SAS, Cary, NC) was used for calculations, and P < .001 was considered to indicate a statistically significant difference.
RESULTS
Biopsy results for malignant and benign groups are indicated in Tables 1 and Tables 2. The malignant group included eight early stage invasive carcinomas, and the benign group included 20 fibroadenomas, 15 cases of fibrocystic change, eight cases of fibrosis, eight other solid benign lesions, 21 complex cysts, and one case of hyperplasia. No significant differences were demonstrated among findings in the benign group, but a more than twofold higher total hemoglobin concentration (Fig 2) was found in the malignant group (mean maximum [± standard deviation], 122 μmol/L ± 26.8; mean average, 88 μmol/L ± 24.5, as measured within FWHM region) compared with the benign group (mean maximum, 55 μmol/L ± 24.8; mean average, 38 μmol/L ± 17.4, as measured within FWHM region). Both the maximum and average total hemoglobin levels were significantly higher in the malignant group compared with the benign group (P < .001). When a maximum hemoglobin concentration of 95 μmol/L was used as a threshold to separate malignant lesions from benign lesions, the near-infrared data of two fibroadenomas and one case of minimal nonatypical hyperplasia and fibrosis (which was classified as fibrosis) were above the threshold value (Fig 3). The sensitivity, specificity, positive predictive value, and negative predictive value of optical tomography were 100% (eight of eight lesions), 96% (70 of 73 lesions), 73% (eight of 11 lesions), and 100% (70 of 70 lesions), respectively. There were three false-positive lesions (Table 3). When a mean hemoglobin concentration of 66 μmol/L was used as a threshold to separate malignant lesions from benign lesions, the same sensitivity, specificity, positive predictive value, and negative predictive value were achieved.
TABLE 1.
Characteristics of Malignant Lesions as Determined at Biopsy, US, and Optical Tomography
| Total Hemoglobin Concentration (μmol/L)
|
||||
|---|---|---|---|---|
| Biopsy Finding and Lesion Diameter (cm) | BI-RADS Score | Appearance of Blood Flow at Doppler US | Maximum | Average* |
| Intraductal and invasive mammary duct carcinoma | ||||
| 0.6 (n = 1) | 4 | Inside and peripheral | 147.9 | 109.5 |
| Intraductal and invasive mammary duct carcinoma | ||||
| 2.2 (n = 1) | Known† | Peripheral | 103.8 | 69.7 |
| Invasive duct carcinoma | ||||
| ≤1.0 (n = 2) | 5 | Peripheral | 151.8 ± 29.7 | 116.4 ± 11.7 |
| Infiltrating lobular carcinoma | ||||
| 0.9 (n = 1) | Known† | No blood flow | 102.1 | 68.7 |
| Invasive mammary duct carcinoma and ductal carcinoma in situ | ||||
| 1.1 (n = 1) | 5 | Peripheral | 97.5 | 67.7 |
| Infiltrating ductal carcinoma and ductal carcinoma in situ | ||||
| 1.0 (n = 1) | 4 | No blood flow | 100.0 | 68.4 |
| Infiltrating mammary ductal carcinoma | ||||
| 0.9 (n = 1) | 5 | No blood flow | 108.5 | 78.7 |
| Average | 4.6 ± 0.5 | … | 121.6 ± 26.8 | 88.4 ± 24.5 |
Note.—Data are presented ± standard deviation.
Data were calculated within FWHM region.
Cancer was already designed in these two cases.
TABLE 2.
Characteristics of Benign Lesions as Determined at Biopsy, US, and Optical Tomography
| Total Hemoglobin Concentration (μmol/L)
|
||||
|---|---|---|---|---|
| Biopsy Finding and Lesion Diameter (cm) | BI-RADS Score | Appearance of Blood Flow at Doppler US | Maximum | Average* |
| Fibroadenoma | ||||
| 1.0 ± 0.6 (n = 2) | 4.0 ± 0.0 | Inside and peripheral | 55.7 ± 38.2 | 37.7 ± 28.4 |
| 0.9 ± 0.3 (n = 4) | 4.0 ± 0.0 | Peripheral | 54.9 ± 9.6 | 38.7 ± 7.4 |
| 0.8 ± 0.4 (n = 14) | 3.8 ± 0.6 | No blood flow | 70.5 ± 27.2 | 49.5 ± 19.4 |
| Average | 3.9 ± 0.5 | … | 65.9 ± 25.5 | 46.1 ± 18.3 |
| Fibrocystic change | ||||
| 0.6 ± 0.2 (n = 5) | 3.8 ± 0.4 | Peripheral | 43.3 ± 14.5 | 29.6 ± 9.7 |
| 0.8 ± 0.5 (n = 7) | 3.9 ± 0.4 | No blood flow | 56.5 ± 14.0 | 40.3 ± 10.4 |
| 0.8 ± 0.3 (n = 2) | 4.0 ± 0.0 | NA† | 76.7 ± 4.9 | 51.1 ± 11.4 |
| 0.6 (n = 1) | 4 | Inside | 68.7 | 48.5 |
| Average | 3.9 ± 0.4 | … | 55.6 ± 16.6 | 38.9 ± 11.9 |
| Fibrosis | ||||
| 0.8 (n = 1) | 4 | Inside and peripheral | 81.2 | 57.8 |
| 0.4 (n = 1) | 4 | Peripheral | 49.0 | 31.0 |
| 1.0 ± 0.8 (n = 5) | 4.0 ± 0.0 | No blood flow | 68.4 ± 37.9 | 47.3 ± 26.1 |
| NA (n = 1) | 4 | NA† | 54.0 | 36.3 |
| Average | 4.0 ± 0.0 | … | 66.2 ± 31.2 | 45.2 ± 21.3 |
| Tubular adenoma | ||||
| 0.4 (n = 1) | 4 | Inside and peripheral | 94.1 | 65.2 |
| Intraductal papilloma | ||||
| 1.5 (n = 1) | 4 | Peripheral | 38.3 | 26.6 |
| Tubular adenoma | ||||
| 0.4 (n = 1) | 4 | Peripheral | 66.2 | 45.8 |
| Normal tissue | ||||
| 1.0 ± 0.4 (n = 4) | 3.5 ± 0.6 | No blood flow | 42.8 ± 23.2 | 29.3 ± 14.2 |
| Ductal and stomal cells | ||||
| 0.3 (n = 1) | 4 | Inside | 72.0 | 53.1 |
| Average | 3.8 ± 0.5 | … | 55.2 ± 25.2 | 38.5 ± 17.2 |
| Complex cyst | ||||
| 0.7 (n = 1) | 4 | Inside and peripheral | 37.0 | 23.9 |
| 0.5 ± 0.2 (n = 3) | 2.7 ± 0.6 | Peripheral | 46.9 ± 9.6 | 32.5 ± 7.8 |
| 0.8 ± 0.4 (n = 17) | 2.9 ± 0.6 | No blood flow | 39.8 ± 23.3 | 27.5 ± 15.9 |
| Average | 3.0 ± 0.7 | … | 40.7 ± 21.3 | 28.0 ± 14.6 |
| Hyperplasia | ||||
| 0.6 (n = 1) | 3 | No blood flow | 56.2 | 38.0 |
Note.—Data are presented ± standard deviation. NA = not applicable.
Data were calculated within FWHM region.
Lesions were not visible at US. Lesions location was estimated with MR imaging or conventional mammography.
Figure 2.
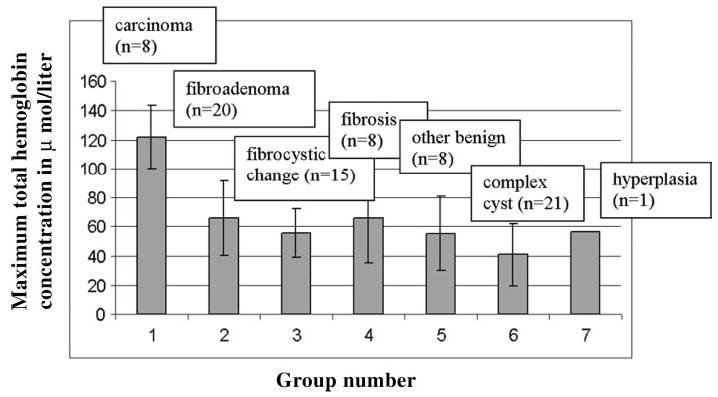
Bar graph demonstrates average maximum total hemoglobin concentration obtained in seven groups. Group 1 represents carcinoma (121.6 μmol/L ± 26.8); group 2, fibroadenoma (65.9 μmol/L ± 25.5); group 3, fibrocystic changes (55.6 μmol/L ± 16.6); group 4, fibrosis (66.2 μmol/L ± 31.2); group 5, other solid benign lesions (55.2 μmol/L ± 25.2); group 6, complex cysts (40.7 μmol/L ± 21.3); and group 7, hyperplasia (56.2 μmol/L ± 0.0). Horizontal axis represents group number, and vertical axis represents maximum total hemoglobin concentration in micromoles per liter. Error bars indicate standard deviations.
Figure 3.
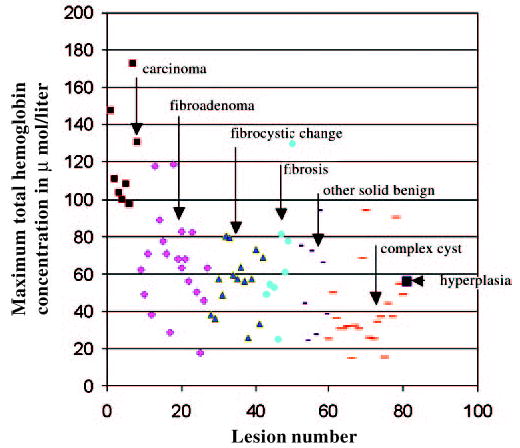
Scatter plot shows maximum total hemoglobin concentration for carcinoma (small ▪), fibroadenoma (♦), fibrocystic changes (▴), fibrosis (•), other solid benign lesions (short bar), complex cysts (long bar), and hyperplasia (large▪). Total hemoglobin concentration is measured on vertical axis in micromoles per liter.
TABLE 3.
Lesion Characteristics and Total Hemoglobin Concentration of Three False-Positive Findings
| Total Hemoglobin Concentration (μmol/L)
|
||||
|---|---|---|---|---|
| Biopsy Findings and Lesion Diameter (cm) | BI-RADS Score | Appearance of Blood Flow at Doppler US | Maximum | Average* |
| Fibroadenoma | ||||
| 1.91 × 0.85 | 4 | No blood flow | 117.8 | 81.3 |
| Fibroadenoma | ||||
| 1.50 × 0.70 | 4 | No blood flow | 119.0 | 85.2 |
| Minimal duct hyperplasia and fibrosis | ||||
| 3.40 × 1.56 | 4 | No blood flow | 129.9 | 89.2 |
Data were calculated within the FWHM region.
Optical tomography provided higher sensitivity and higher specificity than color Doppler US. Although blood flow was demonstrated at color Doppler US in five of eight malignant lesions, blood flow was also present in six (30%) of 20 fibroadenomas, six (40%) of 15 fibrocystic changes, two (25%) of eight cases of fibrosis, four (50%) of eight other solid benign lesions, and four (19%) of 21 complex cysts. The sensitivity, specificity, positive predictive value, and negative predictive value of color Doppler US were 63% (five of eight lesions), 69% (48 of 70 lesions), 19% (five of 27 lesions), and 94% (48 of 51 lesions), respectively. Because diffused light probes microvessel density rather than relatively large blood vessels (as is the case with color Doppler US), the sensitivity and specificity of optical tomography are expected to be much higher than those of color Doppler US.
Typical examples of malignant lesions are shown in Figures 4 and Figures 5; examples of benign lesions are given in Figures 6–8.
Figure 4.
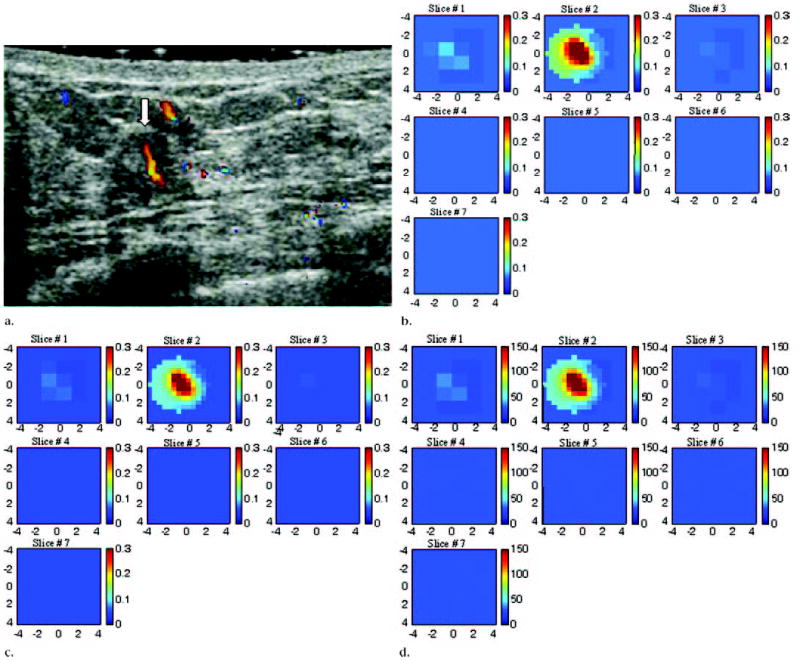
US image, optical absorption maps, and hemoglobin concentration maps of suspicious lesion at 3 o’clock position in left breast of 45-year-old woman. (a) US image demonstrates ill-defined, slightly heterogeneous, and mildly hypoechoic mass (arrow) measuring 6 mm in diameter. Color Doppler US revealed large blood vessels both inside and at periphery of lesion. Pathologic analysis revealed intraductal and invasive mammary duct carcinoma (nuclear grade 3, histologic grade 3). (b, c) Reconstructed optical absorption maps obtained at (b) 780 nm and (c) 830 nm. Optical absorption values range from 0 to 0.3 cm−1. The first section (Slice #1 in b and c) is a 9 × 9-cm spatial x–y image obtained at a depth of 0.5 cm, as measured from skin surface, and the last section (Slice #7 in b and c) is a spatial x–y image obtained 3.5 cm toward chest wall. Spacing between sections is 0.5 cm in propagation direction. Lesion was well resolved in section two (Slice #2). (d) Total hemoglobin concentration map computed from absorption maps of b and c. Hemoglobin map revealed an isolated high concentration mass in section two (Slice #2). Maximum hemoglobin concentration was 149.9 μmol/L, and average hemoglobin concentration was 121.1 μmol/L, as calculated within FWHM region. Average total hemoglobin concentration of background areas outside FWHM region was 29.0 μmol/L. Vertical scale presents total hemoglobin concentration in micromoles and ranges from 0 to 150 μmol/L.
Figure 5.
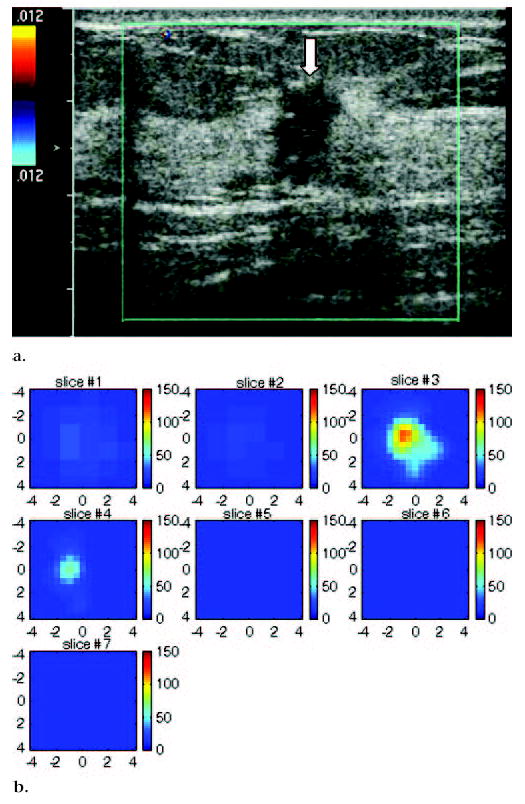
US image and hemoglobin concentration maps of infiltrating lobular carcinoma (nuclear grade 2–3) located at 12 o’clock position in right breast of 37-year-old woman. (a) US image demonstrates lesion (arrow) measuring 1 cm in diameter. No blood vessels or blood flow were seen at color Doppler US. (b) Total hemoglobin concentration map computed from absorption maps (not shown) obtained at 780 nm and 830 nm. Hemoglobin map reveals isolated high concentration mass in sections three (slice #3) and four (slice #4). Maximum hemoglobin concentration was 102.1 μmol/L, and average hemoglobin concentration was 68.7 μmol/L, as measured within FWHM region. Vertical scale presents total hemoglobin concentration in micromoles and ranges from 0 to 150 μmol/L.
Figure 6.
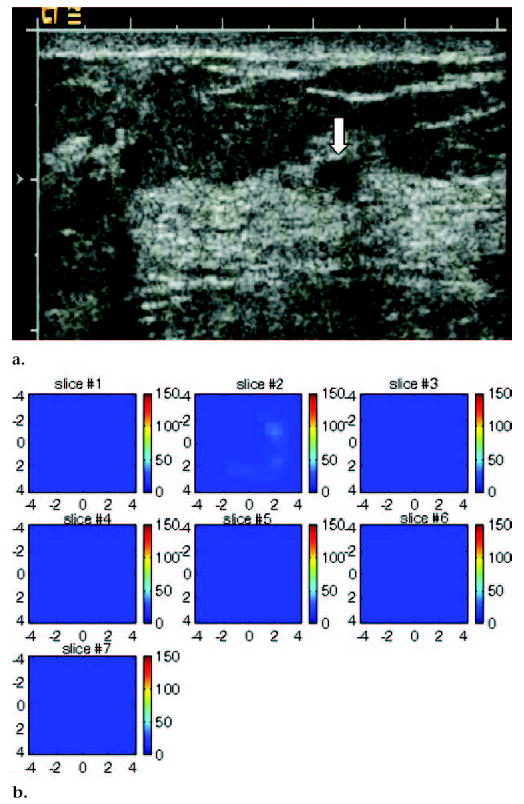
US image and hemoglobin concentration maps of suspicious 6-mm lesion located at 7 o’clock position in right breast of same patient as Figure 5. (a) US image demonstrates lesion (arrow). No blood vessels or blood flow were seen at color Doppler US. Biopsy result revealed benign nonproliferative fibroadipose breast tissue. (b) Total hemoglobin concentration map computed from absorption maps (not shown) obtained at 780 nm and 830 nm. No resolvable lesion was found in hemoglobin map, and maximum total hemoglobin concentration was only 24.2 μmol/L. Vertical scale represents total hemoglobin concentration in micromoles and ranges from 0 to 150 μmol/L.
Figure 8.
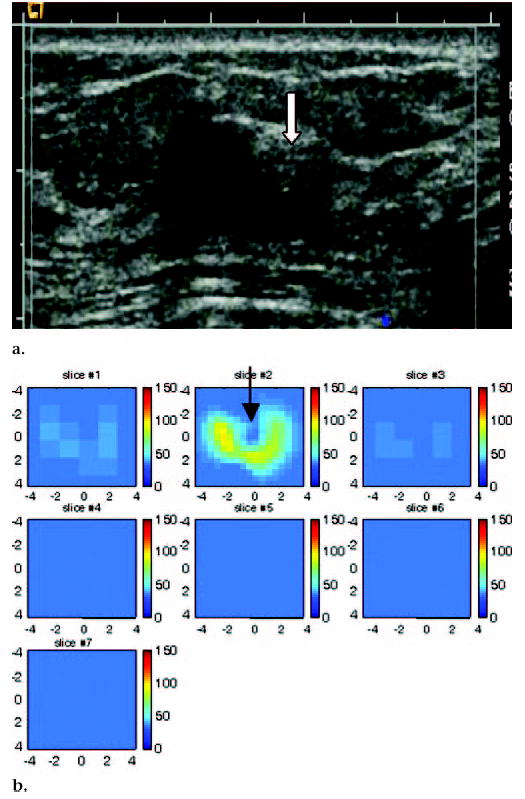
US image and hemoglobin concentration maps of 1.3 × 1.0-cm lesion, simple cyst, and complex cyst located between 3 o’clock and 4 o’clock positions in left breast of 59-year-old woman. (a) US image demonstrates simple cyst with adjacent complex cyst or solid nodule (arrow). Complex cyst was aspirated completely, and no residual abnormality was noted. (b) Total hemoglobin concentration map indicates low hemoglobin concentration at central location of cyst (arrow) close to origin in section 2 (slice #2). Light absorption maps (not shown) indicated low light absorption. Incomplete ring with higher light absorption and high hemoglobin concentration was observed surrounding cyst. Although measured total hemoglobin concentration was highest in complex cyst owing to higher absorption ring, distribution was obviously different from malignant cases (maximum total hemoglobin concentration, 94 μmol/L; average total hemoglobin concentration, 62.8 μmol/L, as measured within FWHM region). Cysts, in general, have low light absorption (and therefore low hemoglobin concentration) owing to low water absorption in wavelength range studied. The higher absorption ring was likely caused by the cyst wall. This example suggests that both hemoglobin distribution and threshold level must be evaluated for accurate diagnosis of suspicious lesions.
DISCUSSION
US is frequently used as an adjunct to conventional mammography in differentiating simple cysts from solid lesions. US also plays an important role in guiding interventional procedures, such as needle aspiration, core-needle biopsy, and prebiopsy needle localization (24). Previously, screening US has also been recommended for patients with dense breasts (25,26). We believe that our technique, which incorporates optical tomography and US localization, has demonstrated great potential to noninvasively distinguish malignant from benign breast masses and thereby potentially reduce the number of benign biopsy results. In a previous study (19), results obtained from two invasive early stage cancers and 17 benign lesions demonstrated that malignant cancers measuring 1 cm in diameter have an average maximum total hemoglobin concentration of 119 μmol/L, whereas benign lesions have an average maximum total hemoglobin concentration of 67 μmol/L. Thus, a nearly twofold greater total hemoglobin concentration was observed. Our study of eight early stage cancers and 73 benign lesions obtained at different clinical sites further demonstrates the diagnostic potential of this technique. In our current study, invasive cancers revealed a more than twofold greater total hemoglobin concentration. No false-negative results were found. Because our samples were limited, a larger prospective clinical trial is needed to validate these results.
In addition to the elevated hemoglobin concentration, information on the distribution of hemoglobin—that is, on the morphologic features of the lesion—is important in reaching an appropriate diagnosis. In general, the hemoglobin distribution of early stage invasive cancers appears isolated, and the lesion is well resolved; the hemoglobin distribution of solid benign lesions, however, appears more diffused. For larger complex cysts, a ring-shaped structure is sometimes observed around the lesions because of the substantial water content. Thus, cross-referencing the hemoglobin level and distribution with the results of standard imaging techniques will likely yield the most accurate diagnosis.
One potential limitation of optical tomography is the difficulty of imaging of lesions that are located close to dark nipple-areolar tissue. Because the light absorption of dark skin is high, the light perturbations that are attributed to the lesions may be secondary to the perturbations that are caused by the nipple-areolar complex. Therefore, the optical imaging algorithm may not reconstruct these lesions correctly. In our study, two cases were excluded from analysis because of this problem. A lighter-colored nipple-areolar complex did not appear to cause a problem. Also, lesions that were located more than 2 cm away from a dark nipple did not cause artifacts.
Another potential problem is the poor probe-to-tissue contact that is made while examining small dense breasts. Three cases were excluded from analysis because of this problem. Good probe-to-tissue contact could be achieved by developing probes of different sizes that are suitable for smaller breasts. Currently, we have designed an optical switch that allows the selection of different probes that are suitable for the size of the examined breast.
Three benign lesions, including two fibroadenomas, one case of minimal nonatypical duct hyperplasia, and one case of fibrosis, showed a high total hemoglobin concentration that suggested high microvessel density. The high total hemoglobin concentration of fibroadenomas may be explained by the results of a pilot study on vascular features of fibroadenoma (27). In this study (27), two different groups of fibroadenomas were recognized. The first group showed low microvascular permeability and a high extracellular volume fraction. At histopathologic analysis, lesions with low vascular permeability had a lower density of small vessels. The second group showed higher microvascular permeability and a lower extracellular volume fraction. Lesions with higher microvascular permeability had a higher density of small vessels than lesions in the first group. In our study, the patient with minimal nonatypical duct hyperplasia and fibrosis showed significant enhancement at MR imaging, suggesting increased vascularity in the area of the lesion. This patient had undergone excisional biopsy at the same location 2 years earlier, with similar pathologic findings. It was therefore unlikely that a clinically important lesion was missed during the recent core biopsy. The residual angiogenesis resulting from changes associated with the normal healing process may be a possible reason for the enhanced vascularity.
We do not envision that our technique will be used as a screening tool because lesions must be visible at US to map the lesion and background regions for dual-mesh optical imaging reconstruction. If lesion locations can be accurately estimated by using other imaging modalities, such as MR imaging, our technique could be expanded for lesion characterization by using those modalities, as well. More precise depth information, however, is required if data obtained with other modalities are not coregistered with the near-infrared data. The three reported cases of lesions seen at MR imaging or conventional mammography were reconstructed with accurate a priori knowledge of lesion location.
Because of intense light scattering, optical tomography alone has not been widely used in clinical studies. The data in the published literature have been limited to feasibility studies or case reports. In addition, the systems that are used to acquire optical tomographic data vary considerably. Most of the optical systems use transmission geometry, in which either the light sources and detectors are deployed around the examined breast in single or multiple rings (13,16) or the light sources are deployed on one side of the breast and the detectors are deployed on the opposite side with the breast compressed in between (17,18). It is clear that without a priori knowledge of lesion locations from other imaging modalities, no one has achieved significant and consistent improvements in accurate light quantification and, therefore, in the differentiation of benign from malignant processes. Only two examples that were related to our study were found in the literature (15,28). In one of the studies (15), the authors reported an average total hemoglobin concentration of 35 μmol/L in a 2-cm ductal carcinoma in situ by using near-infrared measurements alone. After reprocessing the same near-infrared data with an approximate lesion depth obtained from a separate US image, the average total hemoglobin concentration was increased to 67 μmol/L (28). This value was closer to the average of 88 μmol/L, which was obtained in eight malignant lesions in our study.
In principle, deoxygenated and oxygenated hemoglobin distributions can be estimated from absorption distributions obtained at wavelengths of 780 nm and 830 nm. The estimated deoxygenated and oxygenated hemoglobin distributions, however, were not robust because the negative coefficients in the computation formulas (see Appendix) could lead to negative deoxygenated and/or oxygenated hemoglobin values in some imaging voxels. The total hemoglobin distribution is more robust because of the positive coefficients in the computation formula. Therefore, no deoxygenated or oxygenated hemoglobin distribution was computed alone.
In principle, the distribution of oxygen saturation can be estimated from two wavelengths (29). For the two wavelengths (780 nm and 830 nm) that were used in this study, the estimated oxygen saturation in normal background tissue was not robust and could exceed the physiologic range. Recently, we added a 660-nm wavelength to the near-infrared system and found that the background tissue oxygen saturation can be estimated more reliably from measurements of 660 nm and 830 nm.
The reported malignant lesions were generally early stage cancers that were approximately 1 cm in diameter (except for one that measured 2.2 cm in diameter). For larger cancers, the angiogenesis distributions are complex and heterogeneous (29). This heterogeneous distribution is dependent on angiogenic factors (9) and is related to the incorporation of existing host blood vessels into tumor and the creation of tumor microvessels. Blood flow through these tumor vessels is heterogeneous. Some areas may have high flow, whereas others may have slower flow and develop necrosis (30). Tumors with relatively poor blood perfusion may not receive adequate delivery of systemic therapy. This lack of perfusion may be a factor in some patients who have poor response to chemotherapy treatment (31,32). Optical tomography for the imaging of larger tumors may be a valuable technique for mapping tumor angiogenesis and evaluating vascular changes, as well as tumor hypoxia, during chemotherapy (29). This type of information could also prove invaluable in monitoring chemotherapy responses to breast cancer treatment and assessing treatment efficacy.
Figure 7.
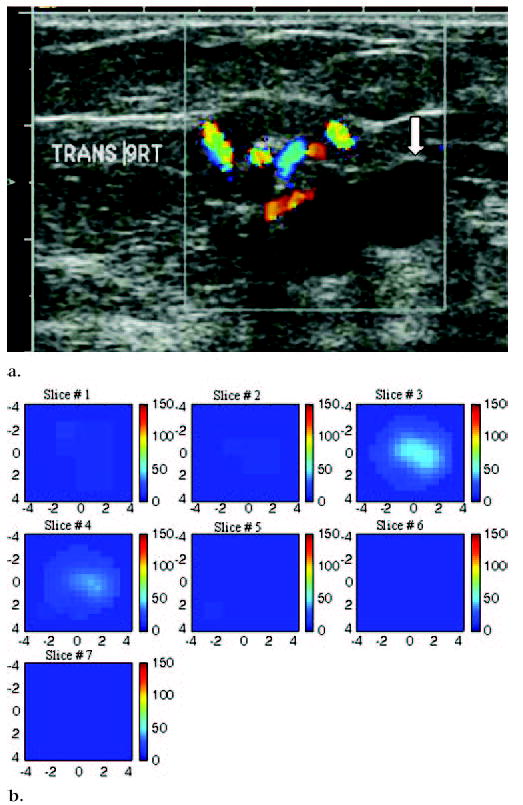
US image and hemoglobin concentration maps of suspicious 1.9 × 1.1-cm lesion at 9 o’clock position in right breast of a 75-year-old woman. (a) US image demonstrates lesion with solid component adjacent to cyst (arrow). Large blood vessels were seen at periphery of lesion during color Doppler US. Biopsy result revealed intraductal papilloma, with no evidence of atypical cells or malignancy. (b) Total hemoglobin concentration map computed from absorption maps (not shown) obtained at 780 nm and 830 nm. Vertical scale presents total hemoglobin concentration in micromoles and ranges from 0 to 150 μmol/L. Maximum total hemoglobin concentration was 38.2 μmol/L, and average total hemoglobin concentration was 26.3 μmol/L, as measured within FWHM region. Total hemoglobin distribution was diffused rather than localized, as seen in cases of malignancy.
Acknowledgments
Roxanne P. Rotondaro, coordinator of the Partnership for Breast Care of Hartford Hospital, is greatly acknowledged for coordinating this research project. Martha Ahlquist, coordinator of the Clinical Research Office of Hartford Hospital, is thanked for obtaining patient consent. The US technologists of the radiology department of Hartford Hospital are also thanked for their extremely helpful assistance with US data acquisition and patient scanning.
APPENDIX
A modified Born approximation was used to relate the scattered field Usd (rsi, rdi, ω) to the light absorption variations Δμaλ(r′) at wavelength λ in each volume element r′ of the two regions within the sample. For scattered field Usd (rsi, rdi, ω), ω is the modulation frequency and i is the index of the source detector pair for the optical source and detector positions rs and rd, respectively. The matrix form of image reconstruction is given by
where WL and WB are weight matrices for the lesion and background regions, respectively, N is the total number of imaging voxels, T is the matrix transpose, and M is the total number of measurements. ML and MB are the total absorption distributions of the lesion and background regions, respectively, which are calculated as
and
where d3r′ is the volume element. Weight matrices are calculated on the basis of background absorption and reduced scattering measurements, which are obtained from the normal contralateral breast. Instead of reconstructing the Δμaλ distribution directly (as is done in the standard Born approximation), the total absorption distribution M is reconstructed, and the total is divided by the different voxel sizes of the lesion and background tissue to obtain a Δμaλ distribution. By choosing a finer grid for the lesion tissue and a coarser grid for the background tissue, we can maintain the total number of voxels with unknown optical absorption on the same scale as the total measurements. As a result, the inverse problem is less well defined. In addition, because the absorption coefficient of the lesion is higher than that of the background tissue, the total absorption of the lesion over a smaller voxel is, in general, on the same scale as the total absorption of the background tissue over a larger voxel. Therefore, the matrix [ML, MB] is appropriately scaled for inversion.
Because the major chromophores in the wavelength range studied were deoxygenated and oxygenated hemoglobin, we estimated deoxygenated hemoglobin (deoxyHb) and oxygenated hemoglobin (oxyHb) concentrations at each imaging voxel by inverting the following equations voxel by voxel as
and
where μaλ1(r′) and μaλ2(r′) are the absorption coefficients obtained at imaging voxel r′, and wavelengths λ1 and λ2 correspond to 780 nm and 830 nm, respectively. Extinction coefficients (ε) for deoxygenated and oxygenated hemoglobin are given in the literature (33). The total hemoglobin concentration totalHb(r′), which is the sum of deoxyHb(r′) and oxyHb(r′), can be calculated as follows:
The perturbations at each wavelength that were used to calculate absorption maps were normalized as Usd (rsi, rdi,ω) = [UL (rsi, rdi, ω) − UN (rsi, rdi, ω)] · [UB (rsi, rdi, ω)/UN (rsi, rdi, ω)], where UL (rsi, rdi, ω) and UN (rsi, rdi, ω) are the optical measurements obtained at the lesion region and the normal region of the contralateral breast, respectively, and UB (rsi, rdi, ω) was the incident field that was calculated by using the measured background optical properties. This procedure cancels the unknown system gains associated with different sources, detectors, and electronic channels.
Footnotes
From the Bioengineering Program, Electrical and Computer Engineering Department, University of Connecticut, 371 Fairfield Rd, U2157, Storrs, CT 06269-1157 (Q.Z., M.H., N.C., C.X.); and Department of Radiology, Hartford Hospital, Hartford, Conn (E.B.C., A.A.C., H.S.V.).
Authors stated no financial relationship to disclose.
Author contributions:
Guarantor of integrity of entire study, Q.Z.; study concepts/study design or data acquisition or data analysis/interpretation, all authors; manuscript drafting or manuscript revision for important intellectual content, Q.Z., E.B.C.; manuscript final version approval, all authors; literature research, Q.Z.; clinical and experimental studies, all authors; statistical analysis, Q.Z.; manuscript editing, Q.Z., E.B.C.
Supported by the Department of Defense, Army Breast Cancer Program (DAMD17-00-1-0217); the Donaghue Foundation; and the National Institutes of Health (R01EB002136).
References
- 1.Poplack SP, Tosteson AN, Grove MR, Wells WA, Carney PA. Mammography in 53,803 women from the New Hampshire Mammography Network. Radiology. 2000;217:832–840. doi: 10.1148/radiology.217.3.r00dc33832. [DOI] [PubMed] [Google Scholar]
- 2.Hilton SV, Leopold GR, Olson LK, Willson SA. Real-time breast sonography: application in 300 consecutive patients. AJR Am J Roentgenol. 1986;147:479–486. doi: 10.2214/ajr.147.3.479. [DOI] [PubMed] [Google Scholar]
- 3.Rubin E, Miller VE, Berland LL, Han SY, Koehler RE, Stanley RJ. Hand-held real-time breast sonography. AJR Am J Roentgenol. 1985;144:623–627. doi: 10.2214/ajr.144.3.623. [DOI] [PubMed] [Google Scholar]
- 4.Jackson VP. The current role of ultrasonography in breast imaging. Radiol Clin North Am. 1995;33:1161–1170. [PubMed] [Google Scholar]
- 5.Venta LA, Dudiak CM, Salomon CG, Flisak ME. Sonographic evaluation of the breast. RadioGraphics. 1994;14:29–50. doi: 10.1148/radiographics.14.1.8128064. [DOI] [PubMed] [Google Scholar]
- 6.Rahbar G, Sie AC, Hansen GC, et al. Benign versus malignant solid masses: US differentiation. Radiology. 1999;213:889–894. doi: 10.1148/radiology.213.3.r99dc20889. [DOI] [PubMed] [Google Scholar]
- 7.Schor AM, Schor SL. Tumour angiogenesis. J Pathol. 1983;141:385–413. doi: 10.1002/path.1711410315. [DOI] [PubMed] [Google Scholar]
- 8.Folkman J, Watson K, Ingber D, Hanahan D. Induction of angiogenesis during the transition from hyperplasia to neoplasia. Nature. 1989;339:58–61. doi: 10.1038/339058a0. [DOI] [PubMed] [Google Scholar]
- 9.Vaupel P, Kallinowski F, Okunieff P. Blood flow, oxygen and nutrient supply, and metabolic microenvironment of human tumors: a review. Cancer Res. 1989;49:6449–6465. [PubMed] [Google Scholar]
- 10.Taylor KJW, Ramos I, Carter D, Morse SS, Snower D, Fortune K. Correlation of Doppler US tumor signals with neovascular morphologic features. Radiology. 1988;166:57–62. doi: 10.1148/radiology.166.1.2447604. [DOI] [PubMed] [Google Scholar]
- 11.Wilkens TH, Burke BJ, Cancelada DA, Jatoi I. Evaluation of palpable breast masses with color Doppler sonography and gray scale imaging. J Ultrasound Med. 1998;17:109–115. doi: 10.7863/jum.1998.17.2.109. [DOI] [PubMed] [Google Scholar]
- 12.Reinikainen H, Rissanen T, Paivansalo M, Paakko E, Iauhiainen J, Suramo I. B-mode, power Doppler and contrast-enhanced power Doppler ultrasonography in the diagnosis of breast tumors. Acta Radiol. 2001;42(1):106–113. [PubMed] [Google Scholar]
- 13.Pogue BW, Poplack SP, McBride TO, et al. Quantitative hemoglobin tomography with diffuse near-infrared spectroscopy: pilot results in the breast. Radiology. 2001;218:261–266. doi: 10.1148/radiology.218.1.r01ja51261. [DOI] [PubMed] [Google Scholar]
- 14.Franceschini MA, Moesta KT, Fantini S, et al. Frequency-domain techniques enhance optical mammography: initial clinical results. Proc Natl Acad Sci U S A. 1997;94:6468–6473. doi: 10.1073/pnas.94.12.6468. [DOI] [PMC free article] [PubMed] [Google Scholar]
- 15.Tromberg BJ, Shah N, Lanning R, et al. Non-invasive in vivo characterization of breast tumors using photon migration spectroscopy. Neoplasia. 2000;2(1–2):26–40. doi: 10.1038/sj.neo.7900082. [DOI] [PMC free article] [PubMed] [Google Scholar]
- 16.Jiang H, Xu Y, Iftimia N, et al. Three-dimensional optical tomographic imaging of breast in a human subject. IEEE Trans Med Imaging. 2001;20(12):1334–1340. doi: 10.1109/42.974928. [DOI] [PubMed] [Google Scholar]
- 17.Ntziachristos V, Yodh AG, Schnall M, Chance B. Concurrent MRI and diffuse optical tomography of breast after indocyanine green enhancement. Proc Natl Acad Sci U S A. 2000;97(6):2767–2772. doi: 10.1073/pnas.040570597. [DOI] [PMC free article] [PubMed] [Google Scholar]
- 18.Grosenick D, Moesta KT, Wabnitz H, et al. Time-domain optical mammography: initial clinical results on detection and characterization of breast tumors. Appl Opt. 2003;42(16):3170–3186. doi: 10.1364/ao.42.003170. [DOI] [PubMed] [Google Scholar]
- 19.Zhu Q, Huang MM, Chen NG, et al. Ultrasound-guided optical tomographic imaging of malignant and benign breast lesions. Neoplasia. 2003;5(5):379–388. doi: 10.1016/s1476-5586(03)80040-4. [DOI] [PMC free article] [PubMed] [Google Scholar]
- 20.Brown JM. The hypoxic cell. Cancer Res. 1999;59(23):5863–5870. [PubMed] [Google Scholar]
- 21.Zhu Q, Chen NG, Kurtzman SH. Imaging tumor angiogenesis by the use of combined near infrared diffusive light and ultrasound. Opt Lett. 2003;28(5):337–339. doi: 10.1364/ol.28.000337. [DOI] [PMC free article] [PubMed] [Google Scholar]
- 22.Chen NG, Guo PY, Yan SK, Piao DQ, Zhu Q. Simultaneous near infrared diffusive light and ultrasound imaging. Appl Opt. 2001;40(34):6367–6380. doi: 10.1364/ao.40.006367. [DOI] [PMC free article] [PubMed] [Google Scholar]
- 23.Huang M, Zhu Q. A dual-mesh optical tomography reconstruction method with depth correction using a priori ultrasound information. Appl Opt. 2004;43(8):1654–1662. doi: 10.1364/ao.43.001654. [DOI] [PMC free article] [PubMed] [Google Scholar]
- 24.Fornage BD, Coan JD, David CL. Ultrasound-guided needle biopsy of the breast and other interventional procedures. Radiol Clin North Am. 1992;30:167–185. [PubMed] [Google Scholar]
- 25.Bassett LW, Ysrael M, Gold RH, Ysrael C. Usefulness of mammography and sonography in women less than 35 years of age. Radiology. 1991;180:831–835. doi: 10.1148/radiology.180.3.1871302. [DOI] [PubMed] [Google Scholar]
- 26.Kolb TM, Lichy J, Newhouse JH. Occult cancer in women with dense breast: detection with screening US—diagnostic yield and tumor characteristics. Radiology. 1998;207:191–199. doi: 10.1148/radiology.207.1.9530316. [DOI] [PubMed] [Google Scholar]
- 27.Weinstein D, Strano S, Cohen P, Fields S, Gomori JM, Degani H. Breast fibroadenoma: mapping of pathophysiologic features with three-time-point, contrast-enhanced MR imaging—pilot study. Radiology. 1999;210:233–240. doi: 10.1148/radiology.210.1.r99ja18233. [DOI] [PubMed] [Google Scholar]
- 28.Holboke M, Tromberg B, Li X, et al. Three-dimensional diffuse optical mammography with ultrasound localization in human subject. J Biomed Opt. 2000;5(2):237–247. doi: 10.1117/1.429992. [DOI] [PubMed] [Google Scholar]
- 29.Zhu Q, Kurtzma SH, Hegde P, et al. Utilizing optical tomography with ultrasound localization to image heterogeneous hemoglobin distribution in large breast cancers. Neoplasia. 2005;7(3):263–270. doi: 10.1593/neo.04526. [DOI] [PMC free article] [PubMed] [Google Scholar]
- 30.Mankoff DA, Dunnwald LK, Gralow JR, et al. Blood flow and metabolism in locally advanced breast cancer: relationship to response to therapy. J Nucl Med. 2002;43(4):500–509. [PubMed] [Google Scholar]
- 31.Jain RK. Hemodynamic and transport barriers to the treatment of solid tumors. Int J Radiat Biol. 1991;60:85–100. doi: 10.1080/09553009114551621. [DOI] [PubMed] [Google Scholar]
- 32.Weidner N, Semple JP, Welch WR, Folkman J. Tumor angiogenesis and metastasis: correlation in invasive breast carcinoma. N Engl J Med. 1991;324(1):1–8. doi: 10.1056/NEJM199101033240101. [DOI] [PubMed] [Google Scholar]
- 33.Cope M. The application of near infrared spectrscopy to non-invasive monitoring of cerebral oxygenation in the newborn infant [PhD dissertation]. London, England: University College, 1991.


