Abstract
We present a frequency-domain near-infrared optical tomography system designed for breast cancer detection, in conjunction with conventional ultrasound. It features fast optical switching, three-wavelength excitations, and avalanche photodiode as detectors. Laser diodes at 660, 780, and 830 nm are used as light sources and their outputs are distributed sequentially to one of nine source fibers. An equivalent 130-dB isolation between electrical signals from different source channels is achieved with the optical switches of very low crosstalk. Ten detection channels, each of which includes a silicon avalanche photodiode, detect diffusive photon density waves simultaneously. The dynamic range of an avalanche photodiode is about 20 to 30 dB higher than that of a photomultiplier tube, thus eliminating the need for multistep system gain control. The entire system is compact in size (<0.051 m3) and fast in data acquisition (less than 2 sec for a complete scan). Calibration and the clinical experiment results are presented in the paper.
Keywords: diffusive imaging, optical switches, avalanche photodiodes, dynamic range, breast cancer
1 Introduction
Frequency-domain near-infrared optical tomography systems have been widely used to study optical properties of breast cancers in vivo.1–3 In the Optical and Ultrasound Imaging Laboratory at the University of Connecticut, we are developing a hybrid imager that combines optical tomography and conventional ultrasound for breast cancer detection.4,5 The ultimate goal of our studies is to establish a method that is more accurate and efficient than conventional x-ray mammography for breast cancer detection and diagnosis, for assessing cancer treatment, and for monitoring cancer recurrence. The combination of ultrasound with optical imaging provides complementary diagnostic information. The acoustic property of a simple cyst can be well distinguished from that of a tumor, while the local blood volume and blood oxygenation can be related to tumor malignance. In addition, using high-resolution ultrasound images to guide optical imaging reconstruction can partly solve the ill-posed problem and lead to more accurate reconstructed values.6,7 As a similar idea, combination of optical imaging with MRI for small animal imaging has been reported recently.8,9 Our clinical experiments at the University of Connecticut Health Center and Hartford Hospital have been successful, but we do feel the need to update the optical imager we built two years ago. First of all, it is heavy and bulky, which makes the transportation to multiple clinical locations difficult. Second, we used electronic switching for the light sources. Because the laser diodes need a certain time period to stabilize after switching, the data acquisition time was about 8 sec for one scan. In general, three scans at lesion locations and at reference locations are necessary for checking patient motion and for calculating averages. To reduce the size, weight, and data acquisition time, we designed and built a completely new optical imager.
There are two major changes in our new frequency-domain optical imager. Instead of using paired dual-wavelength laser diodes and electronic switching, only three laser diodes (660, 780, and 830 nm) are used in the new system. So the total number of laser diodes is reduced from 24 (would be 36 if three wavelengths are needed) to three. Optical switching is employed to distribute outputs of laser diodes to different source channels. Such architecture helps simplify the light source driving circuitry, reduce the size and weight, and increase the switching speed. For the detection subsystem, photomultiplier tubes (PMTs) were replaced by much lighter and smaller silicon avalanche photodiodes (APDs). Semiconductor photodetectors generally have higher quantum efficiency and dynamic range than PMTs, and cover a fairly wide spectral range (400 to 1100 nm for silicon photodiodes). Two important types of high-speed semiconductor photodetectors are PIN photodiodes and APDs. Nonetheless, a typical PMT has an internal gain ranging from 105 to 107. Consequently, its optoelectrical current level is much higher than those of PIN and APD detectors. This is the main reason that PMTs are so popular in weak light detection, and that we used them in our previous system. Normal photodiodes usually have a noise level about two orders lower than that of a high-speed preamplifier. Consequently, the signal-to-noise ratio of the detection system is dominated by the preamplifier noise. A silicon APD can have an internal gain of 100 to 1000. Such an internal gain makes it possible to match the noise level of optoelectrical signals with the input noises of available preamplifiers. While the noise level remains almost the same, the signal strength is increased by 40 to 60 dB and so is the signal-to-noise ratio. Since the output signals from APD detectors are much weaker than the output from a PMT, cautions have been taken to reduce the impact of environmental noises and, especially, feed-through interferences. We have employed a careful radio-frequency (RF) design to achieve the minimal feed-through interference level from the transmission part to the reception part.
2 System Design
To suppress interferences as much as possible, the new diffusive light imager is separated into a transmission part and a reception part. Each part is enclosed in an aluminum chassis measuring 17 × 13 × 7 cubic inches. The transmission part is responsible for generating amplitude-modulated light output at three wavelengths of 660, 780, and 830 nm. It also contains optical switches that distribute light power to nine source channels. In the reception part, there are 10 detection channels that simultaneously measure intensities of diffusive light collected by light guides. The connection between the transmission and the reception parts is a coaxial cable, which transmits a synchronization signal from the transmission part to the reception part. The synchronization signal is used to generate a reference signal, which is necessary for retrieving phase shifts related to photon density waves at different locations. A negative effect of the synchronization signal is the unwanted interferences that it brings into the detection channels. However, the synchronization signal has to be strong enough to overcome zero-cross point shifting caused by noises. So determination of the synchronization signal level is a tradeoff between the interference level and phase accuracy. We gradually lowered the synchronization signal to the point beyond which the measured phase noise increased suddenly.
Shown in Fig. 1 is the schematic of the transmission part. Pigtailed laser diodes from Thorlabs are used as light sources. Three wavelengths (660, 780, and 830 nm) pertinent to imaging hemoglobin concentrations and tumor hypoxia are available at an ≈10-mW fiber output power. A 10-dBm oscillator generates 140-MHz sine waves for modulation. Most of its output goes through a directional coupler to a RF amplifier, while a small portion is directed to the reception part as the synchronization signal. An attenuator (not shown in Fig. 1) is used to further reduce the power level of the synchronization signal. The amplified 140-MHz signal is connected to a laser diode driver board, at which it is combined with dc bias currents to feed laser diodes. Modulated light outputs are coupled to three input ports of a 4 × 1 optical switch. A remaining input port is reserved for an additional wavelength, which we may add in the future. The output of the 4 × 1 optical switch is directly connected to the input of a 1 × 9 optical switch, each of whose output fibers corresponds to one source position.
Fig. 1.
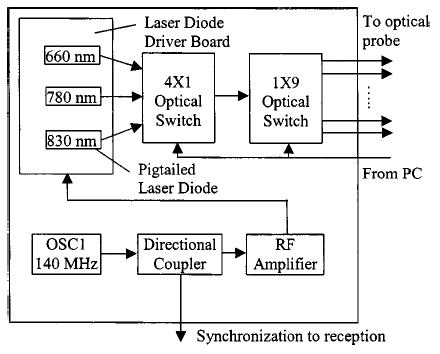
Schematic of the transmission part.
Both optical switches were purchased from piezosystem jena GmbH. They are compact in size (168 × 113 × 30 mm3) and can be controlled by BCD codes via a D-sub 25 connector. Input and output optical fibers (62.5-μm core diameter) are terminated with standard ST connectors. Other specifications (for both 4 × 1 and 1 × 9) are listed in Table 1. Their switching time is about 2 ms, much faster than other similar products on the market, and warrants near-real-time image acquisition. Crosstalk and repeatability of these switches are also reasonably good. For example, the crosstalk between different optical channels is better than 65 dB. Since the optical power is converted proportionally to voltage or current at a photodetector, the resulting isolation in electrical signals from different sources channels is 130 dB. A National Instruments multifunction data acquisition card (DAQ) installed in a PC provides 4-digit control signals for each optical switch.
Table 1.
Specifications of piezosystem jena 4 × 1 and 1 × 9 optical switches.
| Insertion loss | 2 dB (max) | 1.6 dB (typical) |
| Cross talk | 60 dB (max) | 65 dB (typical) |
| Repeatability (>1500 cycles over 1 h) | 0.02 dB (max) | 0.01 dB (typical) |
| Operating voltage | 5 V (500 mA) | |
| Operating temperature range | 0° to 50°C |
The reception part consists of 10 identical detection channels, which are sealed in 10 small aluminum boxes for RF shielding. Figure 2(a) shows the overall structure of the reception part, while Fig. 2(b) shows the schematic of each detection channel. In each detection channel, a light guide collecting diffusive lights from an optical imaging probe is coupled to an APD (S3884, Hamamatsu) by the use of an adaptor. As a result of modulated light sources, the optoelectrical current of the APD detector has an ac component at the same frequency, i.e., 140 MHz. A high-speed low-noise transimpendence amplifier (SA5212A, Philips Semiconductors) converts the opto-electrical current to a voltage signal, which is then mixed with a 140.020-MHz signal (generated by a local oscillator OSC2) at a frequency mixer (SBL-1, Mini-Circuits). The heterodyne signal passes through a bandpass (BP) filter with a center frequency at 20 KHz, and is further amplified by another low-frequency amplifier by about 40 dB. The resulting signal contains both amplitude and phase information related to the original RF signal. However, a reference signal is necessary for accurate retrieval of the phase. The synchronization signal from the transmission part is mixed with the local oscillation of 140.020 MHz to generate the reference signal, which serves as a trigger signal for data acquisition. Outputs from all detection channels and the reference signal are digitized with two DAQ cards (PCI-6070E, National Instruments) working synchronously. Hilbert transform is performed on a PC to compute the amplitude and phase of each acquired waveform. The amplitude A i j for the source i and detector j is simply the mean magnitude of the Hilbert transform of corresponding waveform u i j(n),
Fig. 2.
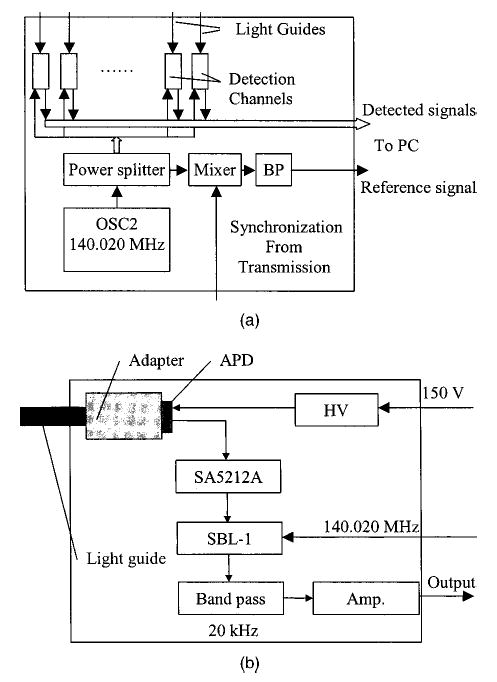
Schematic of the reception part.
| (1) |
where n denotes the discrete time point. The phase φi j is given by
| (2) |
where u r(n) is the reference sequence.
A high voltage (HV) adjustment circuit is used to provide an appropriate voltage for each individual APD. Shown in Fig. 3(a) is a typical way to connect the HV power supply (CA02P, EMCO High Voltage Corporation) with an APD and a transimpedance amplifier.10 A resistor of 10 to 100 k limits the optoelectrical current, while the HV is set to the operational voltage. This circuit is good for digital applications such as in optical communication. However, the optoelectrical response becomes nonlinear when the optical input power causes a substantial increase in the voltage across the resistor and a decrease in the APD bias. By parallel connecting a Zener diode to clamp the voltage across the APD, as shown in Fig. 3(b), we can significantly improve the linear input range. Of course, the breaking voltage of the Zener diode should match the operational voltage of the APD, and the HV should be set at a higher value. But there is still another problem. The avalanche photodiodes came with operational voltages ranging from 127 to 139 V (for internal gain M = 100). It is very difficult to do exact and homogeneous matching for all the 10 channels. We add a variable voltage source in series with the Zener diode to facilitate the adjustment [Fig. 3(c)]. The variable voltage source is comprised of a transistor and a potentiometer, which provides continuously adjustable voltage from 0.5 to 12 V. The breaking voltage of the Zener diode is around 126 V.
Fig. 3.

High-voltage power supply circuitry.
A special procedure in the data acquisition program is needed to overcome the limited dynamic range of the DAQ card. The analog-to-digital conversion has a 12-bit resolution, which corresponds to about a 72-dB dynamic range. However, the analog part of the reception system is capable of providing an 80- to 90-dB dynamic range. We used the programmable input range of the DAQ card to solve this problem. For each source-detector pair, the waveform related to the photon density wave is digitized twice. In the first period we use an input range of the DAQ card of −1 to 1 V, while in the second period we use −10 to 10 V. The amplitudes and phases are retrieved for both the smaller range and the larger range. If the amplitude associated with the bigger range is greater than 1 V, it will be taken as the measured value, and so will the corresponding phase. Otherwise, the values associated with the smaller range will be adopted. This procedure effectively increases the dynamic range by 20 dB.
The overall weight of the system is about 12 kilograms, while our previous PMT-based system weighs more than 60 kilograms. Shown in Fig. 4(a) is a picture of our new imager. The transmission and reception parts are stacked together, while a portable printer is put aside for comparison of the sizes. For the sake of mobility, an LCD monitor is used together with a desktop computer for data acquisition. Source fibers and detection light guides are connected to a combined probe [Fig. 4(b)]. In clinical studies, a commercial ultrasound transducer is inserted in the middle of the combined probe, which is placed on the top of a breast with the patient in a supine position.
Fig. 4.
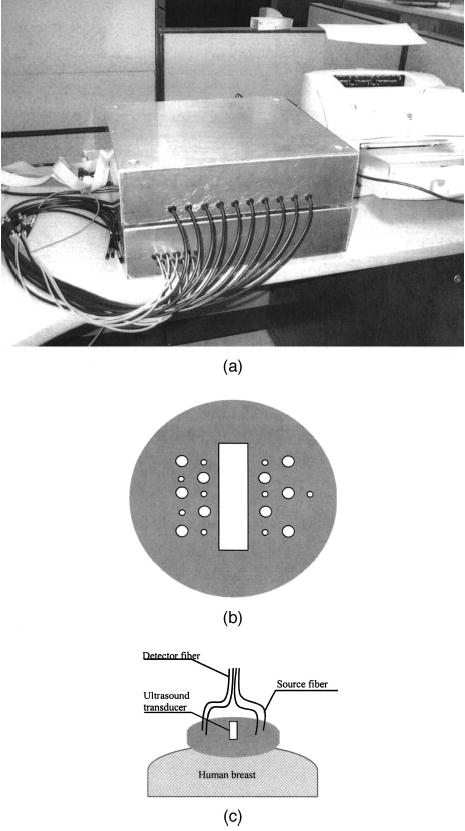
(a) Picture of the new imager. Its size is compared with a portable printer. (b) Configuration of the combined probe. Smaller circles indicate locations of light sources, and larger circles correspond to detection light guide positions. The central rectangular hole is used to hold an ultrasound transducer. (c) Geometry for detection breast cancers with the combined probe.
3 Testing and Calibration
The system linearity was tested with neutral density filters and the setup shown in Fig. 5(a). The source fiber was connected to one source channel through an inline attenuator of 20 dB. Output light from the source fiber was collimated with a lens, and a small portion of it (about 1%) is directed to the light guide connected to a detection channel. Neutral density filters were inserted into the path of the collimated light to adjust the light intensity coupled to the detector. The optical density (OD) values of the neutral density filter set were 0.5, 1, and 3. By stacking them together, an attenuation range from 10−0.5 (OD = 0.5) to 10−5 (OD = 5) was achieved. The detected signal amplitude in logarithm scale versus optical density is plotted in Fig. 5(b). It is obvious that the linearity of the detection system is very good in the range 1 ⩽ OD ⩽ 5, which is equivalent to 80 dB. At the point of OD = 0.5, saturation of the detector occurred and the amplitude was suppressed by approximately 7 dB. The dynamic range of system was estimated around 85 dB. This is achieved without two-stage light source control, which is necessary for a PMT system of similar dynamic range. The measured phases remain essential constant, as a result of very small amplitude-phase cross talk.
Fig. 5.
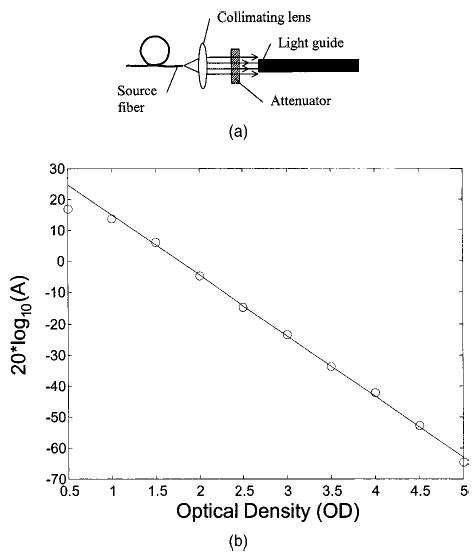
(a) Setup for testing the system linearity. (b) The amplitudes (A) in logarithm versus total optical density of inserted attenuators. Circles: measured values; solid line: linear fitting.
Uniformity of source and detection channels was calibrated with following procedures. To test the source channel uniformity, different source channels were sequentially coupled to one detection channel via an inline attenuator of 70 dB. To test the detection channel uniformity, different detection channels were switched to one source channel. The variations in amplitude and phase of source channels were 0.27 dB and 0.19 rad respectively. For the detection channels, the variations were 0.9 dB for amplitudes and 0.23 rad for phases. The relative gain and phase shift of each source or detection channel were included in image reconstruction algorithms to cancel channel heterogeneity.
4 Image Reconstruction Method
A dual-mesh image reconstruction algorithm, proposed in our previous publication,7 has been implemented in our new imager. Briefly, the total imaging volume is segmented into two regions L and B, where the lesion region L contains suspected structures found on co-registered ultrasound images and the nonlesion region B is the background. Then the target and background regions are discretized with different voxel sizes, resulting in a finer grid in the lesion region and a coarse grid in nonlesion region. We consider only absorption changes in the medium on the assumption that the contribution of scattering heterogeneities to the measurement is negligible, although similar procedures can be applied to reconstructing scattering coefficients. When the Born approximation is valid, the scattered diffusive light intensity can be approximated by
| (3) |
where G(r 1 ,r 2) and U inc(r 1 ,r 2) are the Green’s function and incident diffusive light intensity connecting location r 1 and r 2 , r υ j is the center of voxel j in lesion region L, r υ k is the center of voxel k in the background region B, and r si and r di are source and detector positions, respectively. Equation (1) can be written in the following matrix form:
| (4) |
where
and
Instead of reconstructing Δμa distribution directly, we reconstruct the total absorption distribution M and then divide it by different voxel sizes of target and background regions to obtain the Δμa distribution. In general, the target region is more absorbing than the background, and the total absorption distribution M, which is approximately the product of Δμa and the corresponding voxel size, is well scaled between lesion region and nonlesion region for inversion. In the following clincal case studies, we have used a finer grid of 0.5 × 0.5 × 0.5 (cm3) in the target region and a coarse grid of 1.5 × 1.5 × 1.0 (cm3) in the background region. As a result, the weight matrix [W′] = [W L ,W B] expands to several discrete layers in depth and the weight matrix W L of larger tumors also expands to two to three layers. The total least square method is employed to formulize the inverse problem, and the conjugate gradient method is used to minimize the object function.4,5 The iterative search converges quickly in two to three iterations, and thus no regularization scheme is used in the inversion.
5 Clinical Case Study
Clinical studies were performed at Hartford Hospital with the protocol approved by the IRB committee of the Hartford Hospital. The first example was obtained from a 45-year-old patient who had a suspicious lesion at the 3 o’clock position of the left breast. The combined probe was centered approximately above the lesion for acquisition of ultrasound and optical images. The ultrasound gray-scale image with Doppler superimposed is shown in Fig. 6. The lesion has an irregular shape and posterior shadowing. Ultrasound Doppler reveals blood flow at the lesion periphery. The diagnosis based on ultrasound was highly suspicious and biopsy was recommended.
Fig. 6.
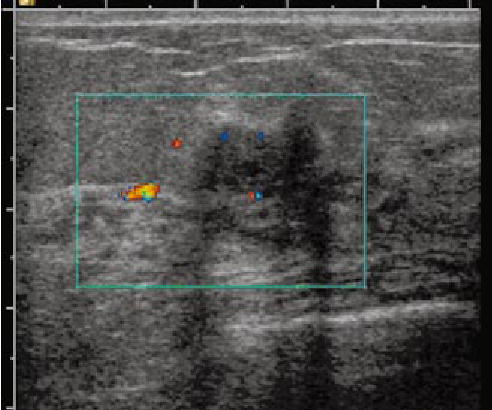
Ultrasound gray-scale image with Doppler superimposed. The lesion was located at the 3 o’clock position of the left breast of a 45-year-old patient and was considered as highly suspicious. The ultrasound revealed irregular shape and posterior shadowing with blood flow seen at several periphery sites of the lesion.
Optical data at three wavelengths were taken before the biopsy procedure. The data acquisition time for each scan was less than 2 sec, much faster than our previous system (about 8 sec for two source levels). Multiple data sets at the lesion location as well as at the contralateral normal breast were acquired. It took about 5 min for the entire experiment. Figures 7–9 show the reconstructed optical absorption maps at three wavelengths. For each slice, the spatial dimensions are 9 by 9 cm. The first slice is 0.7 cm from the skin surface and the last slice is close to the chest wall. The spacing between slices is 0.5 cm. The optical absorption distributions appear diffused, and absorption maximums at the three wavelengths are 0.1420, 0.1499, and 0.1450 cm−1, respectively. The total hemoglobin concentration calculated from 780 and 830 nm is shown in Fig. 10. The extinction coefficients used are obtained from Ref. 11. The maximum concentration is 68.90 μmol. Earlier results obtained from two invasive early stage cancers and 17 benign lesions have shown that malignant cancers present an average of 119-μmol maximum total hemoglobin concentration while the benign group has an average of 67 μmol.12 A nearly two-fold higher contrast has been obtained. In addition, the malignant cancers were well resolved while the benign lesions appeared diffused. Based on our experience, the diffused patterns of the absorption distributions and the maximum total hemoglobin concentration level all suggested that the lesion should be benign. Biopsy revealed that the lesion was a benign fibroadenoma with no evidence of malignancy.
Fig. 7.
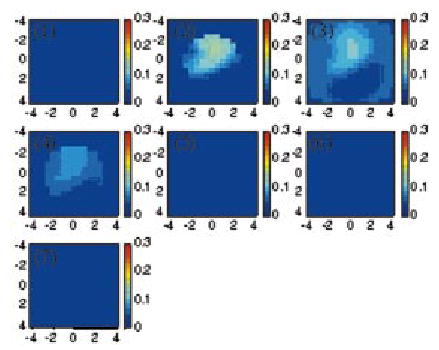
Reconstructed optical absorption map at 660 nm. The slices were from 0.7 cm underneath the skin to the chest wall with 0.5-cm spacing. For each slice, the horizontal and vertical axes are X and Y, respectively, with the spatial dimensions of 9 × 9 cm. The lesion appears in slice 2, 3, and 4.
Fig. 9.
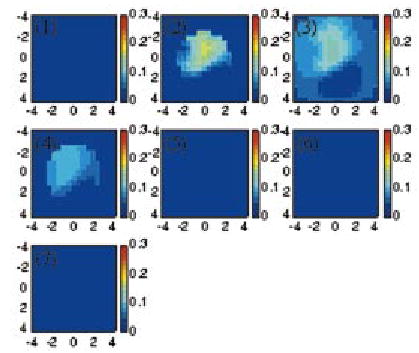
Reconstructed optical absorption map at 830 nm. Similar distributions at 660 and 780 nm were observed.
Fig. 10.
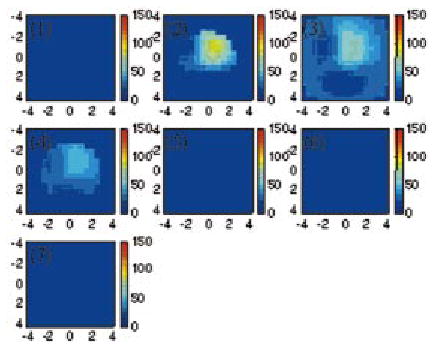
Total hemoglobin concentration calculated from 780 and 830 nm. The color bars are in units of micromoles.
6 Discussions and Conclusions
In our original design of the new imager, wavelengths of 780, 808, and 830 nm are picked for light sources. Unfortunately, pigtailing of the 808-nm laser diodes was not successful and the coupling efficiency was too low to provide enough output optical power. So we chose a commercially available 660-nm pigtailed laser diode as the third wavelength besides 780 and 830 nm. However, the 660-nm light is much more strongly absorbed by human tissues than 780 and 830 nm. As a result, the signal strength of distant source-detector pairs is generally too weak for 660 nm and leads to inferior image quality compared with the other two wavelengths. This is the reason we just used optical images at 780 and 830 nm to calculate the total hemoglobin concentration. Nonetheless, 660 nm is still useful for shallow lesions, which primarily result in perturbations for short source-detector pairs. We will include more useful wavelengths in the future. In addition, the total hemoglobin is estimated as Hb t(r) = 0.2002 μa 780(r) + 0.2732μa 830(r), where μa 780(r) and μa 830(r) are absorption coefficients obtained at 780 and 830 nm at voxel r. If three wavelengths are used, the total hemoglobin can be estimated as Hb t(r) = 0.0029μa 660(r) + 0.18361μa 780(r) + 0.2838μa 830(r). The contribution of the 660-nm absorption to total hemoglobin is small, however, the significance of adding 660 nm is on tissue hypoxia estimation. This issue will be addressed in our future publications.
To conclude, a portable multichannel multiwavelength optical tomography system has been developed for breast cancer imaging. The major advantages of this new imager include its compactness and the near-real-time data acquisition speed. In addition, it has a wide dynamic range achieved without multistep system gain control.
Fig. 8.
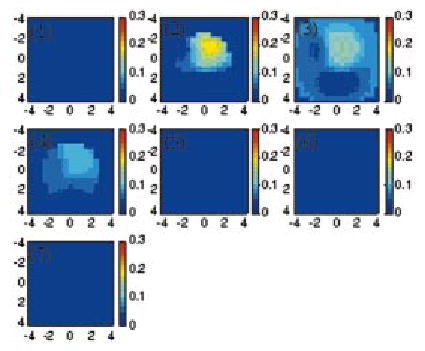
Reconstructed optical absorption map at 780 nm. Similar distribution at 660 nm was observed.
Acknowledgments
We would like to thank the following for their funding support: the State of Connecticut (99CT21), DOD ARMY Breast Cancer Program (DAMD17-00-1-0217, DAMD17-01-1-0216), and NIH (8R01EB002136-02).
References
- 1.Franceschini MA, Moesta KT, Fantini S, Gaida G, Gratton E, Jess H, Seeber M, Schlag PM, Kashke M. “Frequency-domain techniques enhance optical mammography: initial clinical results,”. Proc Natl Acad Sci USA. 1997;94:6468–6473. doi: 10.1073/pnas.94.12.6468. [DOI] [PMC free article] [PubMed] [Google Scholar]
- 2.Jiang H, Paulsen K, Osterberg Ulf, Pogue B, Patterson M. “Optical image reconstruction using frequency-domain data: simulations and experiments,”. J Opt Soc Am A. 1996;13:253–266. [Google Scholar]
- 3.Fishkin JB, Coquoz O, Anderson ER, Brenner M, Tromberg BJ. “Frequency-domain photon migration measurements of normal and malignant tissue optical properties in human subject,”. Appl Opt. 1997;36:10–20. doi: 10.1364/ao.36.000010. [DOI] [PubMed] [Google Scholar]
- 4.Zhu Q, Chen NG, Ding X, Piao D, Guo P. “Design of near infrared imaging probe with the assistance of ultrasound localization,”. Appl Opt. 2001;40:3288–3303. doi: 10.1364/ao.40.003288. [DOI] [PMC free article] [PubMed] [Google Scholar]
- 5.Chen NG, Guo P, Yan S, Piao D, Zhu Q. “Simultaneous near infrared diffusive light and ultrasound imaging,”. Appl Opt. 2001;40:6367–6280. doi: 10.1364/ao.40.006367. [DOI] [PMC free article] [PubMed] [Google Scholar]
- 6.Chen NG, Zhu Q. “Characterization of small absorbers inside turbid media,”. Opt Lett. 2002;27:252–254. doi: 10.1364/ol.27.000252. [DOI] [PubMed] [Google Scholar]
- 7.Zhu Q, Chen NG, Kurtzman S. “Imaging tumor angiogenesis using combined near infrared diffusive light and ultrasound,”. Opt Lett. 2003;28:337–339. doi: 10.1364/ol.28.000337. [DOI] [PMC free article] [PubMed] [Google Scholar]
- 8.Xu H, Dehghani H, Pogue BW, Springett R, Paulsen KD, Dunn JF. “Near infrared imaging in the small animal brain: optimization of fiber positions,”. J Biomed Opt. 2003;8:102–110. doi: 10.1117/1.1528597. [DOI] [PubMed] [Google Scholar]
- 9.Ntziachristos V, Yodh AG, Schnall MD, Chance B. “MRI-guided diffuse optical spectroscopy of malignant and benign breast lesions,”. Neoplasia. 2002;4:347–354. doi: 10.1038/sj.neo.7900244. [DOI] [PMC free article] [PubMed] [Google Scholar]
- 10.“Characteristics and use of Si APD (avalanche photodiodes),” Technical information SD-28, Hamamatsu Corporation.
- 11.M. Cope, “The development of a near infrared spectroscopy system and its application for noninvasive monitoring of cerebral blood and tissue oxygenation in the newborn infant,” PhD thesis, Department of Medical Physics and Bioengineering, University College London, 1991.
- 12.Zhu Q, Huang M, Chen NG, Zarfos K, Jagjivan B, Kane M, Kurtzman SH. “Ultrasound-guided optical tomographic imaging of malignant and benign breast lesions: initial clinical results of 19 cases,”. Neoplasia. 2003;5(5):379–389. doi: 10.1016/s1476-5586(03)80040-4. [DOI] [PMC free article] [PubMed] [Google Scholar]


