Abstract
Monoamine oxidase A (MAO A) degrades serotonin, norepinephrine, and dopamine and produces reactive oxygen that may cause neuronal cell death. We have previously reported that a novel transcription factor R1 (RAM2/CDCA7L/JPO2) inhibits the MAO A promoter and enzymatic activities. This study reports the roles of MAO A and R1 in apoptosis and proliferation. We have found that in serum starvation-induced apoptosis, p38 kinase, MAO A, and caspase-3 were increased, whereas Bcl-2 and R1 were reduced. Using a p38 kinase inhibitor, R1 overexpression, and MAO A inhibitor, we have shown that MAO A and R1 are downstream of p38 kinase and Bcl-2, but upstream of caspase-3. Inhibition of MAO A prevents cell apoptosis. This notion was further supported by the finding that serum starvation-induced apoptosis is reduced in cortical brain cells from MAO A-deficient mice compared with WT. In addition, we found that MAO A and R1 are involved in the c-Myc-induced proliferative signaling pathway in the presence of serum. Immunoprecipitation and immunohistochemistry experiments indicate that the oncogene c-Myc colocalizes with R1 and induces R1 gene expression. Using R1 overexpression, R1 small interfering RNA, and a MAO A inhibitor, we found that R1 and MAO A act upstream of cyclin D1 and E2F1. In summary, this study demonstrates the functions of MAO A and its repressor R1 in apoptotic signaling pathways.
Keywords: c-Myc, caspase-3, p38 kinase, proliferation, transcription factor
Monoamine oxidases (MAOs) A and B, located on the outer mitochondria membrane with a 70% amino acid sequence identity (1, 2), catalyze the oxidative deamination of biogenic and dietary amines including monoamine neurotransmitters serotonin, norepinephrine, dopamine, and phenylethylamine. MAO plays important roles in several psychiatric and neurological disorders (3). MAO exists in two forms, MAO A and MAO B. Their catalytic activity generates H2O2 and nitrogen species, which are toxic products and may cause oxidative damage to mtDNA and have potential implications for apoptosis, aging, and neurodegenerative processes (4).
The in vivo function of MAO A and MAO B has been studied extensively in MAO A and MAO B knockout (KO) mice (5–7). The regulation of MAO A and MAO B gene expression by extracellular stimulation, phorbol 12-myristate 13-acetate (PMA), has also been examined. PMA selectively increases MAO B but not MAO A gene expression by activation of protein kinase C and mitogen-activated protein kinase (MAPK) signaling pathways (8).
Ample evidence has indicated an important role for MAO A in apoptosis. MAO A expression has been shown to increase after the depletion of neurotrophic factor mediated by p38 kinase in PC12 cells (9). A MAO A inhibitor, clorgyline, was able to protect cells from apoptosis induced by serum starvation in human melanoma m14 cells (10). More recently, MAO A has been found to be a target of a dopaminergic neurotoxin, N-methyl-(R)-salsolinol, which leads to apoptosis in a human neuroblastoma SH-SY5Y cell line (11). This apoptotic activity could be inhibited by an MAO inhibitor, N-propargylamine, through an increase in antiapoptotic Bcl-2 (11). This finding suggests that p38 kinase and Bcl-2 may be two effectors in MAO A-involved apoptosis. However, the signaling pathway in MAO A-mediated apoptosis is unknown. This study investigates the roles of MAO A and R1 in the regulation of cell apoptosis and proliferation. R1 (RAM2/CDCA7L/JPO2) is a transcriptional repressor of MAO A (12). An R1-stable overexpressed cell line and an R1-knockdown cell line have been used in this study.
Results
Repressor R1 Expression Decreased Whereas MAO A Expression Increased in Serum Starvation-Induced Apoptosis.
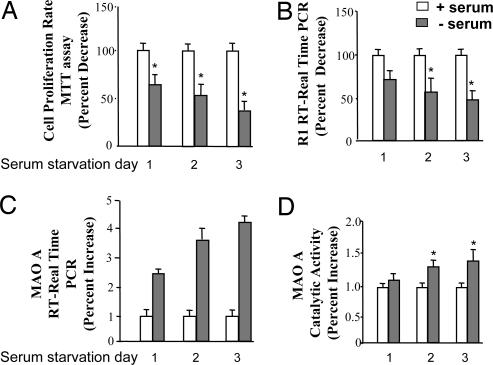
We first determined the effect of serum starvation-induced apoptosis on the expression of R1 and MAO A in human neuroblastoma SK-N-BE(2)-C cells. Cells were cultured in serum withdrawal medium for 1, 2, or 3 days. Their proliferation rate was decreased to 65%, 55%, and 30% on days 1, 2, and 3, respectively compared with their controls (in the presence of serum; Fig. 1A) as determined by 3-(4,5-dimethylthiazol-2-yl)-2,5-diphenyl tetrazolium bromide (MTT) assay. Similarly, the repressor R1 mRNA decreased to ≈70%, 60%, and 45% (Fig. 1B), and the level of MAO A mRNA increased by 2.5-, 3.8-, and 4.3-fold (Fig. 1C) on days 1, 2, and 3, respectively, compared with their respective controls as determined by real-time RT–PCR. Further, MAO A catalytic activity increased by 1.3- and 1.5-fold on days 2 and 3, respectively (Fig. 1D). This finding suggests that repressor R1 and MAO A may be involved in apoptosis.
Fig. 1.
Effects of serum starvation-induced apoptosis on repressor R1 or MAO A expression in SK-N-BE(2)-C cells. Cells were cultured in serum-withdrawal medium for 1, 2, or 3 days. (A) Cell proliferation rate was determined by MTT assay. (B) mRNA level of R1 was examined by real-time RT–PCR. (C and D) MAO A activity was determined by real-time RT–PCR (C) or enzymatic activity assay (D). Values were obtained on serum starvation days 1, 2, and 3 and compared with their respective controls (in the presence of serum), which were taken as 100%. All data are presented as the mean ± SD of at least three independent experiments.
Serum Starvation Induced the Apoptosis-Activated p38 Kinase Pathway, but Not Extracellular Signal-Regulated Kinase (ERK) and c-Jun N-Terminal Kinase (JNK), in the SK-N-BE(2)-C Cell Line.
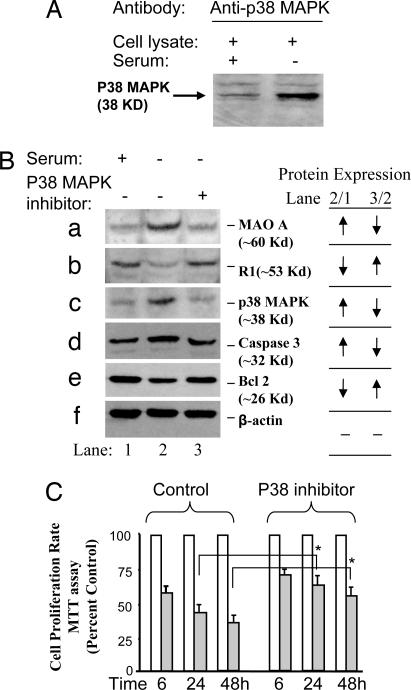
Western blot analysis showed that the level of p38 kinase protein was increased significantly after serum starvation for 3 days (Fig. 2A), but ERK and JNK proteins were not (Fig. 8, which is published as supporting information on the PNAS web site).
Fig. 2.
Repressor R1 and MAO A are present in the MAPK signaling pathway in serum starvation-induced apoptosis in SK-N-BE(2)-C cells. (A) Western blot analysis showed that p38 kinase is involved in serum starvation-induced apoptosis. (B) p38 kinase inhibitor prevented an increase in MAO A and decrease in R1 during serum starvation. p38 kinase inhibitor (PD169316, 1 μM) was added into serum-free medium for 3 days. Western blot analysis shows the protein expression of MAO A (a), R1 (b), p38 kinase (c), apoptotic marker protein caspase-3 (d), antiapoptotic marker protein Bcl-2 (e), and β-actin (loading control) (f) in control medium (lanes 1), serum-free medium (lanes 2), and serum-free medium plus p38 kinase inhibitor (lanes 3). The relative changes of protein expression are shown by arrows. (C) p38 kinase inhibitor prevented the decrease of proliferation rate induced by serum starvation. MTT assay was performed to determine the proliferation rate between serum-free medium and serum-free plus p38 kinase inhibitor group at different serum starvation time courses, 6, 24, or 48 h. Values at each time point were obtained by comparison with their respective controls (in the presence of serum), which were taken as 100%. The percentage of decrease was compared between the serum starvation group and the serum-free plus p38 kinase inhibitor group as indicated.
When p38 kinase inhibitor (PD169316, 1 μM) was added into serum-free medium for 3 days, Western blot analysis showed that protein levels of MAO A, p38 kinase, and apoptotic marker protein caspase-3 were increased compared with controls (in the presence of serum) (Fig. 2B a, c, and d, compare lanes 2 and 1), but that the increase was prevented by p38 kinase inhibitor (Fig. 2B a, c, and d, compare lanes 3 and 2). In contrast, repressor R1 and antiapoptotic marker protein Bcl-2 were decreased in serum-free medium (Fig. 2B b and e, compare lanes 2 and 1), but were recovered by p38 kinase inhibitor (Fig. 2B b and e, compare lanes 3 and 2). Furthermore, MTT assay showed that p38 kinase inhibitor increased the proliferation rate significantly from ≈40% to ≈60% after 24 h of serum starvation and from ≈35% to ≈55% after 48 h of serum starvation, compared with a control group without p38 kinase inhibitor (serum free; Fig. 2C, compare p38 kinase inhibitor with control).
These results indicate that the inhibition of p38 kinase efficiently rescued the apoptotic process and also suggest that Bcl-2, R1, and MAO A are three downstream targets of p38 kinase.
Overexpression of R1 or Inhibition of MAO A Prevents Apoptosis.
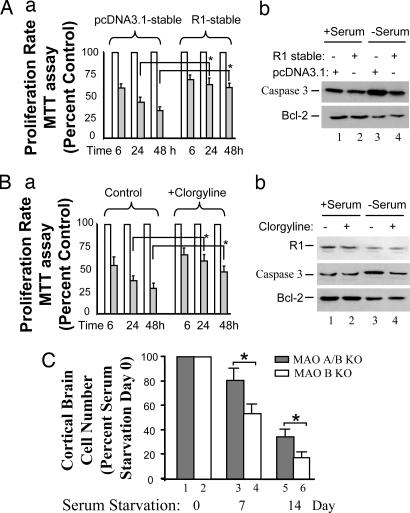
The effects of R1 or MAO A were further investigated by overexpression of R1 or inhibition of MAO A. R1 or pcDNA3.1 stably transfected cells were cultured in the serum-free medium for 6, 24, or 48 h, and the cell proliferation rate was determined by MTT assay (Fig. 3Aa). The results show that the proliferation of the R1-stable cell line was increased significantly, after 24 and 48 h of serum starvation, compared with the control group. Western blot analysis shows that caspase-3 increased (Fig. 3Ab, compare lanes 3 and 1), but Bcl-2 decreased (Fig. 3Ab, compare lanes 3 and 1), compared with controls (with serum) during serum starvation as expected. Interestingly, in a comparison of R1 stably transfected cells and pcDNA3.1 stably transfected cells, caspase-3 was decreased, but Bcl-2 was not changed during serum starvation (48 h) (Fig. 3Ab, compare lanes 4 and 3). These results suggest that overexpression of R1 prevents serum starvation-induced apoptosis and R1 is an upstream target of caspase-3, but downstream of Bcl-2.
Fig. 3.
Effects of overexpression of R1 or inhibition/deficiency of MAO A on serum starvation-induced apoptosis. (A) Overexpressed R1 prevented the apoptosis. (a) R1-stable cell lines showed the prevention of decreased proliferation. MTT assay was performed to determine the proliferation rate between pcDNA3.1-stable and R1-stable cells at different serum starvation time courses, 6, 24, or 48 h. Values were obtained by comparing these cells with their respective controls (in the presence of serum), which were taken as 100% and then further compared between pcDNA3.1-stable cell lines and R1-stable cell lines in serum starvation-induced apoptosis as indicated. (b) R1-stable cells prevented the increased caspase-3 but did not prevent the decreased Bcl-2. Western blot analysis showed the protein expression of caspase-3 and Bcl-2 in pcDNA3.1-stable cells (lanes 1 and 3) or R1-stable cells (lanes 2 and 4) in the presence (lanes 1 and 2) or absence (lanes 3 and 4) of serum. (B) MAO A inhibitor (clorgyline) prevented the apoptosis. (a) MAO A inhibitor prevented the decreased cell proliferation rate. MTT assay was performed to determine the cell proliferation rate between the vehicle-treated group and clorgyline (10−7 M)-treated group at different serum starvation time courses, 6, 24, or 48 h. Values were obtained and compared with their respective controls (in the presence of serum), which were taken as 100% and then further compared between the vehicle-treated group and the clorgyline-treated group in serum starvation-induced apoptosis as indicated. (b) MAO A inhibitor clorgyline (10−7 M; 48 h; lanes 2 and 4) prevented the increase in caspase-3 but did not prevent the decrease in Bcl-2 in serum starvation-induced apoptosis (lanes 3 and 4) as determined by Western blot. (C) The effect of MAO A deficiency on the apoptosis of cortical brain cells. Primary cortical brain cells were isolated from either MAO A/B double KO (lanes 1, 3, and 5) or MAO B KO mice (lanes 2, 4, and 6) and plated in a six-well plate. On day 7, medium was replaced by serum-free medium. Cell numbers in each well were counted on serum starvation days 0, 7, and 14. The cell number before serum starvation (serum starvation day 0) was designated as 100% (lanes 1 and 2). Results are the mean ± SD of data by taking the average of triplicates from each mouse for three mice in each genotype.
When the MAO A inhibitor clorgyline (10−7 M) was present in serum-free medium, results were similar to the effect of overexpression of R1. Clorgyline increased the proliferation rate significantly compared with the control group (Fig. 3Ba). Western blot analysis showed that caspase-3 decreased, whereas R1 and Bcl-2 did not change (Fig. 3Bb, compare lanes 4 and 3). MAO A catalytic activity after clorgyline treatment (10−7 M) for 48 h decreased by ≈30% in either the presence or absence of serum, compared with that of cells treated with vehicle only (Fig. 9, which is published as supporting information on the PNAS web site).
These results suggest that caspase-3, but not Bcl-2, is a downstream target of R1 and MAO A. MAO A is downstream of R1.
Apoptosis Was Reduced in MAO A-Deficient Cortical Brain Cells.
We studied the effect of MAO A in apoptosis by using primary cultures of cortical brain cells isolated from postnatal day 1 MAO A/B double KO and MAO B KO mice. On day 7 (taken as serum starvation day 0), medium was replaced by serum-free medium (Fig. 10, which is published as supporting information on the PNAS web site). Cell numbers in each well were counted at serum starvation days 0, 7, and 14, and values were expressed as percentage of the cell number at serum starvation day 0, which was designated as 100% (Fig. 3C, lanes 1 and 2). The result showed that the number of cortical brain cells was significantly higher than in MAO B KO mice at serum starvation days 7 and 14. This result suggests that there was less apoptosis when MAO A was deficient, consistent with our previous studies (Fig. 3Ba).
In the Presence of Serum R1 Knockdown Decreases Cell Proliferation but Increases MAO A Activity, Whereas Overexpression of R1 Increases Cell Proliferation but Decreases MAO A Activity.
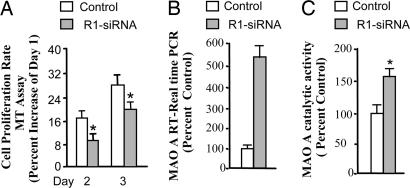
The effect of R1 on proliferation and MAO A activity was studied by small interfering RNA (siRNA)-mediated R1-knockdown UW 228 cells (13). Results showed that the proliferation rate (Fig. 4A) was decreased significantly by ≈35%, and the level of MAO A mRNA (Fig. 4B) or catalytic activity (Fig. 4C) was increased by ≈500% or ≈140% compared with their respective controls, WT UW 228 cells. In contrast, stable expression of R1 in SK-N-BE(2)-C cells showed that the proliferation rate increased significantly, whereas MAO A mRNA and catalytic activity decreased compared with controls (Fig. 11, which is published as supporting information on the PNAS web site). These results suggest that the function of R1 in cell growth may be mediated through the inhibition of MAO A activity.
Fig. 4.
Effects of R1-siRNA on proliferation and MAO A expression. (A) R1-siRNA knockdown decreased proliferation in UW228 cells. MTT assay was performed to determine the proliferation rate between WT and R1 knockdown cells (the human medulloblastoma UW228) on days 2 and 3. Values of decrease in proliferation rate were obtained by comparing MTT values of days 2 or 3 with that of day 1, which was taken as 100% in both WT and R1-siRNA knockdown cells. The percentage decrease of days 2 or 3 as compared with day 1 in each group is shown. R1-siRNA knockdown increased MAO A activity in UW228 cells, which were grown for 3 days. (B and C) MAO A activity was determined by real-time RT–PCR (B) and enzymatic activity assay (C). Values were obtained by comparing R1 knockdown cells with WT cells, which were taken as 100%.
c-Myc Up-Regulates R1 mRNA Expression and Interacts and Colocalizes with R1.
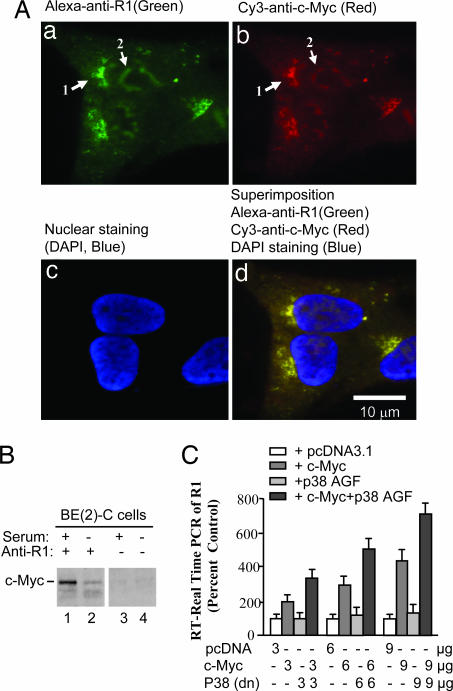
Because the C terminal of R1 shows 87% identity with the c-Myc target protein JPO1 (12), we studied whether R1 interacts with c-Myc. Immunofluorescent analysis shows that R1 (Fig. 5, green) and c-Myc (Fig. 5, red) staining was found in the nucleus and cytosol (Fig. 5A a and b). When cells were incubated with secondary antibody alone background immunoreactivity was displayed (data not shown). Double-staining of both R1 and c-Myc showed specific coexpression of both R1 and c-Myc in cells (Fig. 5Ad), in which overlapping red (R1) and green (c-Myc) turned yellow. In addition, the nucleus was stained by DAPI (blue in Fig. 5Ac). The merged images of nucleus with cytosol are shown in Fig. 5Ad. Next, we determined the interaction between R1 and c-Myc by using coimmunoprecipitation after Western blot. As shown in Fig. 5B, lane 1, R1 interacted with c-Myc physically, and this interaction decreased in cells cultured in serum-withdrawal medium for 2 days (Fig. 5B, compare lanes 2 and 1). Protein extracts without anti-R1 antibody immunoprecipitation are shown as negative controls (Fig. 5B, lanes 3 and 4).
Fig. 5.
The interaction of R1 with c-Myc in SK-N-BE(2)-C cells. (A) R1 was colocalized with c-Myc as demonstrated by immunofluorescence. (a and b) SK-N-BE(2)-C cells were plated on a four-well chamber slide the day before experiment and then fixed and incubated with rabbit anti-R1-antibody (a) or mouse anti-c-Myc antibody (b) followed by fluorescein-conjugated anti-rabbit (green, a) or anti-mouse (red, b) secondary antibody. (c) The stained slides were mounted in the presence of DAPI for nuclear staining (blue). (d) The merged images of R1 (green), c-Myc (red), and nucleus (blue) is shown. (B) R1 interacted with c-Myc as determined by coimmunoprecipitation assay. Nuclear proteins isolated from cells that were cultured in the presence (lanes 1 and 3) or absence (lanes 2 and 4) of serum were immunoprecipitated by incubating with (lanes 1 and 2) or without (lanes 3 and 4) anti-R1 antibody. Protein coimmunoprecipitation with R1 was analyzed by Western blot using anti-c-Myc antibody. (C) c-Myc and dominant negative p38 (p38-AGF) up-regulate R1 mRNA expression. Cells were seeded in a 10-cm dish and transiently transfected with different concentrations of c-MycER, p38-AGF, or both for 48 h. The R1 mRNA level was determined by real-time RT–PCR. Controls were cotransfected with pc-DNA3.1, which was taken as 100%.
We further determined whether R1 gene expression could be induced by c-Myc. Cells were transiently transfected with different concentrations of a chimeric fusion protein (c-MycER) composed of c-Myc and the hormone binding domain of the estrogen receptor (ER). c-MycER remains sequestered in the cytoplasm by heat shock proteins except upon exposure to the estrogen analogue 4-OH-tamoxifen (4-OHT). Twenty-four hours after transfection, 4-OHT was added to the medium for another 24 h. Then the ER portion of the fusion protein would be activated and drive c-Myc into the nucleus (14). The results show that R1 mRNA was increased by overexpression of c-MycER in a concentration-dependent manner, as shown in Fig. 5C.
To test whether p38 and cMyc were antagonizing each other, the dominant negative p38 MAPK expression vector (p38-AGF; ref. 8) was cotransfected with or without c-MycER, and the expression of R1 mRNA levels was determined. The result shows that the induction of R1 mRNA by c-MycER was further increased by inhibiting p38 MAPK (by overexpression of p38-AGF) in a concentration-dependent manner as shown in Fig. 5C. This finding suggests that p38 and cMyc may antagonize one another.
These results provide evidence that R1 interacts with c-Myc directly. c-Myc is an oncogene that enhances cell proliferation by regulating cell-cycle regulators such as cyclin D and the E2F family (15, 16), suggesting that the function of R1 on proliferation may have mechanisms similar to those of c-Myc. Therefore, we determined whether overexpression of R1 could change the expression of cyclin D1 or E2F1 and whether overexpression of c-Myc could inhibit MAO A expression as did R1 in the next experiments.
R1 or c-MycER Decreased MAO A Gene Expression but Increased E2F1 or Cyclin D1 mRNA Levels.
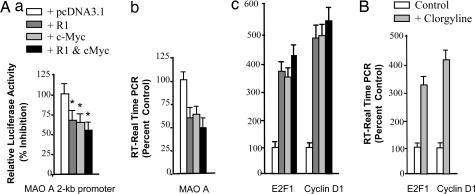
R1, c-MycER, both R1 and c-MycER, or pcDNA 3.1 were cotransfected with MAO A 2-kb promoter-luciferase vector into cells and incubated for 48 h. MAO A promoter activity (Fig. 6Aa) was decreased significantly by overexpression of R1, c-MycER, or both, as compared with that of overexpression of pcDNA3.1. Further, real-time RT–PCR of MAO A (Fig. 6Ab), E2F1, or cyclin D1 (Fig. 6Ac) was performed. As shown in Fig. 6Ab, the mRNA level of MAO A decreased to ≈50%, but that of E2F1 or cyclin D1 (Fig. 6Ac) increased by ≈350–500% upon transfection of R1, c-MycER, or both, compared with that of transfection of pcDNA3.1.
Fig. 6.
Effects of R1, c-MycER, and MAO A inhibitor on gene expression of MAO A, E2F1, and cyclin D1. (A) R1 or c-MycER decreased MAO A expression. (a) R1 or c-MycER decreased MAO A promoter activity as determined by transient transfection and luciferase assay. The MAO A 2-kb promoter-luciferase construct was cotransfected with R1, c-MycER, or both into SK-N-BE(2)-C cells for 48 h. Cells were harvested, and luciferase activity was determined. (b and c) R1 or c-MycER decreased MAO A mRNA level (b) or increased E2F1 or cyclin D1 mRNA level (c) as determined by real-time RT–PCR. R1 or c-MycER was transfected into SK-N-BE(2)-C cells for 48 h. Then mRNA was extracted and subjected to real-time RT–PCR analysis. Controls were cotransfected with pc-DNA3.1, which was taken as 100%. (B) The effect of MAO A on gene expression of E2F1 and cyclin D1. Cells were treated with MAO A inhibitor clorgyline (10−7 M; 48 h), and the mRNA levels of E2F1 and cyclin D1 were determined by real-time RT–PCR. Controls were treated with vehicle, which was taken as 100%.
In addition, we have found that inhibition of MAO A by clorgyline produced the same effect as R1 and cMycER to increase the cell-cycle enhancer cyclin D1/E2F1 (Fig. 6B).
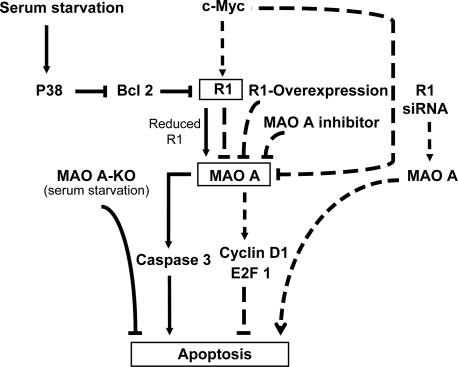
Based on our data, we conclude that after serum starvation-induced apoptosis R1 and MAO A are downstream of p38 kinase and Bcl-2 but upstream of caspase-3, whereas in the c-Myc-mediated cell proliferation pathway, R1 is induced by c-Myc and is upstream of MAO A and cyclin D1/E2F1, as is c-Myc, enhancing proliferation. The schematic representation of the proposed model for the regulation of cell apoptosis and proliferation (antiapoptosis) in SK-N-BE(2)-C cells by MAO A and R1 is depicted in Fig. 7.
Fig. 7.
Proposed signaling pathways of MAO- A and R1-mediated apoptosis in the human neuroblastoma SK-N-BE(2)-C cells. Arrows and dashed lines indicate activation and repression of the following targets, respectively.
Discussion
R1 and MAO A Are Involved in Apoptosis Mediated by Caspase-3.
This study demonstrates that the repressor R1 and its target MAO A are involved in serum starvation-induced p38 kinase-mediated apoptosis, but not in the extracellular signal-regulated kinase or c-Jun N-terminal kinase-mediated signaling pathways. The inhibition of MAO A by clorgyline reduced apoptosis by ≈37% (Fig. 3Ba), suggesting that this pathway contributes to the apoptotic process moderately. Serum starvation-induced apoptosis also activates other pathways, such as p53-dependent and caspase-dependent pathways. The inactivation of p53 by a point mutation in the p53 DNA binding domain and inhibition of caspase activity reduced apoptosis by ≈30% (17) and ≈40% (18), respectively. Although either of them may not have a robotic effect, they are indeed involved in the apoptotic process. Whether these additional apoptotic pathways (p53-dependent and caspase-dependent pathways) participate, serum starvation-induced apoptosis in SK-N-BE(2)-C cells needs to be studied in the future.
MAO inhibitors, at lower concentration, have shown antineuronal apoptosis and neuro-protection effects, independent of MAO inhibition (19–22). Our study using higher concentrations of MAO A inhibitor, which inhibits MAO A catalytic activity, also produced effects on antineuronal apoptosis and neuro-protection. Therefore, these studies suggest that the effects of antiapoptosis and neuro-protection by an MAO inhibitor may be achieved by inhibition of both MAO and other mechanisms.
The involvement of MAO A in neuronal apoptosis suggests the role of MAO A in neurodegenerative diseases and psychiatric disorders to be more than just oxidizing the neurotransmitters. Further studies in this direction may be fruitful.
R1 and c-Myc Enhance Proliferation via Similar Mechanisms.
The transcription factor c-Myc is a well known oncogene (23, 24), which enhances cell proliferation by regulating cell-cycle regulators, including cyclin D1 and E2F1 (15, 16). Our data provide evidence that R1 interacts and colocalizes with c-Myc in SK-N-BE(2)-C cells. Further, R1 can increase the expression of cyclin D1 and E2F1 as that of c-Myc. Recently, R1 has been reported to potentiate c-Myc-mediated transforming activity of medulloblastoma, which is the most common malignant pediatric tumor. R1 could also complement a transformation-defective c-Myc mutant in human medulloblastoma cells (13).
Our study shows that c-Myc induces R1 gene expression and inhibits the human MAO A promoter and mRNA levels. These results support the notion that R1 and MAO A play important roles in medulloblastoma tumor development and in cell growth in general.
Taken together, our results indicate that we have uncovered a signaling pathway in the regulation of cell growth mediated by R1 and MAO A. In serum starvation-induced apoptosis, p38 kinase and Bcl-2 are upstream signals, and caspase-3 is a downstream target of R1 and MAO A. In mediating cell proliferation, R1 is induced by the oncogene c-Myc, interacts with c-Myc, and increases cell proliferation via similar mechanisms as c-Myc, in which both R1 and c-Myc inhibit MAO A. This inhibition of MAO A leads to an increase in the expression of cell-cycle enhancers E2F1 and cyclin D1.
Materials and Methods
Cell Lines, Reagents, and DNA Plasmids.
The human neuroblastoma SK-N-BE(2)-C cell line was grown in a medium containing a 1:1 mixture of Eagle’s minimum essential medium with Earle’s BSS and Ham’s F12 medium with 2.5 mM l-glutamine and 10% FBS. The human medulloblastoma UW228 cell line, both WT and siRNA-mediated R1 knockdown, was a gift from Annie Huang, University of Toronto, Toronto (13). UW228 cells were maintained in α-MEM with 10% FBS. All antibodies used were purchased from Santa Cruz Biotechnology. The p38 kinase inhibitor, PD169316, and MAO A inhibitor, clorgyline, were purchased from Sigma. MAO A promoter-luciferase constructs were generated as described (12). The c-MycER and the dominant negative p38 MAPK (p38-AGF) were gifts from Chi V. Dang (The Johns Hopkins University School of Medicine, Baltimore) and Roger Davis (University of Massachusetts Medical Center, Worcester), respectively.
Withdrawal of Growth Factors (Serum Starvation) and Treatments with p38 Kinase Inhibitor or MAO A Inhibitor.
In a six-well plate, 104 SK-N-BE(2)-C cells per well were plated in medium supplemented with 10% FCS. After 24 h, cells were cultured either in medium without serum or medium containing drugs, PD169316 (p38 kinase inhibitor, 10−6 M) or clorgyline (MAO A inhibitor, 10−7 M). Over the course of a 48-h treatment, both the serum-free medium and medium containing drugs were changed daily. Then cells were collected for cell viability evaluation and measurement of apoptotic marker proteins and MAO A activity.
MTT Assay for Proliferation Rate/Cell Viability Evaluation.
Cells were grown in a six-well plate. The medium in excess of 2 ml per well was removed, and 60 μl of MTT dye (5 mg/ml) in sterile PBS was added to 600 μl of medium in each well (final concentration 0.5 mg/ml). Plates were incubated for 4 h, during which time the mitochondria in living cells converted the soluble yellow dye into an insoluble purple crystal. Cells and dye were then solubilized by the addition of 1.4 ml of DMSO per well. Optical density of each well at 570 nm was determined in a spectrophotometric analyzer (Shimadzu).
Transfection.
In generating the R1-stable cell line, SK-N-BE(2)-C cells were plated at a density of 5 × 10⁶ cells in a 10-cm dish. The next day the R1 expression vector or pcDNA3.1 was transfected into cells with a superfect transfection reagent (25). After 24 h, cells were replated onto 5-cm dishes, and Geneticin (G418; 600 μg/ml) was added. Resistant clones were isolated into separate dishes after 6 days and cultured under continuous G418 selection. Three independent R1-stable cell lines were generated and used in each experiment.
To determine the effects of R1 and/or c-MycER on MAO A, E2F1, and cyclin D1 mRNA expression, transient transfections were performed. Briefly, cells were plated at a density of 5 × 10⁵ in a 10-cm dish and grown until 60% confluent. R1 expression vector or c-MycER (1.5 μg) or 0.75 μg of each vector was transfected into cells by superfect transfection reagent for 48 h. Then the cells were subject to real-time RT-PCR.
For transient transfection and luciferase assay, 0.5 μg of MAO A 2-kb promoter-luciferease construct was cotransfected with R1 or c-MycER expression vector into cells. The total amount of DNA for each transfection was kept constant by the addition of empty expression vector pcDNA3.1. After 48 h of transfection, cells were harvested and luciferase activities were determined.
Real-Time PCR.
In a 10-cm dish, 105 cells were grown for 24 h, then cultured in the medium without serum for 1, 2, or 3 days or transfected with R1, cMycER, both expression vectors, or pcDNA3.1 and incubated for 48 h. Then total RNA was isolated from each group by using RNA isolation reagent (Invitrogen). The mRNAs were reverse-transcribed into cDNAs. Specific primers for the human R1, MAO A, E2F1, or cyclin D1 genes were designed as follows: R1 sense, 5′-GGAACCGCTATGGGGAGGATGTC-3′, antisense, 5′-TGGTGTAGGTGGCTGGTTCTGTTTG-3′; MAO A sense, 5′-CGTGATCGGAGGTGGCATTTC-3′, antisense, 5′-AAAGGCGCCCCGAAATGG-3′; E2F1, sense, 5′-GCCGGCCCCTGCGACCCTGAC-3′, antisense, 5′-CAGCACCTCGGCAGCCCAGTTCAG-3′; and cyclin D1, sense, 5′-GCGCGTACCCCGATGCCAACC-3′, antisense, 5′-TCGGGCCGGATGGAGTTGTCG-3′.
The mRNA amount for each group was analyzed by real-time RT-PCR using a Bio-Rad iCycler system. The real-time PCR was performed with a SYBR supermix kit (Bio-Rad), and the GAPDH mRNA primer was included in every plate to avoid sample variations. A ΔCT value was then calculated as described (25).
MAO A Catalytic Activity Assay.
In a 30-cm dish, 105 cells were plated in medium supplemented with 10% FBS. After 24 h, cells were cultured in medium with or without serum for 1, 2, or 3 days and harvested in PBS (pH 7.4). After centrifugation, the cell pellet was resuspended in 800 μl of assay buffer (50 mM sodium phosphate buffer, pH 7.4) and sonicated. A total of 200 μg of total protein from cells was incubated with 100 μM [14C]serotonin in the assay buffer. The reaction products were extracted and its radioactivity was measured as described (26).
Western Blot Analysis.
Cells were cultured in medium without serum, treated with PD169316 (p38 kinase inhibitor) for 2 days, washed by PBS (pH 7.4), and sonicated in 500 μl of RIPA lysis buffer (10 mM Tris·HCl, pH 7.4/160 mM NaCl/1% Triton/1% Na dexycholate/0.1% SDS/1 mM EDTA/1 mM EGTA) supplemented with protease inhibitors (Sigma). Twenty micrograms of total protein was separated by 10% SDS/PAGE and transferred to nitrocellulose membranes. The membranes were then incubated with anti-MAO A (1/1,000), anti-R1 (1/5,000), anti-p38 kinase (1/500), anti-caspase-3 (1/500), or anti-Bcl-2 (1:500) antibody overnight at 4°C. The secondary antibody (1/5,000–1/10,000) and chemiluminescence procedures were conducted as described (25).
Primary Cultures.
Primary cultures were made by using cortical brain cells from postnatal day 1 MAO A/B double KO (7) and MAO B KO mice (6), which were obtained by breeding heterozygous MAO A/B double KO female mice (MAO A +/−; MAO B −/−) and homozygous MAOA/B double KO (MAO A −/y; MAO B −/y) male mice. The use of animals was approved by the Institutional Animal Care and Use Committee at the University of Southern California.
The brain cortex was treated with 0.05% trypsin in PBS at 37°C. The dissociated cells were collected through a series of centrifugations in soluble trypsin-digestion solution. Pellets containing dissociated cells were resuspended in DMEM with 10% FBS. Approximately 103 cells were plated into each well of poly-d-lysine (10 μg/ml)-coated six-well plates for morphological analysis and cell number counts. On day 7, medium was replaced by serum-free medium; this was designated as serum starvation day 0. The serum-free medium was changed every 2 days, and cell numbers in each well were counted on serum starvation days 0, 7, and 14. A total of five random fields per well were counted by using a ×20 objective in an inverted microscope.
Immunofluorescence.
SK-N-BE(2)-C cells were plated on a four-well chamber slide (Nalge) the day before immunostaining. Then cells were fixed in 4% paraformaldehyde in PBS for 20 min and double-immunostained by rabbit polyclonal anit-R1 antibody and mouse monoclonal anti-c-Myc antibody and visualized with Alexa-conjugated anti-rabbit (green) and Cy3-conjugated anti-mouse (red) secondary antibodies (27).
Coimmunoprecipitation.
SK-N-BE(2)-C cells (3 × 10⁶) were treated with or without serum starvation for 48 h. Then cells were washed in PBS (pH 7.4) and sonicated in 500 μl of RIPA lysis buffer. After centrifugation, the supernatant was dialyzed for 4 h at 4°C against 1 liter of immunoprecipitation buffer (50 mM Hepes buffer, pH 7.4/150 mM KCl/1 mM EDTA/1 mM DTT/0.5% Nonidet P-40) supplemented with protease inhibitors and lyophilized.
Proteins (≈400 μg/ml) were immunoprecipitated by incubating with rabbit anti-R1 antibody (with BioMag anti-rabbit magnetic beads; Qiagen, Valencia, CA) overnight at 4°C in immunoprecipitation (IP) buffer. Then the beads and bound proteins were pelleted by centrifugation and washed three times with 1 ml of IP buffer. Proteins were eluted from the beads by boiling them in SDS sample buffer and analyzed by Western blot with mouse anti-c-Myc antibody.
Statistical Analysis.
The statistical significance was evaluated with Student’s t test for two-group comparisons when needed. A value of P < 0.05 (as indicated by ∗ in figures) was considered significant.
Supplementary Material
Acknowledgments
We thank Dr. Annie Huang for the R1-knockdown UW228 cell lines, Dr. Chi V. Dang for the MycER fusion protein expression vector, and Dr. Roger Davis for the dominant negative p38 MAPK expression vector. This work was supported by National Institute of Mental Health Grants R37 MH39085 (MERIT Award) and R01 MH67968 and the Boyd and Elsie Welin Professorship.
Abbreviations
- MAO
monoamine oxidase
- siRNA
small interfering RNA
- KO
knockout
- MAPK
mitogen-activated protein kinase
- MTT
3-(4,5-dimethylthiazol-2-yl)-2,5-diphenyl tetrazolium bromide
- ER
estrogen receptor.
Footnotes
Conflict of interest statement: No conflicts declared.
This paper was submitted directly (Track II) to the PNAS office.
References
- 1.Bach A. W., Lan N. C., Johnson D. L., Abell C. W., Bembenek M. E., Kwan S. W., Seeburg P. H., Shih J. C. Proc. Natl. Acad. Sci. USA. 1988;85:4934–4938. doi: 10.1073/pnas.85.13.4934. [DOI] [PMC free article] [PubMed] [Google Scholar]
- 2.Lan N. C., Heinzmann C., Gal A., Klisak I., Orth U., Lai E., Grimsby J., Sparkes R. S., Mohandas T., Shih J. C. Genomics. 1989;4:552–559. doi: 10.1016/0888-7543(89)90279-6. [DOI] [PubMed] [Google Scholar]
- 3.Shih J. C., Chen K., Ridd M. J. Annu. Rev. Neurosci. 1999;22:197–217. doi: 10.1146/annurev.neuro.22.1.197. [DOI] [PMC free article] [PubMed] [Google Scholar]
- 4.Hauptmann N., Grimsby J., Shih J. C., Cadenas E. Arch. Biochem. Biophys. 1996;335:295–304. doi: 10.1006/abbi.1996.0510. [DOI] [PubMed] [Google Scholar]
- 5.Cases O., Seif I., Grimsby J., Gaspar P., Chen K., Pournin S., Muller U., Aguet M., Babinet C., Shih J. C. Science. 1995;268:1763–1766. doi: 10.1126/science.7792602. [DOI] [PMC free article] [PubMed] [Google Scholar]
- 6.Grimsby J., Toth M., Chen K., Kumazawa T., Klaidman L., Adams J. D., Karoum F., Gal J., Shih J. C. Nat. Genet. 1997;17:206–210. doi: 10.1038/ng1097-206. [DOI] [PubMed] [Google Scholar]
- 7.Chen K., Holschneider D. P., Wu W., Rebrin I., Shih J. C. J. Biol. Chem. 2004;279:39645–39652. doi: 10.1074/jbc.M405550200. [DOI] [PMC free article] [PubMed] [Google Scholar]
- 8.Wong W. K., Ou X. M., Chen K., Shih J. C. J. Biol. Chem. 2002;277:22222–22230. doi: 10.1074/jbc.M202844200. [DOI] [PMC free article] [PubMed] [Google Scholar]
- 9.De Zutter G. S., Davis R. J. Proc. Natl. Acad. Sci. USA. 2001;98:6168–6173. doi: 10.1073/pnas.111027698. [DOI] [PMC free article] [PubMed] [Google Scholar]
- 10.Malorni W., Giammarioli A. M., Matarrese P., Pietrangeli P., Agostinelli E., Ciaccio A., Grassilli E., Mondovi B. FEBS Lett. 1998;426:155–159. doi: 10.1016/s0014-5793(98)00315-9. [DOI] [PubMed] [Google Scholar]
- 11.Yi H., Akao Y., Maruyama W., Chen K., Shih J., Naoi M. J. Neurochem. 2006;96:541–549. doi: 10.1111/j.1471-4159.2005.03573.x. [DOI] [PubMed] [Google Scholar]
- 12.Chen K., Ou X. M., Chen G., Choi S. H., Shih J. C. J. Biol. Chem. 2005;280:11552–11559. doi: 10.1074/jbc.M410033200. [DOI] [PMC free article] [PubMed] [Google Scholar]
- 13.Huang A., Ho C. S., Ponzielli R., Barsyte-Lovejoy D., Bouffet E., Picard D., Hawkins C. E., Penn L. Z. Cancer Res. 2005;65:5607–5619. doi: 10.1158/0008-5472.CAN-05-0500. [DOI] [PubMed] [Google Scholar]
- 14.Prescott J. E., Osthus R. C., Lee L. A., Lewis B. C., Shim H., Barrett J. F., Guo Q., Hawkins A. L., Griffin C. A., Dang C. V. J. Biol. Chem. 2001;276:48276–48284. doi: 10.1074/jbc.M107357200. [DOI] [PubMed] [Google Scholar]
- 15.Mateyak M. K., Obaya A. J., Sedivy J. M. Mol. Cell. Biol. 1999;19:4672–4683. doi: 10.1128/mcb.19.7.4672. [DOI] [PMC free article] [PubMed] [Google Scholar]
- 16.Santoni-Rugiu E., Jensen M. R., Thorgeirsson S. S. Cancer Res. 1998;58:123–134. [PubMed] [Google Scholar]
- 17.Bai L., Merchant J. L. Mol. Cell. Biol. 2001;21:4670–4683. doi: 10.1128/MCB.21.14.4670-4683.2001. [DOI] [PMC free article] [PubMed] [Google Scholar]
- 18.Schamberger C. J., Gerner C., Cerni C. Exp. Cell Res. 2005;302:115–128. doi: 10.1016/j.yexcr.2004.08.026. [DOI] [PubMed] [Google Scholar]
- 19.Maruyama W., Takahashi T., Youdim M., Naoi M. J. Neural Transm. 2002;109:467–481. doi: 10.1007/s007020200038. [DOI] [PubMed] [Google Scholar]
- 20.Youdim M. B., Bar Am O., Yogev-Falach M., Weinreb O., Maruyama W., Naoi M., Amit T. J. Neurosci. Res. 2005;79:172–179. doi: 10.1002/jnr.20350. [DOI] [PubMed] [Google Scholar]
- 21.Yu P. H., Davis B. A., Fang J., Boulton A. A. J. Neurochem. 1994;63:1820–1828. doi: 10.1046/j.1471-4159.1994.63051820.x. [DOI] [PubMed] [Google Scholar]
- 22.Maruyama W., Boulton A. A., Davis B. A., Dostert P., Naoi M. J. Neural. Transm. 2001;108:11–24. doi: 10.1007/s007020170093. [DOI] [PubMed] [Google Scholar]
- 23.Campisi J., Gray H. E., Pardee A. B., Dean M., Sonenshein G. E. Cell. 1984;36:241–247. doi: 10.1016/0092-8674(84)90217-4. [DOI] [PubMed] [Google Scholar]
- 24.Keath E. J., Kelekar A., Cole M. D. Cell. 1984;37:521–528. doi: 10.1016/0092-8674(84)90382-9. [DOI] [PubMed] [Google Scholar]
- 25.Ou X. M., Chen K., Shih J. C. J. Biol. Chem. 2004;279:21021–21028. doi: 10.1074/jbc.M312638200. [DOI] [PubMed] [Google Scholar]
- 26.Geha R. M., Rebrin I., Chen K., Shih J. C. J. Biol. Chem. 2001;276:9877–9882. doi: 10.1074/jbc.M006972200. [DOI] [PubMed] [Google Scholar]
- 27.Ou X. M., Lemonde S., Jafar-Nejad H., Bown C. D., Goto A., Rogaeva A., Albert P. R. J. Neurosci. 2003;23:7415–7425. doi: 10.1523/JNEUROSCI.23-19-07415.2003. [DOI] [PMC free article] [PubMed] [Google Scholar]
Associated Data
This section collects any data citations, data availability statements, or supplementary materials included in this article.


