Abstract
As an approach to create versatile model systems of the biological membrane we have recently developed a novel micropatterning strategy of substrate-supported planar lipid bilayers (SPBs) based on photolithographic polymerization of a diacetylene phospholipid, 1,2-bis(10,12-tricosadiynoyl)-sn-glycero-3-phosphocholine. The micropatterned SPBs are composed of a polymeric bilayer matrix and embedded fluid lipid bilayers. In this study, we investigated the incorporation of fluid bilayers into micropatterned polymeric bilayer matrices through the adsorption and reorganization of phospholipid vesicles (vesicle fusion). Total internal reflection fluorescence microscopy observation showed that vesicle fusion started at the boundary of polymeric bilayers and propagated into the central part of lipid-free regions. On the other hand, quartz crystal microbalance with dissipation monitoring revealed that the transformation from adsorbed vesicles into SPBs was significantly accelerated for substrates with micropatterned polymeric bilayers. These results indicate that the edges of polymeric bilayers catalyze the formation of SPBs by destabilizing adsorbed vesicles and also support the premise that polymeric bilayers and embedded fluid bilayers are forming a continuous hybrid bilayer membrane, sealing energetically unfavorable bilayer edges.
INTRODUCTION
Substrate-supported planar lipid bilayers (SPBs) are potentially useful models of cell membranes in both biotechnological applications and scientific studies (1,2). They are composed essentially of a lipid bilayer membrane adsorbed on the surface of a substrate by physical interactions or chemical bonds. SPBs have some unique features compared with other formats of model membranes (lipid vesicles, black lipid membranes, etc.), including mechanical stability (in contrast to black lipid membranes) and the accessibility to various analytical techniques that can detect interfacial events with an extremely high sensitivity (e.g., total internal reflection fluorescence microscopy (TIR-FM), surface plasmon resonance (SPR), atomic force microscopy (AFM), and quartz crystal microbalance with dissipation monitoring (QCM-D)) (3–10). These features render SPBs highly attractive for the development of devices that utilize artificially mimicked cellular functions. Another important feature of SPBs is the potential to generate micropatterned membranes on the substrate (11). This aspect allows the creation of designed microarrays of model membranes and should facilitate various new applications such as high-throughput drug screening using arrayed receptors. A variety of micropatterning approaches have been reported, including mechanical scratching (12), prepatterned substrates (13–16), microcontact printing (17), microfluidics (18,19), inkjet printers (20), liftoff of prepatterned polymer films (21), and photolithographic deep ultraviolet (UV) decomposition of SPBs (22).
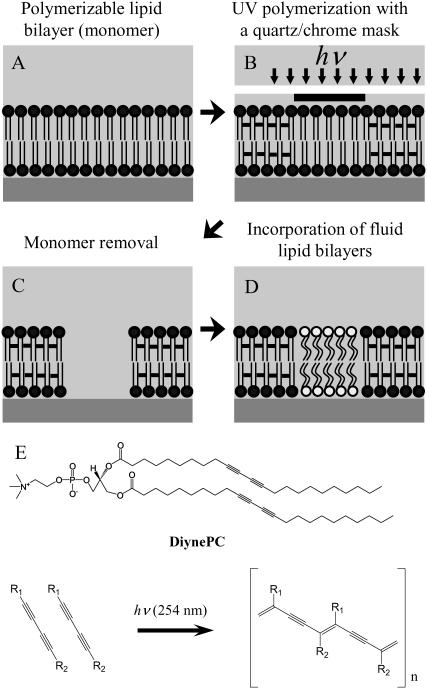
We have recently reported a novel micropatterning method of SPBs based on photolithographic polymerization of diacetylene-containing phospholipid (1,2-bis(10,12-tricosadiynoyl)-sn-glycero-3-phosphocholine (DiynePC)) (23–26). The fabrication process comprises four steps (a schematic illustration is given in Fig. 1): A), formation of a bilayer consisting of DiynePC monomers on a solid substrate, B), photolithographic polymerization by UV light, C), removal of the protected monomers, and D), refilling the lipid-free regions with new lipid bilayers. Fig. 1 E shows the chemical structure of diacetylene phospholipid DiynePC and its polymerization scheme. The most important feature of this micropatterning strategy is the fact that polymeric and fluid lipid bilayers are forming a hybrid bilayer structure. Polymeric lipid bilayer domains should act not only as a barrier to confine fluid lipid bilayers in defined areas but also as a framework to support embedded membranes. On the other hand, the fluid bilayers retain some characteristic features of native cellular membranes (e.g., lateral mobility of membrane-associated molecules) and are intended to be used for further biological applications.
FIGURE 1.
(A–D) Schematic outline of the bilayer patterning procedure. (E) The chemical structure of polymerizable diacetylene phospholipid, DiynePC, and its photopolymerization scheme.
Incorporation of fluid bilayers into the matrix of polymeric bilayer is generally achieved by the adsorption and subsequent reorganization of phospholipid vesicles on the substrate (27,28). This self-assembly process (vesicle fusion) is essentially important for the micropatterning strategy here because it ensures the integration of polymeric and fluid lipid bilayers. Therefore, we have conducted a detailed study of the vesicle fusion process in the presence of micropatterned polymeric bilayers. We applied TIR-FM and QCM-D techniques to assess the transformation microscopically and kinetically. Both techniques showed unambiguously that the transformation from spherical vesicles into SPBs was significantly accelerated by the presence of preformed polymeric bilayers. These results indicate that formation of SPBs at the boundary of polymeric bilayers was promoted because it effectively shielded the energetically unfavorable open edge structure of the polymeric bilayers. We discuss the implications of the obtained results to the fabrication strategy of micropatterned biomimetic membranes.
MATERIALS AND METHODS
Materials
Diacetylene phospholipid (DiynePC) and phosphatidylcholine from egg yolk (egg-PC) were purchased from Avanti Polar Lipids (Alabaster, AL). Texas Red 1,2-dihexadecanoyl-sn-glycero-phosphoethanolamine (TR-DHPE) was purchased from Molecular Probes (Eugene, OR). Sodium dodecyl sulfate (SDS) was purchased from Nacalai Tesque (Kyoto, Japan). All purchased chemicals were reagent grade and used without further purification. The deionized water used in the experiments was ultrapure Milli-Q water (Millipore, Bedford, MA) with a resistance of 18.2 MΩ cm. It was used for cleaning the substrates and preparing the buffer solution (0.01 M phosphate buffer with 0.15 M NaCl, pH 6.6).
Substrate cleaning
Microscopy coverslips and glass slides (Matsunami, Osaka, Japan) were used as substrates for fluorescence microscopy observation. The substrates were cleaned first with a commercial detergent solution, 0.5% Hellmanex/water (Hellma, Mühlheim, Germany) for 20 min under sonication, rinsed with deionized water, treated in a solution of 0.05:1:5 NH4OH (28%)/H2O2 (30%)/H2O for 10 min at 65°C, rinsed again with deionized water extensively, and then dried in a vacuum oven for 30 min at 80°C. This protocol resulted in clean and hydrophilic surfaces for the adsorption of lipid bilayer membranes.
For the substrate of QCM-D monitoring, QCM sensor crystals with a thin SiO2 layer were used (Q-sense, Göteborg, Sweden). The sensor crystals were cleaned in 0.1 M SDS solution (immersed for 30 min at 30°C), rinsed with deionized water, dried under a nitrogen stream, and further cleaned by the UV/ozone treatment for 20 min (PL16-110, Sen Lights, Toyonaka, Japan).
Preparation of patterned DiynePC bilayers
Polymerizable bilayers of monomeric DiynePC were deposited onto substrates from the air/water interface by the Langmuir-Blodgett (LB) and subsequent Langmuir-Schaefer (LS) methods using a Langmuir trough (HBM-AP, Kyowa Interface Science, Asaka, Japan). Monomeric DiynePC was spread onto the subphase (deionized water) from a chloroform solution. After evaporation of the solvent (30–45 min), the monolayer was compressed to the surface pressure of 34 mN/m. While keeping the surface pressure constant, the monolayer was transferred onto the cleaned substrates. The first monolayer was deposited by dipping and withdrawing the substrate vertically (LB method). The second leaflet was deposited onto the hydrophobic surface of the first monolayer by pressing the substrate horizontally through the monolayer at the air/water interface and dropping it into the subphase (LS method). After the deposition of the second monolayer, the substrates were collected from the trough and stored in deionized water (in the dark) for the polymerization.
Polymerization of DiynePC bilayers was conducted by UV irradiation using a mercury lamp (UVE-502SD, Ushio, Tokyo, Japan) as the light source. The polymerization was conducted in a closed system that was composed of a deionized water reservoir, a pump, and a cell (∼4-ml volume). The water reservoir was depleted of oxygen by purging it with argon. Oxygen-free water was circulated continuously by the pump through the cell where polymerization of the bilayers was conducted. The cell had two walls on opposite sides, one being the sample (the monomeric DiynePC bilayer was inside the cell) and the other being a quartz window through which UV light was illuminated. Desired patterns were transferred to the DiynePC bilayer in the polymerization process by illuminating the sample through a mask (a quartz slide with a patterned chromium layer coating) which was placed directly on the DiynePC bilayer. After sufficient circulation of deaerated water (typically for 15 min), the pump was stopped and the polymerization was started. The applied UV intensity was typically 10 mW/cm2 at 254 nm. The irradiation dose was 4 J/cm2, which was previously shown to be sufficient to form a cross-linked polymeric DiynePC bilayer (26). After the UV irradiation, nonpolymerized DiynePC molecules were removed from the substrate surface by the treatment in 0.1 M SDS solution at 30°C for 30 min and then rinsed with deionized water extensively. The patterned polymeric DiynePC substrates were stored in deionized water in the dark at 4°C.
Preparation of patterned chromium substrates
Patterned chromium substrates were fabricated as follows. A chromium layer (∼100-nm thick) was deposited by sputtering on cleaned coverslips (rate 0.3 nm/s, 0.3 Pa of argon gas, Rikensya RSP-4-RF5/DC5, Osaka, Japan). Positive photoresist (AZ 1500 20 cP, Clariant, Muttenz, Switzerland) was spin-coated on the coverslip with the thickness of 1 μm. The substrates were exposed to a UV light through a mask (placed directly on the surface), and the photoresist material in the exposed area was dissolved by the developing agent (AZ 300 MIF, Clariant). The patterned substrates were then immersed in a chromium etchant solution ((NH4)2Ce(NO3)6/HClO4/H2O) for 120 s and then rinsed with deionized water for 30 s. Patterned chromium substrates were obtained by removing the residual photoresists by the treatment in acetone and UV/ozone cleaning.
Preparation of lipid vesicles
Vesicle suspensions of 1 mM egg-PC (containing TR-DHPE fluorescence marker) were prepared according to the following protocol. (Egg-PC is a mixture of various phosphocholines. Therefore, we used the average molecular weight given by the manufacturer (760.08) for the calculation of concentrations.) Lipids were mixed in a chloroform solution, then dried under a stream of nitrogen, and subsequently evaporated at least for 4 h in a vacuum desiccator. The dried lipids were hydrated in a buffer solution overnight. The resulting multilamellar vesicles were put through five freeze/thaw cycles. The vesicle suspensions were stored in the dark at 4°C and extruded by using a LiposoFast extruder (Avestin, Ottawa, Canada) just before use, 10 times through a polycarbonate filter with 100-nm pores, and subsequently 15 times through a polycarbonate filter with 50-nm pores. The extruded vesicle suspensions were diluted with a buffer solution before the experiments.
Fluorescence microscopic observation of the vesicle fusion process
For the TIR-FM observation, an OLYMPUS IX81 inverted microscope with a 60× PlanApo TIRFM oil immersion objective (numerical aperture (NA) 1.45, Olympus, Tokyo, Japan) was used. An argon ion laser (excited 488 nm) was used as the light source. Fluorescence images were obtained with a charge-coupled device (CCD) camera (C4742-95-12ERG, Hamamatsu Photonics, Hamamatsu, Japan) and processed with the Meta-Vue program (Molecular Devices, Sunnyvale, CA). The observation was performed with a circular Teflon cell (diameter 2 cm). The substrate was mounted at the bottom of the cell, and the buffer solution was added from the top. Then vesicle suspensions were injected with a micropipette.
For measuring the time course of SPB formation, we used a flow cell in which solutions could be exchanged. The cell was made of a coverslip and a substrate fixed to each other with double-sided adhesive tapes so that there was a narrow opening for inlet and outlet of the solutions. The solutions were placed at the inlet with a micropipette and sucked with a filter paper at the outlet. Fluorescence on the substrate surface was observed by using an Olympus BX51WI upright microscope with a 60× water immersion objective (NA 0.90, Olympus) and a xenon lamp (AH2-RX-T, Olympus). Fluorescence microscopy images were collected with a CCD camera (DP30BW, Olympus), and the area that exceeded the threshold fluorescence intensity was calculated with the MetaMorph program (Molecular Devices).
QCM-D measurements of the vesicle fusion process
QCM-D measurements were performed by using a Q-Sense D300 system with a QAFC 302 axial flow chamber (Q-Sense). The QCM sensor crystal was oscillated at its resonance frequency of 5 MHz and at three harmonics (15, 25, and 35 MHz), and the frequency shift (Δf) and dissipation (ΔD) were monitored. The interval for data acquisition was 0.4 s. The mounted QCM sensor crystal was equilibrated with a degassed buffer solution at 21.8°C. The buffer solution was subsequently replaced with the vesicle suspension (lipid concentration 140 μM). Some sensors were coated with a polymeric DiynePC bilayer. The bilayers were polymerized either homogeneously or with a stripe pattern (the same lithographic procedures as described above), and monomers were removed with 0.1 M SDS at 30°C. The width of line patterns was 10 μm, 20 μm, 50 μm, 100 μm, or 200 μm. The sensors with preformed DiynePC bilayers were stored in deionized water until they were used for the QCM-D measurements. After the QCM-D measurements, each sensor surface was observed by the fluorescence microscopy, using an OLYMPUS BX51WI upright microscope with a 60× water immersion objective (NA 0.90, Olympus) and a xenon lamp (AH2-RX-T, Olympus). Fluorescence microscopy images were collected with a CCD camera (DP30BW, Olympus) and processed with the MetaMorph program (Molecular Devices).
RESULTS
TIR-FM observation of the vesicle fusion process
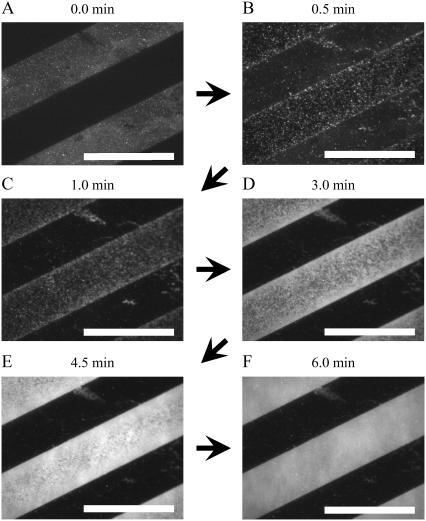
Fig. 2 shows the TIR-FM images during the vesicle fusion process on a patterned DiynePC bilayer substrate (20-μm stripes). The bright regions in Fig. 2 A are preformed DiynePC bilayers before the addition of vesicle suspensions. The fluorescence arises from the conjugated polydiacetylene backbones of DiynePC bilayers. The dark stripes are the lipid-free regions (glass surface). Fig. 2, B–F, shows the images obtained after adding vesicle suspensions of 100 μM egg-PC containing 1 mol % TR-DHPE. It should be noted that we did not actively mix the solution during the TIR-FM observation. Therefore, the time necessary for vesicle fusion was determined to a large extent by free diffusion of vesicles. However, we assume a homogeneous distribution of vesicles within the area observed by TIR-FM. The vesicles adsorbed preferentially onto the glass surface between patterned DiynePC bilayers (Fig. 2 B). The fluorescent dots should be either individual vesicles or patches of SPB formed by the rupture of vesicles. There is a slight accumulation of fluorescent dots near the boundaries of DiynePC bilayers. These are presumably planar bilayers (not intact vesicles) because we did not observe preferential adsorption of vesicles at the boundaries (vide infra). Formation of planar bilayers near the boundaries became more clearly visible by the appearance of homogeneously fluorescent domains (Fig. 2 C). The SPB domains subsequently expanded to the central regions (Fig. 2, D and E) and finally covered the whole surface between DiynePC bilayers (Fig. 2 F).
FIGURE 2.
TIR-FM images of the vesicle fusion process on a glass substrate with patterned DiynePC bilayer. (A) Before the addition of vesicles: The bright stripes are preformed DiynePC bilayers. (B–F) Time lapse images after the addition of egg-PC vesicles containing 1 mol % TR-DHPE: Vesicles adsorbed preferentially on the glass surface (B). Homogeneously fluorescent domains of SPBs were formed at the boundaries of DiynePC bilayer (C) and expanded to the central region (D and E), finally covering the glass surface completely (F). The scale bars correspond to 40 μm. The elapsed time is given at the top of each image.
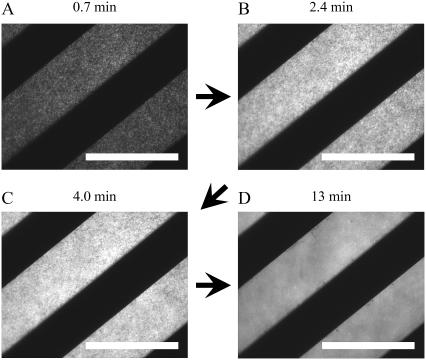
As a comparison to DiynePC bilayers, vesicle fusion on a glass substrate with patterned chromium (20-μm stripes) was observed (Fig. 3). The dark stripes are patterned chromium. In this case, addition of 100 μM egg-PC (containing 1 mol % TR-DHPE) resulted in random adsorption and rupture of vesicles on the glass surface (Fig. 3, A–C), and SPBs finally covered the whole areas between patterned chromium stripes (Fig. 3 D). Egg-PC vesicles adsorbed also on the chromium layer surfaces, which could not be observed by using TIR-FM. Separately, we observed the vesicles on patterned chromium stripes by using the upright fluorescence microscopy (data not shown). The continuity and fluidity of adsorbed lipid layers were assessed by locally photobleaching the fluorescence marker (TR-DHPE) and observing fluorescence recovery. Fluorescence of lipid layers on the chromium stripes did not recover after photobleaching, indicating that they are vesicles. On the other hand, fluorescence recovery was clearly observed for lipid layers adsorbed on the glass surface between the chromium stripes, indicating that they are continuous and fluid SPBs.
FIGURE 3.
TIR-FM images of the vesicle fusion process on a glass substrate with a patterned chromium layer. Egg-PC vesicles containing 1 mol % TR-DHPE were added, and time lapse images were obtained. Vesicles adsorbed on the surface between patterned chromium stripes randomly (A). Increase of the adsorbed vesicles led to the formation of bilayer disks (B and C), finally covering the glass surface completely (D). The scale bars correspond to 40 μm. The elapsed time is given at the top of each image.
Visualization of the vesicle fusion process by using self-quenching vesicles
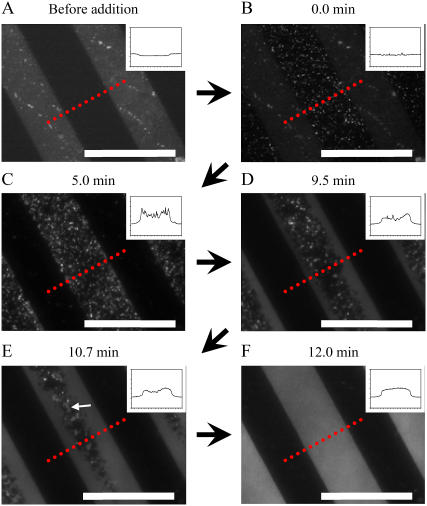
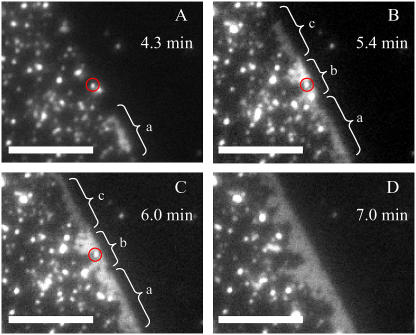
Although the TIR-FM observation in Fig. 2 shows the general process of vesicle fusion on a patterned substrate, distinction between adsorbed vesicles and SPB patches is rather difficult, especially at the initial stage of vesicle fusion. To distinguish between adsorbed vesicles and SPB disks, we conducted vesicle fusion experiments using egg-PC vesicles with 30 mol % TR-DHPE. At this high concentration of the fluorophore, its fluorescence is highly quenched (self-quenching). We could visualize the formation of SPBs as an increased fluorescence intensity (dequenching). (The same technique was previously applied by Johnson et al. to elucidate the vesicle fusion mechanism (4).) For the TIR-FM observation, a very low concentration of the labeled vesicle suspension (0.1-μM lipid concentration) was first applied to the patterned DiynePC substrate, resulting in a low surface coverage (Fig. 4 B). The vesicles are visible as bright dots, even though fluorescence from TR-DHPE is quenched to a large extent. The vesicles adsorbed preferentially on the glass surface between patterned DiynePC bilayers. It should be noted that adsorbed vesicles were distributed randomly on the glass surface, indicating that there was no preferential adsorption of vesicles at the boundary of DiynePC bilayers. The adsorbed vesicles were immobile within the timescale of the TIR-FM observation, making the tracking of the fusion events from individual vesicles possible. Unlabeled egg-PC vesicles were subsequently added with a much higher concentration (100 μM). Fig. 4 C shows the TIR-FM observation 5 min after the addition of unlabeled vesicles. The fluorescence intensity of individual dots increased significantly by mixing of labeled and unlabeled bilayers. A closer inspection reveals that there are continuous fluorescent domains arising near the boundaries of DiynePC bilayers (enlarged images of the domains are shown in Fig. 5). These domains are most likely SPB patches, since the size is too large for a vesicle and the shape is also irregular. The fluorescent domains expanded from the boundaries toward the central regions of the stripes as shown in Fig. 4, D and E, and finally formed a continuous bilayer within these areas (Fig. 4 F). It should be noted that extended SPB domains appeared also in the central regions of the stripes, especially in the later stage, as indicated with an arrow in Fig. 4 E. However, they did not grow in size rapidly like the domains at the boundaries, and they stayed where they had appeared until they were merged by a growing domain from the boundary. The inset in Fig. 4 is an intensity profile measured along the dotted line in each image. The line profiles show vesicles as sharp peaks and SPBs as continuous plateaus. The evolution of fluorescence intensity suggests that there are vesicle fusion events also in the central region of the glass stripes. It may be at least partially due to the fact that egg-PC vesicles with a high TR-DHPE content are expected to be rather unstable and susceptible to rupture (4). More detailed images of the initial fusion process are shown in Fig. 5. The dark region on the right side of each image is the polymeric DiynePC bilayer. Fluorescent vesicles were adsorbed mostly on the left side (glass surface). Continuous domains of SPBs were formed at the boundary (a in Fig. 5 A and a–c in Fig. 5 B). In Fig. 5 B, there are three domains at the boundary to DiynePC bilayer that have different fluorescence intensities, indicating that they are separated from each other. In Fig. 5 C, two of these domains (a and b) coalesced into one domain, as indicated by the homogeneity of fluorescence intensity. Subsequently, domain c coalesced and covered the boundary of DiynePC bilayer (Fig. 5 D). Growth of the SPB domains in the vertical direction from the boundary was much slower even though there were intact vesicles (or SPB disks) in the vicinity (one example is marked with a red circle). The fluorescent dots on the glass surface located far from the DiynePC bilayer expanded only slightly until they were merged into the continuous bilayer domain growing from the boundary.
FIGURE 4.
TIR-FM images of the vesicle fusion process on a glass substrate with patterned DiynePC bilayer. Application of vesicle suspensions was conducted in two steps. A dilute suspension of egg-PC vesicles (0.1 μM) containing 30 mol % TR-DHPE was first added and incubated for 5 min. Subsequently, unlabeled egg-PC vesicles were added at a much higher concentration (100 μM). Formation of SPBs was visualized with the increased fluorescence intensity (dequenching) due to the mixing of labeled and unlabeled bilayers. (A) Image obtained before the addition of labeled vesicles. The bright stripes are patterned DiynePC bilayers. (B) Image obtained after the addition of egg-PC vesicles containing 30 mol % TR-DHPE. Vesicles adsorbed preferentially on the glass surface. (C–F) Images obtained after the addition of unlabeled vesicles: SPBs were formed preferentially at the boundaries of DiynePC bilayer and expanded toward the central region of lipid-free stripes (D and E) and fused some independent domains (marked by an arrow in E), finally covering the glass surface completely (F). The inset in each image is an intensity profile measured along the dotted line. The scale bars correspond to 40 μm. The elapsed time after the introduction of unlabeled vesicles is given at the top of each image.
FIGURE 5.
Enlarged TIR-FM images of SPB domains near the boundary of DiynePC bilayer: (A) Adsorbed vesicles on the glass surface between DiynePC bilayers. Heightened fluorescence intensities of some spots are an indication of the fusion between labeled and unlabeled vesicles or formation of small SPB disks. One fluorescent dot (presumably an intact vesicle) is marked with a red circle. (B) SPB domains were formed at the boundaries of DiynePC bilayer. (C) Domains a and b coalesced and formed a homogeneously fluorescent domain. The marked vesicle remained intact. (D) Domain c and some neighboring fluorescent dots (vesicles or planar bilayer disks) were merged. The marked vesicle was also merged. The scale bars correspond to 10 μm. The elapsed time after the introduction of unlabeled vesicles is given in each image.
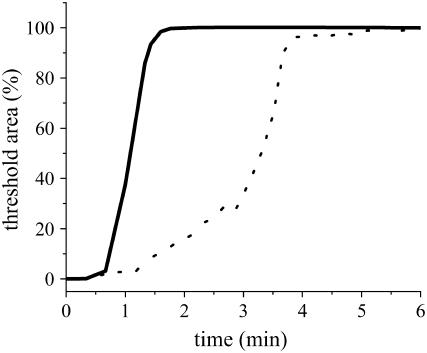
Dequenching of TR-DHPE was utilized also for assessing the time course of SPB formation. For this purpose, we used a flow cell in which solutions could be exchanged. As in the experiment in Figs. 4 and 5, a very dilute suspension of labeled vesicles (egg-PC with 30 mol % TR-DHPE) was first introduced and rinsed with the buffer solution. In this way, the substrate surface was covered by labeled vesicles at a very low density. Subsequently, unlabeled vesicles were introduced at a much higher concentration (100 μM), and the dequenching occurring at the substrate surface was observed by the upright fluorescence microscopy (TIR-FM was not necessary because there was no fluorescence in the bulk solution). Formation of SPB was monitored as an increase of fluorescent domains in which the intensity exceeded a defined threshold. Fig. 6 shows the comparison between patterned DiynePC and chromium substrates (20-μm stripes). The SPB domains increased more rapidly for the DiynePC substrate, indicating enhanced SPB formation. In the case of chromium substrate, the increase was initially slow and accelerated in the later stage. For both substrates, the time necessary for the completion of vesicle fusion was much shorter compared with the observations by TIR-FM (Figs. 2–5). This discrepancy arose mostly from the difference of the cells used in these experiments (the efficiency of solution exchange). There is a small time lag before the onset of SPB domain growth in Fig. 6 (both for DiynePC and chromium substrates), presumably due to the time necessary for exchanging solutions.
FIGURE 6.
Time course of SPB formation on patterned substrates (20-μm stripes) of DiynePC (solid line) and chromium (dotted line): The total area of SPB domains was determined for each fluorescence micrograph by calculating the area in which the fluorescence intensity exceeded a defined threshold. The data were normalized to the final area, where the observed regions were completely covered by SPBs and were plotted as a function of the elapsed time after the introduction of unlabeled vesicles.
QCM-D monitoring of the vesicle fusion process
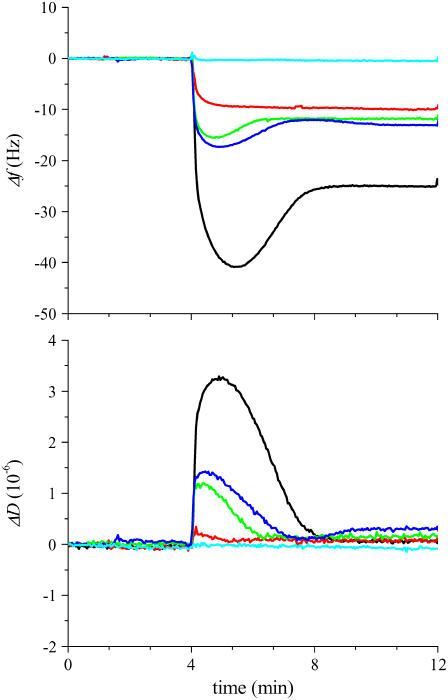
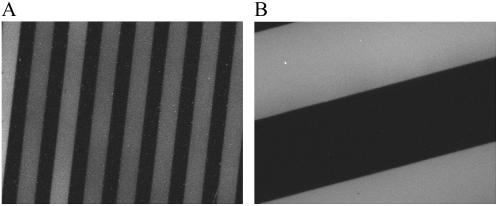
The kinetics of vesicle fusion processes on patterned DiynePC bilayer substrates was studied by the QCM-D technique. For this purpose, bilayers of DiynePC were deposited on the surface of silica-coated QCM sensors, and micropatterns (stripes) were generated by photolithographic polymerization of DiynePC. We prepared several samples with different stripe widths (10 μm, 20 μm, 50 μm, 100 μm, and 200 μm) to investigate the effect of the number of boundaries per unit area. Since the stripe width was approximately the same for the polymerized bilayers and lipid-free regions, the area available for the incorporation of new lipid bilayers was roughly half of the original silica-coated sensor, regardless of the width of the stripes. Fig. 7 shows the measured responses in Δf and ΔD (fifth harmonics: 25 MHz) obtained for the application of 140-μM egg-PC vesicles containing 1 mol % TR-DHPE on the substrates with three stripe widths (10 μm, 50 μm, and 200 μm). (Although the lipid concentration used for the QCM-D investigation was slightly higher than that of the TIR-FM observations, this difference did not significantly affect the vesicle fusion behaviors on patterned substrates.) As a comparison, the results on a homogeneous SiO2 substrate (no patterned bilayer) and on a homogenously polymerized DiynePC bilayer are added. The obtained QCM-D response on the SiO2 substrate showed a characteristic two-phase process, similar to previous reports (8,29–31): In the first phase, Δf decreased and ΔD increased due to the adsorption of vesicles with trapped water (inside and between vesicles). In the second phase, the adsorbed vesicles ruptured and formed SPB, releasing trapped water as indicated by the increase of Δf and decrease of ΔD. On homogeneously polymerized DiynePC bilayer, on the other hand, Δf and ΔD did not change upon vesicle introduction. Vesicles apparently did not adsorb on the DiynePC bilayer surface. For the patterned substrates, the QCM-D profiles revealed smaller humps of Δf and ΔD compared with the case of SiO2, indicating that the amount of vesicles accumulated before SPB formation was smaller. This tendency was more prominent on substrates with a higher density of boundaries. No hump of Δf was observed for the sample with 10-μm stripes, suggesting rapid transformation of adsorbed vesicles into SPB. (A small amount of intact vesicles was observed also on this sample, as indicated by a small but distinct hump of ΔD. The TIR-FM observation using a patterned DiynePC bilayer substrate of 10-μm stripes also showed the same boundary initiated spreading of SPBs, similar to the results in Figs. 4 and 5 (data not shown).) Regardless of the stripe width of patterned DiynePC bilayer stripes, the final Δf was approximately half of that obtained on homogenous SiO2 and the dissipation was near zero, corroborating the formation of SPBs in the previously lipid-free regions. Incorporation of egg-PC/TR-DHPE bilayers in the matrix of polymeric bilayers was confirmed also by the fluorescence microscopy observation shown in Fig. 8 (stripe widths: 10 μm (A) and 50 μm (B)).
FIGURE 7.
QCM-D measurements of the vesicle fusion process on SiO2 substrates with patterned DiynePC bilayers: Δf and ΔD were plotted during the fusion of egg-PC vesicles (140 μM) containing 1 mol % TR-DHPE on SiO2 (no DiynePC bilayer, black), homogeneously polymerized DiynePC bilayer (light blue), and patterned DiynePC bilayers. The patterned DiynePC bilayers had stripe widths of 10 μm (red), 50 μm (green), and 200 μm (blue), respectively.
FIGURE 8.
Fluorescence microscopy images of the sensors after the QCM-D measurements in Fig. 7: Egg-PC bilayers (containing 1 mol % TR-DHPE) were incorporated between the DiynePC bilayer stripes of 10-μm (A) and 50-μm (B) widths.
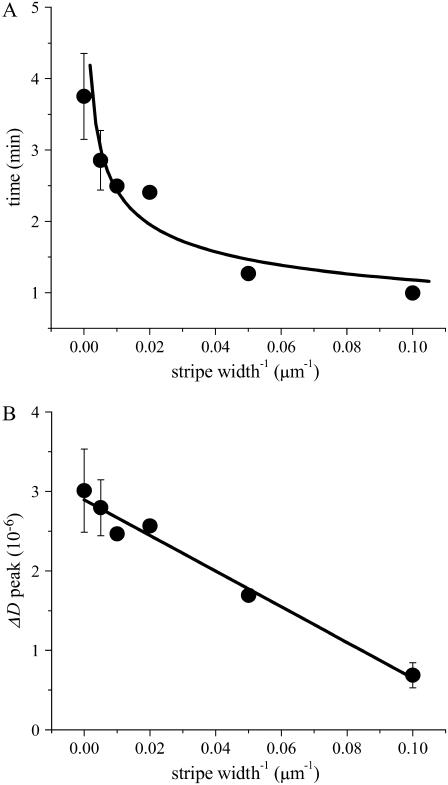
As an attempt to obtain further information from the QCM-D profiles, we plotted the duration of vesicle fusion and the normalized maximum ΔD value as a function of the inverse of stripe widths (density of bilayer boundaries). Fig. 9 A shows the duration of vesicle fusion, which was defined as the point where Δf values became constant after the formation of SPBs. The time needed for vesicle fusion decreased by the presence of preformed DiynePC bilayers. The reduction was significant also for large stripe widths (>50 μm) and rather leveled off for smaller stripe widths (20 μm and 10 μm). On the other hand, the maximum ΔD values, which represent the amount of vesicles accumulated temporarily on the substrate surface before transforming into SPBs, decreased linearly with the inverse of stripe widths (Fig. 9 B). (These values were normalized considering the area occupied by the newly incorporated SPBs.) The overall results from the QCM-D measurements also point to the effect of patterned DiynePC bilayers to catalyze the formation of SPBs via vesicle fusion.
FIGURE 9.
Plot of vesicle fusion duration and maximum ΔD values versus inverse of stripe widths (the results of SiO2 substrate were also incorporated): (A) Duration of vesicle fusion plotted versus the inverse of stripe widths. A line is given just to guide the eyes. (B) Maximum ΔD values plotted versus the inverse of stripe widths. The ΔD values were normalized, considering different areas of exposed SiO2 for patterned substrates.
DISCUSSION
The results from TIR-FM and QCM-D measurements have shown that formation of SPBs was promoted by the presence of preformed DiynePC bilayers. The TIR-FM observations revealed that SPBs were formed preferentially at the boundary of DiynePC bilayers and propagated subsequently to the central part of the lipid-free regions. QCM-D results showed that patterned bilayer substrates accelerated the formation of SPB, as indicated by the reduced accumulation of adsorbed vesicles. The acceleration was more prominent for patterned substrates with a higher density of boundaries between DiynePC bilayers and lipid-free regions (a smaller stripe width).
From these experimental results, we infer that the catalytic element for the observed enhancement of vesicle fusion is the edge of DiynePC bilayers. It is supposed that open bilayer structures are exposed at the edges of DiynePC bilayers, which are created by the termination of polymerization and subsequent removal of neighboring monomers (Fig. 1). Several lines of experimental data support this conclusion. First, the fusion experiment of self-quenching vesicles together with unlabeled egg-PC vesicles has clearly demonstrated the preferential formation of SPBs at the boundaries of DiynePC bilayers. The observation in Fig. 5 also suggested that planar bilayer patches coalesced faster along the edges of DiynePC bilayers. Second, rather random formation of SPB patches was observed on glass substrates with a patterned chromium layer, suggesting that simple geometrical confinements on the substrate do not induce the fusion of vesicles. The formation of SPB was significantly faster on patterned DiynePC substrates compared with chromium substrates (Fig. 6). The difference was especially clear in the early stage of the SPB formation: Whereas rapid formation of SPB was observed from the beginning on DiynePC substrates, the formation was initially slow on chromium substrates and was accelerated only in the later stage. The progressive acceleration of SPB formation was most likely due to the autocatalytic effect of SPB patches to enhance further formation of SPBs (vide infra). Vesicles were observed to adsorb on chromium stripes, in contrast with the patterned DiynePC bilayer substrates where practically no vesicles adsorbed on polymeric bilayers. This might be at least partially contributing to the retarded SPB formation on the chromium substrate because a part of vesicles can be trapped by the chromium surface. However, the major contribution should come from the different structures of the boundaries. We also do not think that the distribution of vesicles on the surface (possible local accumulation of vesicles at the boundaries of DiynePC bilayers) is the major mechanism of accelerated vesicle fusion for the following reasons: 1), labeled vesicles in Fig. 4 B were distributed randomly on the glass surface, whereas SPB formation started clearly from the boundaries; and 2), QCM-D measurements showed that the amount of accumulated vesicles on the surface was smaller for patterned substrates with a smaller stripe width. Local accumulation of vesicles at the boundaries would rather contradict this result. It is still possible, however, that a transient accumulation of vesicles near the bilayer edges (local fluctuation of vesicle densities in the microscopic scale) may play an important role. This possibility would be an interesting subject for further studies.
The results obtained by QCM-D measurements gave some insights into the kinetic aspects of enhanced vesicle fusion. The duration of vesicle fusion decreased as a function of the inverse of stripe widths (Fig. 9 A). Since the whole process of vesicle fusion consists of a series of complex steps including adsorption of vesicles from the solution, (spontaneous and bilayer edge catalyzed) rupturing of vesicles, and fusion between bilayer disks, it is currently not possible to determine quantitative rate constants for individual steps. However, the significant decrease of duration with bilayer edge densities suggests that vesicle rupture is the rate-limiting step. On the other hand, the fact that the duration leveled off for smaller stripe widths is an indication that the kinetics of vesicle fusion in this regime is determined by a factor that is not related to the density of bilayer edges, presumably the diffusion of vesicles from the solution. The diffusion-limited vesicle fusion should also partially explain why no hump of Δf was observed for smaller stripes (e.g., the sample with 10-μm stripes in Fig. 7). On the other hand, the linear decrease of maximum ΔD values as a function of the inverse of stripe widths (Fig. 9 B) suggests that the amount of adsorbed vesicles accumulated on the substrate before rupturing decreased linearly with the increase of bilayer edge density. Although the experimentally observed maximum ΔD is a result of complex processes, including diffusion of vesicles from the solution and rupturing at the surface, we can formulate the following simple kinetic model to explain its linear dependency on bilayer edge density: Vesicles adsorb onto the glass surface randomly. Depending on where they fall, they have two pathways for rupturing, i.e., spontaneous rupturing and bilayer edge-catalyzed rupturing. Assuming that the rate for the bilayer edge-catalyzed rupturing is much larger than the spontaneous one, we would observe the accumulation of vesicles primarily from the spontaneous pathway. Since the fraction of the edge-catalyzed rupturing pathway increases linearly with the density of bilayer edges, the observed vesicle accumulation should decrease accordingly. It is important to note that the fraction of the edge-catalyzed rupturing pathway includes not only vesicle rupture at DiynePC bilayer edges but also vesicle rupture at the edges of SPBs that formed at the boundaries. One interesting implication of the linear decrease in ΔD is that there is a critical density of bilayer edges above which ΔD remains zero through the entire vesicle fusion process (at least for the sensitivity of the currently applied QCM-D measurements), i.e., no detectable amount of vesicles accumulate on the surface due to the edge-catalyzed rupturing. Some preliminary QCM-D experiments using partially polymerized DiynePC bilayers having submicrometer-sized defects showed that ΔD remained zero during vesicle fusion (data not shown).
Although we currently do not have any structural information of the edges at the molecular level, the results obtained from in situ AFM measurements revealed the height gap of ∼5.9 nm at the boundary, which corresponds to a bilayer of DiynePC (25). The fact that the boundary of DiynePC bilayers can induce destabilization and rupture of adsorbed vesicles is a strong indication that the boundary has an energetically unfavorable structure. Previous investigations by AFM suggested the catalytic role of bilayer edges to promote rupture of adsorbed vesicles (31–33). Simulation studies have also indicated the important roles played by energetically unfavorable edge structures (34,35). Furthermore, Jenkins et al. have reported lipid vesicle adsorption on micropatterned self-assembled monolayers consisting of hydrophobic and hydrophilic thiols by AFM and surface plasmon microscopy (36,37). They observed that the formation of SPBs on hydrophilic domains was much slower compared to the formation of planar monolayers on the hydrophobic surface. Moreover, they observed for micropatterned samples that the formation of SPBs on the hydrophilic domains was limited to the vicinity of the boundaries to the hydrophobic domains, suggesting that hybrid layers from alkane thiol and adsorbed lipid monolayers acted as a catalyst to the formation of SPBs. Results here are consistent with these results and also represent an unambiguous experimental demonstration of enhanced vesicle fusion by preformed SPBs with a purposefully designed geometry. It should be noted that the edges of bilayers are generally supposed to be capped with a metastable micelle-like structure (38). Depending on the configuration of the film (i.e., whether it is a phospholipid bilayer on a hydrophilic surface or a monolayer on a hydrophobic self-assembled monolayer), the cap structures at the edges might be significantly different. In the case of polymeric bilayers, lipid molecules are covalently cross-linked so that the formation of micelle-like structures at the edge is more difficult unless there are major structural transitions. It is an intriguing question whether the differences in the end structures influence the capability of bilayer edges to catalyze the vesicle fusion process.
The observations described here also have important implications to the micropatterning strategy based on lithographically polymerized bilayers. Facilitated incorporation of fluid SPBs by the preformed DiynePC bilayers is a strong indication that it is energetically favorable to incorporate guest SPBs in the matrix of DiynePC bilayers. To obtain an energetic gain, these two types of bilayers should be forming a continuous hybrid membrane, sealing the edges of DiynePC and fluid lipid bilayers. Formation of such hybrid membranes is the most important feature of the micropatterning strategy reported here, because the polymeric bilayers can act both as barriers for the lateral diffusion of membrane-associated molecules and as a scaffold to stabilize incorporated fluid bilayer membranes. This unique property should enable various extensions in the architecture of micropatterned model membranes such as separation of the membrane from the substrate with a spacer and incorporation of membrane proteins in a native state. The enhanced vesicle fusion by the presence of preformed polymeric bilayer scaffold also suggests the possibility that a wider variety of lipid membranes, including native cellular membranes, may be incorporated into micropatterned bilayers. The QCM-D results showed that incorporation of fluid SPBs was more strongly accelerated in smaller patterns. This result indicates that the stabilization effect of fluid SPBs by the surrounding polymeric bilayer matrix may be greater if the sizes of SPB patches are smaller. One obvious direction for future research is to create smaller micropatterned bilayers (possibly submicrometer) and examine whether and to what extent incorporated fluid bilayers are stabilized. At the same time, the stabilization effects should depend on the structure of junctions between polymeric and fluid bilayers. Therefore, various factors that can affect these structures, such as the type of lipids in polymeric and fluid bilayers and local accumulation of some lipids at the boundaries, need to be studied more systematically to fully exploit the potentials offered by the micropatterned membrane systems both for biophysical sciences and for technological applications.
CONCLUSION
Incorporation of fluid phospholipid bilayers into micropatterned polymeric bilayer matrices of DiynePC has been studied by TIR-FM and QCM-D. The TIR-FM observations revealed that SPBs were formed preferentially at the boundary of DiynePC bilayers and propagated subsequently to the central part of the lipid-free regions. On the other hand, QCM-D results showed that patterned bilayer substrates accelerated the formation of SPB, as indicated by the reduced accumulation of adsorbed vesicles. These observations strongly suggest that the edges of preformed polymeric bilayers induce vesicle fusion and also support the premise that fluid and polymeric bilayer domains are forming a continuous hybrid bilayer. The facilitated integration of polymeric/fluid bilayers via self-assembly processes would be an important property for the generation of complex biomimetic membranes with additional functions.
Acknowledgments
We thank Ms. Maki Koike for her assistance in the preparation of patterned substrates and vesicle suspensions.
This work has been supported in part by Promotion Budget for Science and Technology (AIST Upbringing of Talent in Nanobiotechnology Course) from the Ministry of Education, Science, Culture, and Sports (MEXT).
References
- 1.Sackmann, E. 1996. Supported membranes: scientific and practical applications. Science. 271:43–48. [DOI] [PubMed] [Google Scholar]
- 2.Tanaka, M., and E. Sackmann. 2005. Polymer-supported membranes as models of the cell surface. Nature. 437:656–663. [DOI] [PubMed] [Google Scholar]
- 3.Kalb, E., S. Frey, and L. K. Tamm. 1992. Formation of supported planar bilayers by fusion of vesicles to supported phospholipid monolayers. Biochim. Biophys. Acta. 1103:307–316. [DOI] [PubMed] [Google Scholar]
- 4.Johnson, J. M., T. Ha, S. Chu, and S. G. Boxer. 2002. Early steps of supported bilayer formation probed by single vesicle fluorescence assays. Biophys. J. 83:3371–3379. [DOI] [PMC free article] [PubMed] [Google Scholar]
- 5.Cooper, M. A., A. C. Try, J. Carroll, D. J. Ellar, and D. H. Williams. 1998. Surface plasmon resonance analysis at a supported lipid monolayer. Biochim. Biophys. Acta. 1373:101–111. [DOI] [PubMed] [Google Scholar]
- 6.Naumann, R., S. M. Schiller, F. Giess, B. Grohe, K. B. Hartman, I. Karcher, I. Koper, J. Lubben, K. Vasilev, and W. Knoll. 2003. Tethered lipid bilayers on ultraflat gold surfaces. Langmuir. 19:5435–5443. [Google Scholar]
- 7.Tawa, K., and K. Morigaki. 2005. Substrate-supported phospholipid membranes studied by surface plasmon resonance and surface plasmon fluorescence spectroscopy. Biophys. J. 89:2750–2758. [DOI] [PMC free article] [PubMed] [Google Scholar]
- 8.Keller, C. A., and B. Kasemo. 1998. Surface specific kinetics of lipid vesicle adsorption measured with a quartz crystal microbalance. Biophys. J. 75:1397–1402. [DOI] [PMC free article] [PubMed] [Google Scholar]
- 9.Reimhult, E., C. Larsson, B. Kasemo, and F. Hook. 2004. Simultaneous surface plasmon resonance and quartz crystal microbalance with dissipation monitoring measurements of biomolecular adsorption events involving structural transformations and variations in coupled water. Anal. Chem. 76:7211–7220. [DOI] [PubMed] [Google Scholar]
- 10.Richter, R. P., and A. R. Brisson. 2005. Following the formation of supported lipid bilayers on mica: a study combining AFM, QCM-D, and ellipsometry. Biophys. J. 88:3422–3433. [DOI] [PMC free article] [PubMed] [Google Scholar]
- 11.Groves, J. T., and S. G. Boxer. 2002. Micropattern formation in supported lipid membranes. Acc. Chem. Res. 35:149–157. [DOI] [PubMed] [Google Scholar]
- 12.Groves, J. T., S. G. Boxer, and H. M. McConnell. 1997. Electric field-induced reorganization of two-component supported bilayer membranes. Proc. Natl. Acad. Sci. USA. 94:13390–13395. [DOI] [PMC free article] [PubMed] [Google Scholar]
- 13.Groves, J. T., N. Ulman, and S. G. Boxer. 1997. Micropatterning fluid lipid bilayers on solid supports. Science. 275:651–653. [DOI] [PubMed] [Google Scholar]
- 14.Cremer, P. S., and S. G. Boxer. 1999. Formation and spreading of lipid bilayers on planar glass supports. J. Phys. Chem. B. 103:2554–2559. [Google Scholar]
- 15.Heyse, S., O. P. Ernst, Z. Dienes, K. P. Hofmann, and H. Vogel. 1998. Incorporation of rhodopsin in laterally structured supported membrane: observation of transducin activation with spatially and time-resolved surface plasmon resonance. Biochemistry. 37:507–522. [DOI] [PubMed] [Google Scholar]
- 16.Rossetti, F. F., M. Bally, R. Michel, M. Textor, and I. Reviakine. 2005. Interactions between titanium dioxide and phosphatidyl serine-containing liposomes: formation and patterning of supported phospholipid bilayers on the surface of a medically relevant material. Langmuir. 21:6443–6450. [DOI] [PubMed] [Google Scholar]
- 17.Hovis, J. S., and S. G. Boxer. 2000. Patterning barriers to lateral diffusion in supported lipid bilayer membranes by blotting and stamping. Langmuir. 16:894–897. [Google Scholar]
- 18.Künneke, S., and A. Janshoff. 2002. Visualization of molecular recognition events on microstructured lipid-membrane compartments by in situ scanning force microscopy. Angew. Chem. Int. Ed. Engl. 41:314–316. [DOI] [PubMed] [Google Scholar]
- 19.Kam, L., and S. G. Boxer. 2000. Formation of supported lipid bilayer composition arrays by controlled mixing and surface capture. J. Am. Chem. Soc. 122:12901–12902. [Google Scholar]
- 20.Fang, Y., A. G. Frutos, and J. Lahiri. 2002. Membrane protein microarrays. J. Am. Chem. Soc. 124:2394–2395. [DOI] [PubMed] [Google Scholar]
- 21.Orth, R. N., J. Kameoka, W. R. Zipfel, B. Ilic, W. W. Webb, T. G. Clark, and H. G. Craighead. 2003. Creating biological membranes on the micron scale: forming patterned lipid bilayers using a polymer lift-off technique. Biophys. J. 85:3066–3073. [DOI] [PMC free article] [PubMed] [Google Scholar]
- 22.Yee, C. K., M. L. Amweg, and A. N. Parikh. 2004. Membrane photolithography: direct micropatterning and manipulation of fluid phospholipid membranes in the aqueous phase using deep-UV light. Adv. Mater. 16:1184–1189. [Google Scholar]
- 23.Morigaki, K., T. Baumgart, A. Offenhäusser, and W. Knoll. 2001. Patterning solid-supported lipid bilayer membranes by lithographic polymerization of a diacetylene lipid. Angew. Chem. Int. Ed. Engl. 40:172–174. [DOI] [PubMed] [Google Scholar]
- 24.Morigaki, K., T. Baumgart, U. Jonas, A. Offenhäusser, and W. Knoll. 2002. Photopolymerization of diacetylene lipid bilayers and its application to the construction of micropatterned biomimetic membranes. Langmuir. 18:4082–4089. [Google Scholar]
- 25.Morigaki, K., H. Schönherr, C. W. Frank, and W. Knoll. 2003. Photolithographic plymerization of diacetylene-containing phospholipid bilayers studied by multimode atomic force microscopy. Langmuir. 19:6994–7002. [Google Scholar]
- 26.Morigaki, K., K. Kiyosue, and T. Taguchi. 2004. Micropatterned composite membranes of polymerized and fluid lipid bilayers. Langmuir. 20:7729–7735. [DOI] [PubMed] [Google Scholar]
- 27.Brian, A. A., and H. M. McConnell. 1984. Allogeneic stimulation of cytotoxic T cells by supported planar membranes. Proc. Natl. Acad. Sci. USA. 81:6159–6163. [DOI] [PMC free article] [PubMed] [Google Scholar]
- 28.Nollert, P., H. Kiefer, and F. Jähnig. 1995. Lipid vesicle adsorption versus formation of planar bilayers on solid surfaces. Biophys. J. 69:1447–1455. [DOI] [PMC free article] [PubMed] [Google Scholar]
- 29.Reimhult, E., F. Hook, and B. Kasemo. 2002. Vesicle adsorption on SiO2 and TiO2: dependence on vesicle size. J. Chem. Phys. 117:7401–7404. [Google Scholar]
- 30.Reimhult, E., F. Hook, and B. Kasemo. 2003. Intact vesicle adsorption and supported biomembrane formation from vesicles in solution: influence of surface chemistry, vesicle size, temperature, and osmotic pressure. Langmuir. 19:1681–1691. [Google Scholar]
- 31.Richter, R., A. Mukhopadhyay, and A. Brisson. 2003. Pathways of lipid vesicle deposition on solid surfaces: a combined QCM-D and AFM study. Biophys. J. 85:3035–3047. [DOI] [PMC free article] [PubMed] [Google Scholar]
- 32.Reviakine, I., and A. Brisson. 2000. Formation of supported phospholipid bilayers from unilamellar vesicles investigated by atomic force microscopy. Langmuir. 16:1806–1815. [Google Scholar]
- 33.Schönherr, H., J. M. Johnson, P. Lenz, C. W. Frank, and S. G. Boxer. 2004. Vesicle adsorption and lipid bilayer formation on glass studied by atomic force microscopy. Langmuir. 20:11600–11606. [DOI] [PubMed] [Google Scholar]
- 34.Zhdanov, V. P., C. A. Keller, K. Glasmastar, and B. Kasemo. 2000. Simulation of adsorption kinetics of lipid vesicles. J. Chem. Phys. 112:900–909. [Google Scholar]
- 35.Dimitrievski, K., E. Reimhult, B. Kasemo, and V. P. Zhdanov. 2004. Simulations of temperature dependence of the formation of a supported lipid bilayer via vesicle adsorption. Colloids Surf. B. Biointerfaces. 39:77–86. [DOI] [PubMed] [Google Scholar]
- 36.Jenkins, A. T. A., T. Neumann, and A. Offenhäusser. 2001. Surface plasmon microscopy measurements of lipid vesicle adsorption on a micropatterned self-assembled monolayer. Langmuir. 17:265–267. [Google Scholar]
- 37.Jenkins, A. T. A., R. J. Bushby, S. D. Evans, W. Knoll, A. Offenhäusser, and S. D. Ogier. 2002. Lipid vesicle fusion on μCP patterned self-assembled monolayers: effect of pattern geometry on bilayer formation. Langmuir. 18:3176–3180. [Google Scholar]
- 38.Kasson, P. M., and V. S. Pande. 2004. Molecular dynamics simulation of lipid reorientation at bilayer edges. Biophys. J. 86:3744–3749. [DOI] [PMC free article] [PubMed] [Google Scholar]


