Abstract
A variety of different DNA polymers were electrophoretically driven through the nanopore of an α-hemolysin channel in a lipid bilayer. Single-channel recording of the translocation duration and current flow during traversal of individual polynucleotides yielded a unique pattern of events for each of the several polymers tested. Statistical data derived from this pattern of events demonstrate that in several cases a nanopore can distinguish between polynucleotides of similar length and composition that differ only in sequence. Studies of temperature effects on the translocation process show that translocation duration scales as ∼T−2. A strong correlation exists between the temperature dependence of the event characteristics and the tendency of some polymers to form secondary structure. Because nanopores can rapidly discriminate and characterize unlabeled DNA molecules at low copy number, refinements of the experimental approach demonstrated here could eventually provide a low-cost high-throughput method of analyzing DNA polynucleotides.
The discovery that a voltage gradient can drive single-stranded RNA or DNA molecules through a 2-nm transmembrane channel, or nanopore, has opened up the possibility of detecting and characterizing unlabeled polynucleotide molecules at low copy number by using single-channel recording techniques. Because an extended molecule of DNA or RNA can occupy, and thus block, much of an otherwise open aqueous channel, the passage of a single polynucleotide can be monitored by recording the translocation duration and blockade current (magnitude of the reduced ionic flow through the pore) (1). Studies with RNAs of differing base composition have begun to suggest how nanopores could be used to discriminate between different nucleic acid polymers (2).
We now extend these observations and provide evidence that each of several different DNA polymers can be identified by a unique pattern in “event diagrams,” which are plots of translocation duration vs. blockade current for an ensemble of events. Patterns for a given polymer can be characterized uniquely by three statistical parameters representing the most probable translocation current, IP, the most probable translocation duration, tP, and the characteristic dispersion of values for individual translocation durations, τT. Because each type of polynucleotide we use gives rise to specific values of these three parameters, these parameters' values can be used to discriminate rapidly between different types of polynucleotides in a mixed sample. Temperature markedly affects these parameters in two ways. The translocation duration scales as T−2 for all polymers tested, where T is temperature in °C. The other two parameters exhibit a strong temperature dependence for only those polymers that are known to have stable secondary structure.
Materials and Methods
Single channels were formed in a horizontal bilayer of diphytanoyl phosphatidylcholine by using the protein α-hemolysin from Staphylococcus aureus. The horizontal bilayer was formed across a 30-μm conical Teflon aperture at one end of a Teflon tube in a special heat-conducting version of the apparatus described by Akeson et al. (2). α-hemolysin was added to the cis chamber on one side of the bilayer. Seven α-hemolysin subunits assemble to form a large aqueous transmembrane channel ca 50 Å long and 18 Å in diameter (3).
The cis chamber, to which the samples of DNA were added, accommodated tubing connections that allowed complete chamber flushing. The entire apparatus was mounted on a custom-made temperature-controlled base utilizing a thermoelectric device (Melcor, Trenton, NJ) that maintained the buffer solution at a fixed temperature, ±0.01°C. The setup was enclosed in a grounded copper box to provide electrical shielding and to minimize evaporative solution loss by maintaining a high water-vapor pressure atmosphere. All experiments were performed in 1 M KCl/10 mM Tris⋅Cl, pH 8.5. Under these conditions, the α-hemolysin channel was stable from 15°C to 50°C and remained open, without gating, over extended periods of time (4). The open pore current was shown to be linear with respect to the bulk temperature-dependent conductivity of the KCl buffer. Small pH changes caused by the temperature dependence of the Tris⋅Cl buffer did not have a measurable effect on the open pore current, the blocked pore current, or the translocation duration of the DNA.
With the cis side negative, 120 mV was applied across the channel. The resultant ionic current flow through the α-hemolysin channel was amplified and measured by using a patch-clamp amplifier and head-stage (Axopatch 200B and CV203BU, Axon Instruments, Foster City, CA). The amplified signals were low-pass filtered at 100 KHz (3302 filter, Krohn-Hite, Avon, MA), and digitized at 333 KHz with a 12-bit analog/digital board (Axon).
Single-stranded DNA polymers were purchased from Midland Certified Reagents (Midland, TX) and size purified in 8% polyacrylamide gels under denaturing conditions. The concentrations of the excised purified and eluted molecules were estimated from their absorbance at 260 nm after being redissolved in 1 mM TE buffer (10 mM Tris/1 mM EDTA) at pH 8.5. In a typical experiment, single-stranded DNA was added to the cis chamber to a final concentration of 500 nM. At room temperature, this concentration of DNA resulted in about 1–2 translocations/sec, but this rate increased significantly with temperature. Leaving the membrane and channel intact and flushing the cis chamber with fresh buffer made it possible to perform separate experiments with several different kinds of DNA molecules with the same nanopore.
Between 1,000 and 3,000 translocation events were recorded separately for each type of DNA. Translocation events were defined as those that decreased the current to less than 30% of the open channel current. Setting this current ratio as the threshold in the acquisition software (clampex 7, Axon) avoided recording most of the short partial blockades that were proposed to be associated with DNA molecules colliding with, but not fully translocated through, the pore (1). The stored data were analyzed with custom software that calculated the duration time and average translocation current for each event.
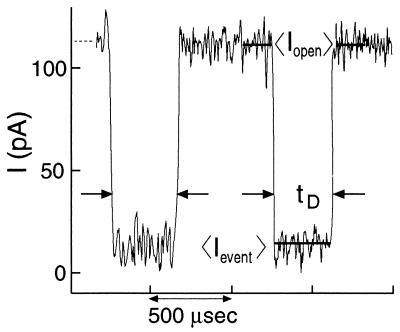
Fig. 1 displays two typical events. When the DNA enters the pore, the current drops abruptly from its initial value of ∼116 pA to roughly 14 pA (at 22°C). The current returns to its open pore value after the DNA traverses the channel. Each event is characterized by its duration time, tD and its averaged normalized blockade current level IB. IB is calculated by averaging the blockade current during the event and dividing this average by the averaged open pore current (Fig. 1). This normalization eliminates drift attributable to evaporation of fluids throughout an experiment as well as any small pore-to-pore variation between experiments. Short current spikes whose duration was comparable to or less than our electrical response time (∼10 μsec) were rejected by our customized software; so, too, were events whose average Iopen values were not equivalent before and after the event.
Figure 1.
Typical current trace showing two DNA translocation events (within pairs of facing arrows) when a 120-mV gradient is applied across a lipid membrane containing one α-hemolysin channel. For each event, we measured the translocation duration, tD, and the normalized blockade level defined as: IB = 〈IEvent〉/〈IOpen〉, where 〈IEvent〉 denotes current average over the translocation duration, and 〈IOpen〉 denotes the average during 150 μsec before and 150 μsec after each event.
Results and Discussion
Discrimination of Polynucleotides.
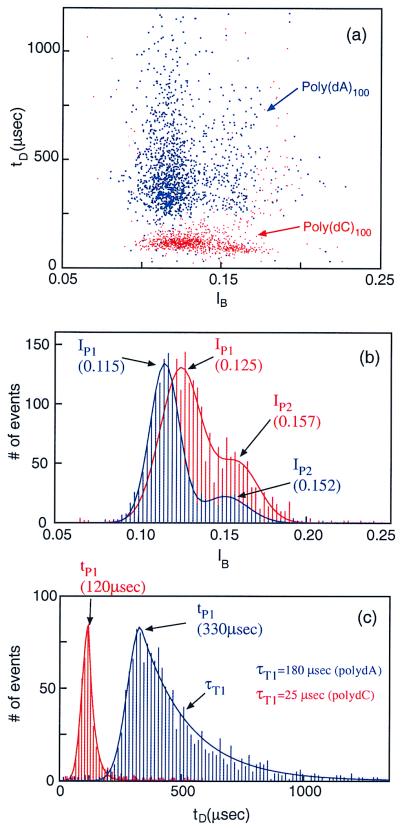
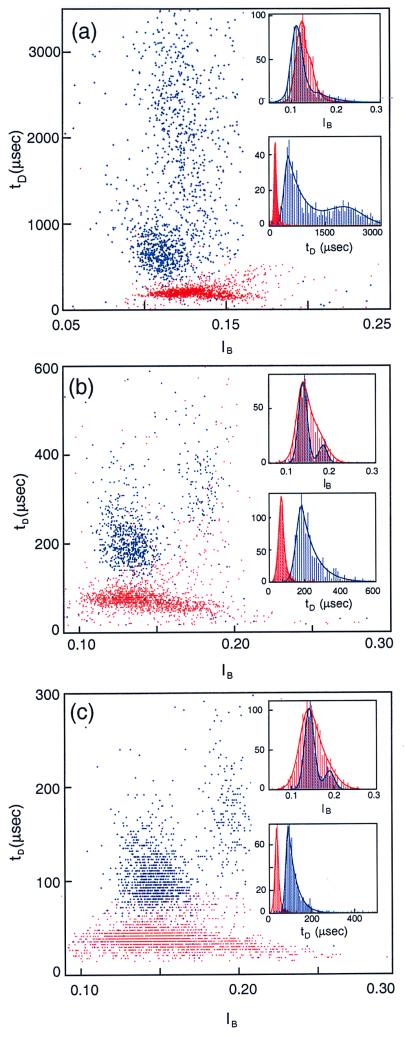
In the first set of measurements, we characterized the blockade signals produced as homopolymers containing cytosines (poly(dC)100) or adenines (poly(dA)100) translocated through an α-hemolysin channel. Each DNA molecule was characterized by the duration of the blockade it produced, tD, and the average blockade current, IB (see Materials and Methods). These parameters were plotted on an event diagram in which each point represents a single translocating event (Fig. 2a and the corresponding histograms on Fig. 2 b and c). The most prominent features of these plots are: (i) The events corresponding to the two polymers cluster in well-separated regions; less than 1% of the poly(dA)100 events (blue) fall in the poly(dC)100 region (red) and vice versa. Thus, discrimination between the two polymer types is readily achieved. (ii) The poly(dA)100 events separate into two groups. So, too, do the poly(dC)100 events, albeit the separation into two groups is not as clear for poly(dC)100 as it is for poly(dA)100. The group with the lower average current value, which always contains the majority of events, is defined as “group 1.” The remainder of events are classified as “group 2.” The two separate groups are evident as two peaks in the current histograms for each polymer type (Fig. 2b). The current peaks are well fitted by the sum of two Gaussian curves. Group 1 poly(dA) events (peak at IP1 = 0.115) contains ∼80% of the total number of events; the remaining 20% are in group 2 (IP2 = 0.152). For poly (dC) DNA, roughly 70% of the events are in group 1 (IP1 = 0.125), with the remainder in group 2 (IP2 = 0.157). (iii) Histograms of group 1 translocation durations exhibit a clear peak, which we define as tP1. The separation between the peaks corresponding to the two polymer types is large. At 20°C, tP1 = 330 μsec for poly(dA)100 (translocation rate = 3.3 μsec/base), and tP1 = 120 μsec for poly(dC)100 (1.23 μsec/base), with a ratio tP1(dA)/tP1(dC) = 2.8. For events of short duration (tD < tP1), the distributions display Gaussian behavior as shown by the fits (solid lines in Fig. 2c). But for events of long duration (tD > tP1), the distribution of tD values is not Gaussian (Fig. 2c) and is most reliably approximated by an exponential with time constant τT. This time constant is much longer for the poly(dA)100 events than for the poly(dC)100 events, with τT1/tp1 values of 0.6 for poly(dA) and 0.2 for poly(dC), respectively. These values reflect the larger temporal dispersion of poly(dA) events compared with poly(dC) events.
Figure 2.
(a) Event diagram showing translocation duration vs. blockade level for poly(dA)100 (blue) and poly(dC)100 (red) at 20.0°C. The two polymers were examined separately. Each point on this diagram represents the translocation of a single molecule that was characterized by its translocation duration, tD, and blockade current, IB. (b) Current histogram projected from the above event diagram; the color codes are the same. The two peaks corresponding to the two groups of events are denoted by IP1 and IP2. The solid lines are fits of the data to a sum of two Gaussians. (c) Duration histogram projected from a for the first group of events. Note the well-defined peak locations, tP, and the exponential temporal decay constants, τT. The temporal decay constant associated with the poly(dC) polymers is ∼7 times shorter than the τT associated with the poly(dA).
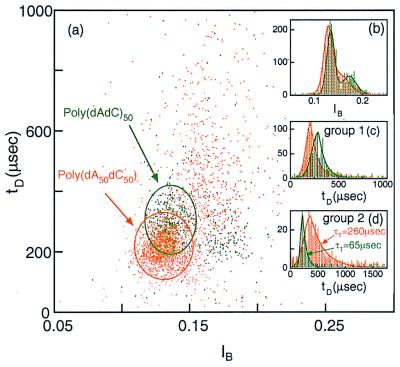
Although the plot features described above are specific for poly(dA) and poly(dC), the clear differences observed between these two polymers of equal length led us to examine whether a nanopore could also discriminate among other polymers. To start, we compared blockade signals from a polymer containing purine–pyrimidine pairs, poly(dAdC)50, with those from a di-block polymer, poly(dA50dC50) (Fig. 3). The poly(dAdC)50 events (green, Fig. 3) are organized into two well-localized groups that give rise to two peaks in the current histograms (Fig. 3b). Group 1 and group 2 also have different tP values (compare Fig. 3 c and d). The poly(dA50dC50) (yellow, Fig. 3c) events produce a different pattern with less distinct grouping, as is evident in the current histograms (Fig. 3b). Whereas a glance at figure 3a will give the impression that many of the individual poly(dAdC)50 and poly(dA50dC50) events are indistinguishable, the duration histograms reveal remarkable ensemble differences between the two polymers. Although the group 1 events for both polymers are well localized in duration and current (Fig. 3 b and c), the group 2 events for poly(dA50dC50) exhibit a duration distribution (τT2 = 260 μsec) that is roughly four times greater than τT2 for poly(dAdC)50 (τT2 = 65 μsec) (Fig. 3d). Thus, despite the identical base composition of these two polymers, each yields a unique event diagram.
Figure 3.
(a) Event diagram at 20.0°C for poly(dA50dC50) (orange) and poly(dAdC)50 (green). As in Fig. 2, the two polymers were examined separately. The ovals contain >95% of the events in group 1 for each of the two polymer types. (Inset) The corresponding current (b) and duration (c and d) histograms, where c is the duration histogram for group 1 events and d, for group 2 events. The two polymers were readily discriminated in spite of their identical base composition. The temporal spread in group 2 of poly(dA50dC50) was much larger than that of poly(dAdC)50 (see Table 1 for the values of τT2 for the two polymers).
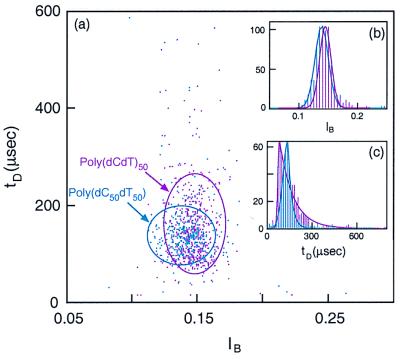
Thymine-containing polymers, poly(dC50dT50) and poly(dCdT)50, were used in additional discrimination tests. Again, each of the two polymers gives rise to unique patterns on event diagrams with different values for IP, tP, and τT (Fig. 4). In contrast to the several other polymers examined above, all of the events for each of these thymine-containing polymers cluster in only one group (Fig. 4b).
Figure 4.
(a) Event diagram at 25°C for poly(dC50dT50) (light-blue markers) and poly(dCdT)50 (purple markers). As in Fig. 2, the two polymers were examined separately. The ovals contain more than 95% of the total number of events. (Inset) The corresponding current histogram (b) and the translocation duration histogram (c). Note that in contrast to the polymers shown in Figs. 2 and 3, the current histogram has a single peak, suggesting a single group of events for each of these two polymers.
Table 1 summarizes the IP, tP and τT values for the group 1 events of the six different polymers tested (values given at 25°C). Together, the IP, tP, and τT values unambiguously characterize each of the polymer types. They can provide a simple tool for rapidly discriminating between the different populations. To demonstrate discrimination between individual polymer molecules, albeit for the best case reported here, we mixed a sample of poly(dA)100 with a sample of poly(dC)100 and performed translocation experiments similar to those described above. The resulting translocation duration histogram of the mixture (not shown) closely overlapped the sum of the two histograms obtained with the separate components (Fig. 2c). Thus, the two polymer types in the mixture behave as two independent populations. Moreover, the fraction of events that cannot be attributed to either one or the other polymer in the mixture is given by calculating the fraction of events that lie in the overlapping areas of the blue and the red shaded curves of Fig. 2c. Only about 2% of the events reside in this area, implying that in a mixed population, it would be possible to unambiguously attribute 98% of the events to either poly(dA)100 or poly(dC)100.
Table 1.
Summary of the statistical translocation properties of six polymers characterized at 25.0°C.
| Polymer | IP1 | tP1, μsec | τT1, μsec |
|---|---|---|---|
| (dA)100 | 0.126 ± 0.012 | 192 ± 10 | 55 ± 3 |
| (dC)100 | 0.134 ± 0.010 | 76 ± 4 | 15 ± 1 |
| (dA)50(dC)50 | 0.128 ± 0.010 | 136 ± 7 | 32 ± 2 |
| (dAdC)50 | 0.141 ± 0.011 | 177 ± 9 | 38 ± 2 |
| (dC)50(dT)50 | 0.140 ± 0.011 | 137 ± 7 | 25 ± 1 |
| (dCdT)50 | 0.144 ± 0.012 | 82 ± 4 | 91 ± 5 |
The peak in blockade-current histograms, IP, the peak in translocation duration histograms, tP, and the temporal dispersion of translocation duration, characterized by the constant, τT. SEM is shown for at least five groups of measurements of the same polymer.
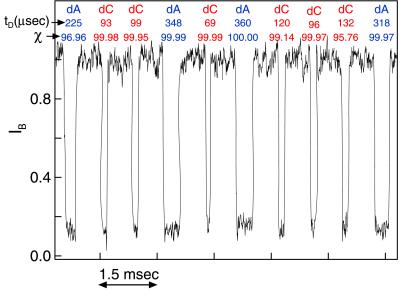
To test these arguments, and to demonstrate how the parameter values of Table 1 can be applied to single molecular events, we developed a simple computer algorithm that made use of a probability distribution function derived from Fig. 2c. The algorithm estimates the probability that each successive event is a molecule of poly(dA)100 or poly(dC)100 (Fig. 5). As expected, more than 98% of the events are assigned to either poly(dA) or poly(dC) with probabilities larger than 0.90. Preliminary experiments show that algorithms that take into account the other parameters shown in Table 1 will make it possible to discriminate between other types of polynucleotides mixtures.
Figure 5.
Representative current trace showing 10 events recorded from a mixture of equal molar concentrations of poly(dA)100 and poly(dC)100. The time between events is truncated. The individual events are identified, on the basis of tD alone, as traversal of a molecule of poly(dA)100 or a molecule of poly(dC)100. The confidence in the molecule identification, χ, was estimated by using the predetermined translocation time distributions (see Fig. 2c and text) and is given in percent. Of 999 events recorded in 4 min, the algorithm unambiguously (χ > 90%) identified 98% of the events as either poly(dA)100 or poly(dC)100.
Effects of Temperature on the Translocation Process.
To examine the behavior of IB, tD, and τT as a function of temperature, we performed a series of experiments with poly(dA)100 and poly(dC)100 from 15.0°C to 40.0°C. Representative data at 15.0, 25.0, and 33.0°C (Fig. 6 a–c) show that tP1 and tP2 decrease strongly with temperature in both polymer types (note the different vertical scales in Fig. 6 a–c). Although most of the parameters described in Fig. 2 are significantly altered as a function of temperature, the two polymers show different trends: (i) The poly(dA) events remain as two separate groups throughout the entire temperature range, but the poly(dC) events that begin to fall into two groups at 20°C (Fig. 2) merge into a single widely dispersed group above 25° (Fig. 6 b and c). (ii) The relative number of events in the two poly(dA) groups varies with temperature. At 15°C, nearly 50% of the total number of events are in the second group, whereas at 40°C, this fraction is reduced to only 20–25%. (iii) Particularly for poly(dA), the scattered events in group 2 become even more dispersed at low temperatures (Fig. 6a).
Figure 6.
Representative event diagrams for poly(dA)100 (blue) and poly(dC)100 (red) at three different temperatures: (a) 15.0°C; (b) 25.0°C; (c) 33.0°C. As in Fig. 2, the two polymers were examined separately. Note that because of the strong temperature dependence of tD, a different vertical scale is used for each of the three plots. (Inset) The corresponding duration and current histograms from which we extracted IB, tP, and τT (see text).
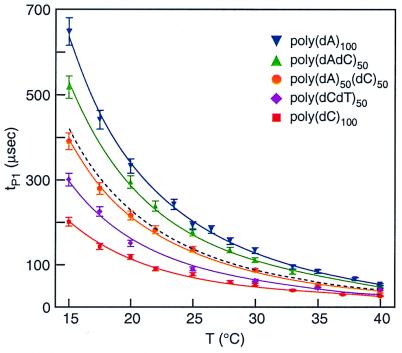
To refine these observations, we performed an extensive series of measurements from 15°C to 40°C with five polymer types: poly(dA)100, poly(dC)100, poly(dA50dC50), poly(dAdC)50, and poly(dCdT)50 (Fig. 7). For all of the polymers tested, the temperature dependence of tP is best approximated by ∼a/ T2 + b (full lines), where a is a constant that depends on the polymer type, T is the temperature in °C, and b is an additive constant (Fig. 7). The data yielded a poor fit with exponential or T−1 temperature dependence. The fact that the measured tP1 values for poly(dA50dC50) closely match the average of tP1 values for poly(dA)100 and poly(dC)100 (black dotted line) is accounted for if half of this di-block polymer contributes to tD as pure poly(dA) and half as pure poly(dC).
Figure 7.
Dependence of tP for group 1 events for poly(dA)100 (blue), poly(dC)100 (red), poly(dA50dC50) (orange), poly(dAdC)50 (green), and poly(dCdT)50 (purple). Because all poly(dCdT)50 events fall into one group, that group is considered group 1. All measurements were performed at 120 mV. Bars: SEM of more than five groups of measurements. With rising temperature between 15°C and 40°C, there is a 12-fold decrease of tP1 for the slowest polymer poly(dA) and an 8-fold decrease of tP1 for the fastest poly(dC). The dashed black line that matches closely to the poly(dA50dC50) data is the algebraic average between tP1 of poly(dA)100 and tP1 of poly(dC)100. Note that the temperature dependence is not exponential; rather, ∼T−2 scaling (solid lines) yielded the best fit to the data.
At high temperatures, the differences between polymers are diminished. For example, the ratio of tP1 for poly(dA)100 to tP for poly(dC)100 (the slowest and fastest polymers in our experiments) decreases with temperature from ∼3.2 at 15°C to ∼2.1 at 40°C. Further experiments at higher temperatures will be needed to determine whether all polymers approach a common value. If so, translocation through a nanopore could be used as a rapid measure of polymer length regardless of the polynucleotide's composition or sequence.
At low temperatures, the differences between polymers are striking. This implies that experiments at 15°C or lower should optimize the identification of individual polymers in a mixed population. For example, the discrimination between poly(dA)100 and poly(dC)100 at 22°C (shown in Fig. 2c) is enhanced at 15°C, where there is less overlap in the distribution of tD values of the two components. Other experiments with poly(dC)100 and poly(dCdT)50 show that the tP1 values for these polymers differ by 50% (300 μsec vs. 200 μsec) at 15°C, even though both polymers contain only pyrimidines. In fact, experiments at low temperatures demonstrate that as few as 10 substitutions of thymines spaced evenly throughout a 100-nt poly(dC) polymer are readily detectable (unpublished data). Thus, at low temperatures our measurements are highly sensitive to replacements of cytosines with thymines.
The strong temperature dependence of tP1 probably arises from a complex of factors affecting those portions of the polymer that are in the channel and those that are outside of the channel. The T−2 temperature dependence of tP1 cannot be accounted for by viscous drag alone, which would contribute approximately a factor of T−1 because of the temperature dependence of the buffer viscosity (5), that we measured by following the change in the open pore current as a function of temperature (not shown). The discovery of a T−2 scaling should help to estimate the contribution of factors other than drag forces to tD.
(iii) The Relation of Secondary Structure to the Translocation Process.
The observation that many polymers undergo translocation events that fall into two groups might be explained as the translocation of the same structure in either of two orientations (3′ to 5′ or 5′ to 3′) (2), or it might represent the translocation of molecules in either of two different conformations. Similarly, although the differences between the polymer types examined here may be attributable to their intrinsic chemical differences, conformational differences between the polymer types may also play an important role. For example, purine–purine interactions may give rise to base stacking between adjacent bases or to stem and loop regions (6). In particular, poly(dA) is known to undergo a transition from an extensively stacked structure near 5°C to an essentially random coil above ∼50°C (7–10). If, at low temperatures, any existing stacked structure must be broken as the DNA is translocated through the narrow α-hemolysin pore, the added time to disrupt this structure would shift tP to longer times and broaden the distribution of translocation durations, as measured by τT. At the high salt concentration used for our experiments, the time scales for unstacking homopurine polymers are commensurate with the tP2 shifts we observed (11).
Four observations imply that secondary structure and base stacking may be a predominant factor that accounts for the existence and statistical properties of group 2 events.
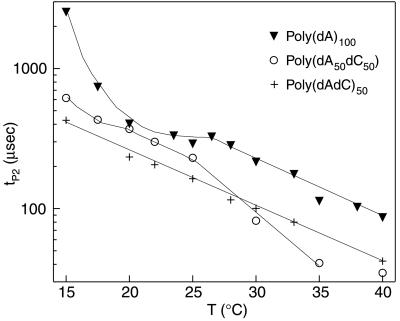
First, there is a strong temperature dependence of tP2 and τT2 in those polymers that contain long poly(dA) sequences (Fig. 8). In comparison to the well-ordered T−2 behavior of all the tP1 vs. T plots (Fig. 7), the tP2 vs. T plots for polymers containing long poly(dA) sequences are less regular, and tP2 diverges to longer durations at the lower temperatures studied. This phenomenon is pronounced with poly(dA)100, which is known to have a strong tendency for base stacking at low temperatures. In contrast, the translocation duration of poly(dAdC)50, which cannot form strong purine–purine base stacking, is approximated by an exponential (straight line in Fig. 8) over the entire temperature range. We therefore hypothesize that the irregular variation of tP2 in those polymers that contain long poly(dA) sequences is attributable to base stacking. This hypothesis is consistent with the observation that at elevated temperatures, where base stacking of poly(dA) would be diminished, the tP2 values for these polymers decrease exponentially with temperature.
Figure 8.
Semilogarithmic plot of tP2 as a function of temperature for poly(dA)100 (solid triangles), poly(dA50dC50) (empty circles), and poly(dAdC)50 (crosses). The lines connecting data points were drawn to guide the eye. The tP2 values for poly(dAdC)50 vary exponentially with temperature from 15°C to 40°, whereas the tP2 values for poly(dA)100 and poly(dA50dC50) show a greater divergence to larger values for the low temperature range (see text).
Second, observations supporting the close connection between secondary structure and the statistical properties of events in group 2 emerges from an analysis of the temporal dispersion in the two event groups. If entry into the narrow spatial environment of the α-hemolysin requires that either DNA base-stacking or stem-region structure be broken, the energy associated with this process should yield events with a greater temporal scattering. Indeed, τT2 (which provides a direct measure of temporal dispersion in group 2) for poly(dA)100 and poly(dA50dC50) diverges at low temperatures to much larger values compared with tT1 for poly(dA)100 and poly(dA50dC50) (not shown). Again, the tT2 values for poly(dAdC)50 did not show such divergence.
Third, if lower temperatures stabilize purine stacking, we would also expect that the number of events associated with structured polymers will grow with decreasing temperature. This is observed. The fraction of the events in group 2 increases from about 20% at 25°C to 45% at 15°C, for poly(dA)100 and poly(dA50dC50), while remaining nearly constant for poly(dAdC)50 (not shown).
Finally, we note that for both poly(dC50dT50) and poly(dCdT)50, in which only weak pyrimidine stacking is possible (12), the pattern of translocation events does not exhibit two groups, even at 15°C.
We therefore favor the view that the existence of two groups in the event diagram of a polymer represents translocation of molecules from a pool that includes molecules in two different conformations. Thus, the group 2 events may represent the mostly structured (base-stacked) polymers, and the group 1 events, the more unstructured randomly conformed polymers. Although we cannot exclude specific polymer-pore interactions that could produce two states of the channel, such interactions would not readily explain the strong temperature effects.
Conclusions
A nanopore makes it possible to record the coincident observation of several independent parameters (e.g., IB and tD) on traversal of a single molecule. Because it need not average signals from numerous molecules, a nanopore can therefore be an extraordinarily rich source of information (13). As shown by our results, a nanopore can discriminate between several different polynucleotides of similar length on the basis of three well-defined statistical parameters: the current peak, IP, the translocation-duration peak, D tP, and the temporal dispersion of individual events, represented by τT. Furthermore, in a favorable case, measurement of just one parameter, tD, makes it possible to discriminate between individual polynucleotides on a molecule-by-molecule basis.
Although a detailed understanding of the dynamics underlying DNA translocation through narrow channels remains to be achieved, the discovery of a universal temperature scaling for defined polymer types should lead to a better understanding of the electrostatic and drag forces operative during DNA translocation through nanopores. The strong T−2 temperature dependence of tP opens the possibility of controlling the translocation speed and enhancing the differences between numerous types of polymers. Because the ability to discriminate and characterize unlabeled DNA molecules is a central requirement for high-throughput DNA analysis, it will be important to extend our experimental approach and apply our understanding of translocation through nanopores to the analysis of a broader range of molecules than is examined here.
Acknowledgments
Research for this work was supported by the Defense Advanced Research Projects Agency (DARPA) award (no. N65236-98-1-5407). A.M. acknowledges Dr. Charles R. Cantor for financial support (DARPA contract no. N65236-98-1-5410) and for many important discussions that contributed directly to this work. We also acknowledge stimulating discussions and help in data acquisition from the members of our group, especially T. Denison, S. Henrickson, and A. Sauer. A.M. also acknowledges very useful discussions with Dr. A. Libchaber, R. Bar-Ziv, and G. Bonnet. We thank M. Burns for stimulating discussions and help with data processing.
References
- 1.Kasianowicz J J, Brandin E, Branton D, Deamer D W. Proc Natl Acad Sci USA. 1996;93:13770–13773. doi: 10.1073/pnas.93.24.13770. [DOI] [PMC free article] [PubMed] [Google Scholar]
- 2.Akeson M, Branton D, Kasianowicz J J, Brandin E, Deamer D W. Biophys J. 1999;77:3227–3233. doi: 10.1016/S0006-3495(99)77153-5. [DOI] [PMC free article] [PubMed] [Google Scholar]
- 3.Song L, Hobaugh M R, Shustak C, Cheley S, Bayley H, Gouax J E. Science. 1996;274:1859–1865. doi: 10.1126/science.274.5294.1859. [DOI] [PubMed] [Google Scholar]
- 4.Kasianowicz J J, Bezrukov S M. Biophys J. 1995;69:94–105. doi: 10.1016/S0006-3495(95)79879-4. [DOI] [PMC free article] [PubMed] [Google Scholar]
- 5.Landolt H, Börnstein R. Zahlenwerte und Funktionen aus Physik, Chemie, Astronomie, Geophysik und Technik Bd. II, Teil 5a. Berlin: Springer; 1950. p. 325. [Google Scholar]
- 6.Saenger W. Principles of Nucleic Acid Structure. New York: Springer; 1988. , Chapt. 6. [Google Scholar]
- 7.Luzzati V, Mathis A, Mason F, Witz J. J Mol Biol. 1964;10:28–41. doi: 10.1016/s0022-2836(64)80025-5. [DOI] [PubMed] [Google Scholar]
- 8.van Holde K E, Brahms J, Michelson A M. J Mol Biol. 1965;12:726–739. doi: 10.1016/s0022-2836(65)80323-0. [DOI] [PubMed] [Google Scholar]
- 9.Holcomb D N, Tinoco I., Jr Biopolymers. 1965;3:121–133. [Google Scholar]
- 10.Dewey T G, Turner D H. Biochemistry. 1979;18:5757–5762. doi: 10.1021/bi00593a002. [DOI] [PubMed] [Google Scholar]
- 11.Bonnet G, Krichevsky O, Libchaber A. Proc Natl Acad Sci USA. 1998;95:8602–8606. doi: 10.1073/pnas.95.15.8602. [DOI] [PMC free article] [PubMed] [Google Scholar]
- 12.Solie T N, Schellman J A. J Mol Biol. 1968;33:61–77. doi: 10.1016/0022-2836(68)90281-7. [DOI] [PubMed] [Google Scholar]
- 13.Braha O, Walker B, Cheley S, Kasianowicz J J, Song L, Gouaux G E, Bayley H. Chem Biol. 1997;4:497–505. doi: 10.1016/s1074-5521(97)90321-5. [DOI] [PubMed] [Google Scholar]


